Innovations in the Analysis of Chandra-ACIS Observations
As members of the instrument team for the Advanced CCD Imaging Spectrometer (ACIS) on NASA’s Chandra X-ray Observatory and as Chandra General Observers, we have developed a wide variety of data analysis methods that we believe are useful to the Chandra community, and have constructed a significant body of publicly-available software (the ACIS Extract package) addressing important ACIS data and science analysis tasks. This paper seeks to describe these data analysis methods for two purposes: to document the data analysis work performed in our own science projects, and to help other ACIS observers judge whether these methods may be useful in their own projects (regardless of what tools and procedures they choose to implement those methods). The ACIS data analysis recommendations we offer here address much of the workflow in a typical ACIS project, including data preparation, point source detection via both wavelet decomposition and image reconstruction, masking point sources, identification of diffuse structures, event extraction for both point and diffuse sources, merging extractions from multiple observations, nonparametric broad-band photometry, analysis of low-count spectra, and automation of these tasks. Many of the innovations presented here arise from several, often interwoven, complications that are found in many Chandra projects: large numbers of point sources (hundreds to several thousand), faint point sources, misaligned multiple observations of an astronomical field, point source crowding, and scientifically relevant diffuse emission.
💡 Research Summary
The paper presents a comprehensive suite of data‑analysis techniques and a publicly released software package, ACIS Extract (AE), developed by members of the ACIS instrument team and general observers to address the many challenges inherent in Chandra‑ACIS observations. Its primary goals are to document the authors’ own workflow for future reference and to provide the broader Chandra community with a clear description of methods that can be adopted regardless of the specific tools used.
The authors begin by outlining the initial data‑preparation steps that go beyond the standard CIAO pipeline. These include automated detection and removal of background flares, correction of CCD gain variations, and the re‑projection of multiple observations onto a common World Coordinate System (WCS) with sub‑pixel alignment. This “multi‑epoch registration” is crucial when a field has been observed at different roll angles or with slight pointing offsets, as it minimizes systematic position errors before source detection.
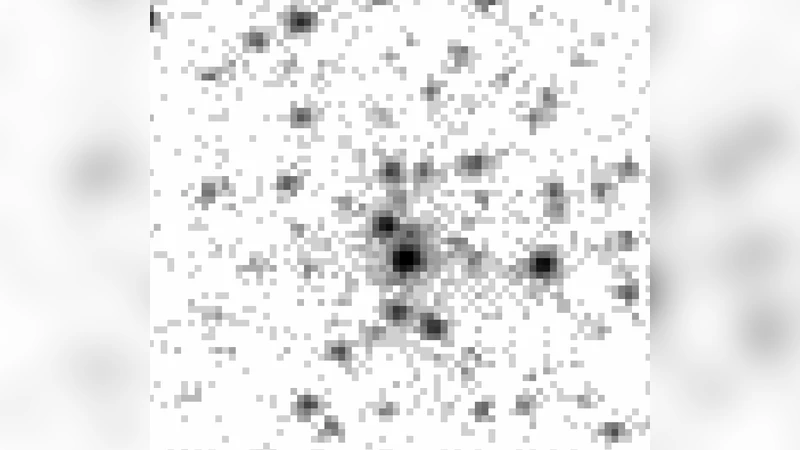
Point‑source detection is performed using two complementary approaches. First, a wavelet‑based algorithm (wavdetect) provides high completeness for large source populations, typically ranging from a few hundred to several thousand objects. Second, an image‑reconstruction technique based on the Lucy‑Richardson deconvolution is applied in crowded regions where point‑spread functions (PSFs) overlap. The two source lists are merged, and Monte‑Carlo simulations are used to assess detection significance and to control false‑positive rates. Detected sources are then masked; the mask radius is not a fixed value but is scaled with the energy‑dependent 90 % PSF encircled‑energy radius for each source, ensuring that the mask adapts to off‑axis degradation and spectral hardness.
After masking, the residual image is examined for diffuse emission. The authors employ multi‑scale Gaussian smoothing to highlight low‑frequency structures and a Bayesian block detection algorithm to evaluate the statistical significance of candidate diffuse features. This combination suppresses spurious fluctuations while preserving genuine extended emission. For each diffuse region, an iso‑surface (constant‑surface‑brightness) contour is generated to define an extraction region that follows the morphology of the emission rather than imposing a simple geometric shape.
Event extraction for both point and diffuse sources is highly customized. Point‑source extraction regions follow the 90 % PSF contour, while diffuse regions use the iso‑surface contours. For every extraction, the authors generate source‑specific Ancillary Response Files (ARFs) and Redistribution Matrix Files (RMFs) that incorporate the exact off‑axis angle, detector position, and spectral shape of the source. This per‑source response modeling is essential for accurate flux estimation, especially for faint objects.
A major innovation lies in the treatment of low‑count spectra. The paper introduces a non‑parametric broadband photometry method that measures fluxes in several broad energy bands without assuming a spectral model. For spectral fitting, the authors adopt Cash statistics within a Bayesian framework, allowing robust parameter estimation (e.g., temperature, column density) even when the total number of counts is below the traditional χ² threshold. This approach is demonstrated on several faint point sources and on the outskirts of diffuse nebulae, showing that scientifically meaningful constraints can be obtained from as few as 5–10 counts.
When multiple observations of the same field exist, AE merges the individual extractions not by simple weighted averaging but by constructing a “common response matrix” that accounts for the differing ARFs and RMFs of each observation. This method preserves the statistical independence of each dataset while delivering a combined spectrum with correctly propagated uncertainties.
Automation is a recurring theme throughout the workflow. The entire pipeline—from data reprocessing, source detection, masking, diffuse identification, extraction, to spectral analysis—is driven by Python scripts and XML configuration files. This design enables batch processing of large surveys, reduces human error, and makes the methodology reproducible. The authors provide several real‑world examples, including a crowded star‑forming region, the core of a galaxy cluster, and a supernova remnant, illustrating how AE handles source crowding, faint detections, and complex diffuse structures.
In the discussion, the authors compare AE’s performance with other publicly available tools, highlighting its superior handling of PSF variations, its flexible extraction regions, and its integrated low‑count spectral analysis. They also outline future enhancements such as machine‑learning classification of sources, GPU‑accelerated image reconstruction, and the integration of multi‑wavelength data sets.
Overall, the paper delivers a mature, end‑to‑end solution for ACIS data analysis that significantly lowers the barrier for scientists to extract high‑quality scientific results from even the most challenging Chandra observations. By making the software freely available and documenting the underlying methodology in detail, the authors provide a valuable resource that will benefit the entire X‑ray astronomy community.
Comments & Academic Discussion
Loading comments...
Leave a Comment