Network theory approach for data evaluation in the dynamic force spectroscopy of biomolecular interactions
Investigations of molecular bonds between single molecules and molecular complexes by the dynamic force spectroscopy are subject to large fluctuations at nanoscale and possible other aspecific binding, which mask the experimental output. Big efforts are devoted to develop methods for effective selection of the relevant experimental data, before taking the quantitative analysis of bond parameters. Here we present a methodology which is based on the application of graph theory. The force-distance curves corresponding to repeated pulling events are mapped onto their correlation network (mathematical graph). On these graphs the groups of similar curves appear as topological modules, which are identified using the spectral analysis of graphs. We demonstrate the approach by analyzing a large ensemble of the force-distance curves measured on: ssDNA-ssDNA, peptide-RNA (system from HIV1), and peptide-Au surface. Within our data sets the methodology systematically separates subgroups of curves which are related to different intermolecular interactions and to spatial arrangements in which the molecules are brought together and/or pulling speeds. This demonstrates the sensitivity of the method to the spatial degrees of freedom, suggesting potential applications in the case of large molecular complexes and situations with multiple binding sites.
💡 Research Summary
Dynamic force spectroscopy (DFS) is a powerful single‑molecule technique for probing the strength and kinetic parameters of biomolecular bonds, yet the raw force‑distance curves are notoriously noisy. In addition to thermal fluctuations at the nanoscale, non‑specific adhesion events, variations in pulling speed, and heterogeneous spatial arrangements of the interacting partners often obscure the true signal. Conventional data treatment—visual inspection, simple thresholding, or histogram analysis of rupture forces—fails to separate these overlapping contributions, especially when multiple binding pathways or complex assemblies are involved.
The authors introduce a graph‑theoretic workflow that converts an entire ensemble of force‑distance traces into a correlation network and then extracts groups of similar curves as topological modules using spectral graph analysis. The procedure consists of four main steps. First, each individual force‑distance curve obtained under identical experimental conditions is represented as a node. Second, the Pearson correlation coefficient between every pair of curves is computed, providing a weighted edge for the fully connected graph. Third, a correlation threshold is applied to prune weak edges, yielding a sparse adjacency matrix that captures only statistically significant similarities. Fourth, the Laplacian matrix of the resulting network is subjected to eigen‑decomposition; the leading eigenvectors (including the Fiedler vector) are fed into a modularity‑maximization algorithm (e.g., the Louvain method) to partition the graph into communities. Because nodes within the same community share high mutual correlation, each community corresponds to a set of curves generated by the same underlying molecular interaction or experimental configuration.
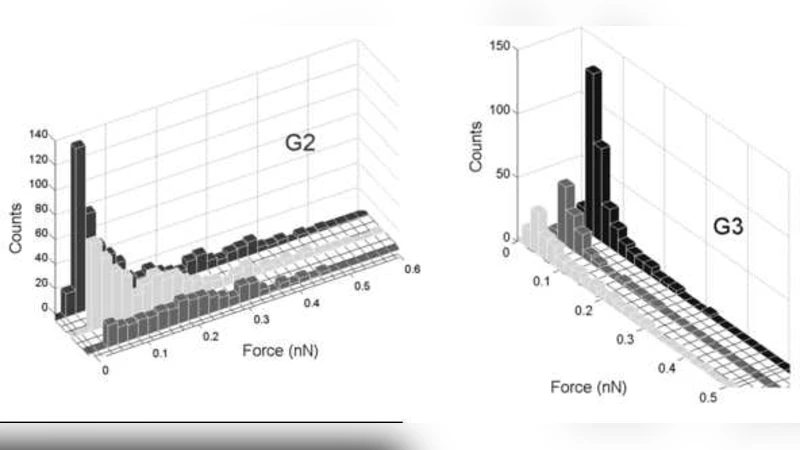
The methodology is validated on three biologically relevant systems. (1) Complementary single‑stranded DNA (ssDNA‑ssDNA) pairs produce two dominant modules: one representing single‑bond rupture events and another comprising multi‑bond or cooperative unbinding signatures. The two modules are clearly separated in both rupture force and contour length, a distinction that is blurred in conventional histograms. (2) A peptide derived from HIV‑1 and its target RNA are examined. Here, three to four sub‑modules emerge, each linked to a specific binding orientation, local secondary structure of the RNA, or pulling speed. The spectral clustering reveals subtle differences in the force‑distance profiles that correspond to distinct binding pathways, which would be invisible to a single‑parameter analysis. (3) A peptide interacting with a gold surface illustrates the method’s ability to discriminate specific versus non‑specific adhesion. At low pulling speeds a module dominated by specific peptide‑gold binding appears, whereas at higher speeds a second module reflecting rapid, non‑specific contact dominates.
These results demonstrate several key advantages. The graph‑based approach automatically filters out outliers and non‑specific events without manual curation, thereby reducing user bias. Spectral community detection is sensitive to both the shape of the force curve and its kinetic context, allowing simultaneous discrimination of multiple binding mechanisms, spatial arrangements, and experimental parameters. Moreover, once modules are identified, standard statistical analyses (e.g., Bell‑model fitting, Dudko‑Hummer‑Szabo analysis) can be applied separately to each module, yielding more accurate estimates of kinetic off‑rates and energy barrier widths.
The authors acknowledge limitations. The choice of correlation threshold influences network topology and must be optimized, potentially via cross‑validation. For very large datasets (tens of thousands of curves), constructing the full correlation matrix and performing eigen‑decomposition become computationally demanding, suggesting the need for dimensionality‑reduction pre‑processing (PCA, t‑SNE) or parallelized graph algorithms. Future extensions could incorporate non‑linear similarity measures such as dynamic time warping, develop online clustering for real‑time data streams, and apply the framework to large protein complexes or multi‑site binding scenarios where spatial heterogeneity is even more pronounced.
In summary, this study provides a robust, mathematically grounded pipeline that translates the high‑dimensional, noisy output of DFS into a network representation amenable to spectral analysis. By revealing hidden modules of similar force‑distance curves, the method enhances the reliability of kinetic parameter extraction and opens new avenues for studying complex biomolecular interactions, sensor development, and drug‑target binding assays.
Comments & Academic Discussion
Loading comments...
Leave a Comment