Near-Infrared Spectral Monitoring of Triton with IRTF/SpeX II: Spatial Distribution and Evolution of Ices
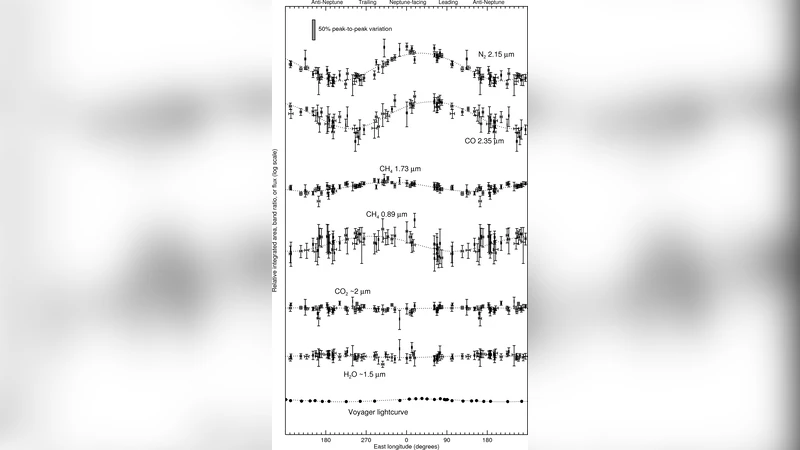
This report arises from an ongoing program to monitor Neptune’s largest moon Triton spectroscopically in the 0.8 to 2.4 micron range using IRTF/SpeX. Our objective is to search for changes on Triton’s surface as witnessed by changes in the infrared absorption bands of its surface ices N2, CH4, H2O, CO, and CO2. We have recorded infrared spectra of Triton on 53 nights over the ten apparitions from 2000 through 2009. The data generally confirm our previously reported diurnal spectral variations of the ice absorption bands (Grundy & Young 2004). Nitrogen ice shows a large amplitude variation, with much stronger absorption on Triton’s Neptune-facing hemisphere. We present evidence for seasonal evolution of Triton’s N2 ice: the 2.15 micron absorption band appears to be diminishing, especially on the Neptune-facing hemisphere. Although it is mostly dissolved in N2 ice, Triton’s CH4 ice shows a very different longitudinal variation from the N2 ice, challenging assumptions of how the two ices behave. Unlike Triton’s CH4 ice, the CO ice does exhibit longitudinal variation very similar to the N2 ice, implying that CO and N2 condense and sublimate together, maintaining a consistent mixing ratio. Absorptions by H2O and CO2 ices show negligible variation as Triton rotates, implying very uniform and/or high latitude spatial distributions for those two non-volatile ices.
💡 Research Summary
This paper presents the results of a decade‑long near‑infrared spectroscopic monitoring program of Neptune’s largest satellite, Triton, carried out with the IRTF SpeX instrument between 2000 and 2009. A total of 53 spectra, obtained over ten apparitions, cover the 0.8–2.4 µm wavelength range and sample the full rotation of the moon. The authors focus on the five most spectrally active surface ices—nitrogen (N₂), methane (CH₄), water (H₂O), carbon monoxide (CO), and carbon dioxide (CO₂)—by measuring the depth and shape of their characteristic absorption bands and tracking how these parameters change with longitude and with time.
Observations and data reduction
SpeX was used in low‑resolution mode (R≈2000). Each night the observations were timed to sample a range of sub‑Earth longitudes, allowing the construction of longitudinal maps for each ice species. Standard star observations provided flux calibration, while telluric correction and geometric modeling removed atmospheric and viewing‑geometry effects. Band depths were extracted for the N₂ band at 2.15 µm, CH₄ at 1.66 µm, H₂O at 1.50 µm, CO at 1.58 µm, and CO₂ at 2.01 µm.
Nitrogen ice
N₂ ice shows the largest longitudinal contrast. The 2.15 µm band is strongest on the hemisphere that faces Neptune (approximately 0° longitude) and weakest on the opposite side. This diurnal pattern reproduces earlier findings (Grundy & Young 2004) and is interpreted as the result of volatile transport driven by solar heating and the moon’s synchronous rotation. Importantly, the authors detect a systematic weakening of the N₂ band over the ten‑year interval, especially on the Neptune‑facing side. They argue that this trend reflects seasonal evolution: as Triton moves toward northern summer, nitrogen sublimates from low‑latitude regions and migrates toward higher latitudes, reducing the overall column density of N₂ ice in the observed hemisphere.
Methane ice
CH₄ is largely dissolved in N₂, yet its 1.66 µm band exhibits a longitudinal behavior that is almost opposite to that of nitrogen. The strongest CH₄ absorption occurs near 180° longitude, where N₂ absorption is weakest. This decoupling suggests that methane either segregates from the nitrogen matrix during sublimation or that it recondenses preferentially in regions where nitrogen ice is depleted. The result challenges simple models that assume CH₄ and N₂ share identical spatial distributions and points to more complex microphysical processes, such as differential grain growth or localized trapping.
Carbon monoxide ice
CO displays a longitudinal variation that mirrors N₂ almost exactly. The 1.58 µm CO band strengthens and weakens in step with the N₂ band, implying that CO and N₂ co‑condense and co‑sublimate, maintaining a roughly constant mixing ratio (≈0.5 % CO in N₂). This tight coupling provides a valuable constraint for atmospheric models, which must reproduce the observed co‑evolution of these two volatile species.
Water and carbon dioxide ices
Both H₂O and CO₂ show negligible rotational variability. Their absorption bands remain essentially constant with longitude, indicating that these non‑volatile ices are either uniformly distributed across the surface or confined to high‑latitude regions that are always in view. Because they are far less volatile than N₂, CH₄, and CO, they likely form a stable “ice mantle” that does not participate actively in the seasonal volatile cycle.
Interpretation and broader implications
The authors synthesize these observations into a coherent picture of Triton’s surface–atmosphere system. Volatile N₂ and CO constitute a dynamic, seasonally migrating reservoir that responds to solar insolation and the moon’s axial tilt. Methane, while partially dissolved in N₂, behaves semi‑independently, hinting at micro‑scale segregation or localized deposition. Water and CO₂ constitute a relatively inert background, possibly covering the polar caps. The observed seasonal decline of N₂ absorption is the first direct spectroscopic evidence of large‑scale volatile redistribution on Triton.
Comparisons with Pluto’s volatile transport suggest that similar processes operate on both bodies, despite differences in orbital parameters and atmospheric pressure. The paper emphasizes the need for higher‑resolution, time‑resolved observations (e.g., with JWST or future ground‑based ELTs) and for coupled thermophysical‑atmospheric models to fully understand the interplay between surface ices, atmospheric composition, and seasonal forcing.
Conclusions
- N₂ ice shows strong longitudinal contrast and a measurable seasonal weakening, especially on the Neptune‑facing hemisphere.
- CH₄ ice exhibits a longitudinal pattern that is distinct from N₂, indicating partial decoupling of the two volatiles.
- CO ice tracks N₂ closely, confirming co‑condensation and a stable mixing ratio.
- H₂O and CO₂ ices are longitudinally uniform, consistent with high‑latitude or globally distributed deposits.
- The dataset provides the most comprehensive spectroscopic record of Triton’s volatile evolution to date and offers critical constraints for future climate and atmospheric models of this enigmatic moon.
Comments & Academic Discussion
Loading comments...
Leave a Comment