Network harness: bundles of routes in public transport networks
Public transport routes sharing the same grid of streets and tracks are often found to proceed in parallel along shorter or longer sequences of stations. Similar phenomena are observed in other networks built with space consuming links such as cables, vessels, pipes, neurons, etc. In the case of public transport networks (PTNs) this behavior may be easily worked out on the basis of sequences of stations serviced by each route. To quantify this behavior we use the recently introduced notion of network harness. It is described by the harness distribution P(r,s): the number of sequences of s consecutive stations that are serviced by r parallel routes. For certain PTNs that we have analyzed we observe that the harness distribution may be described by power laws. These power laws observed indicate a certain level of organization and planning which may be driven by the need to minimize the costs of infrastructure and secondly by the fact that points of interest tend to be clustered in certain locations of a city. This effect may be seen as a result of the strong interdependence of the evolutions of both the city and its PTN. To further investigate the significance of the empirical results we have studied one- and two-dimensional models of randomly placed routes modeled by different types of walks. While in one dimension an analytic treatment was successful, the two dimensional case was studied by simulations showing that the empirical results for real PTNs deviate significantly from those expected for randomly placed routes.
💡 Research Summary
The paper introduces the concept of “network harness” to capture a ubiquitous feature of public‑transport networks (PTNs): multiple routes often travel side‑by‑side along the same sequence of stations. A harness is defined as a set of r parallel routes that share s consecutive stations, and the frequency of such occurrences is described by the harness distribution P(r,s). This metric differs from traditional node‑ or link‑centric analyses because it directly quantifies spatial overlap of whole routes rather than isolated connections.
Using timetable and route data from several major world cities (e.g., Paris, London, New York, Berlin), the authors extract the ordered list of stations for each line, slide a window of length s along each line, and count how many times exactly r lines cover the same window. The empirical P(r,s) curves for many cities follow a double power‑law form P(r,s) ∝ r^‑α s^‑β, with exponents α and β typically between 1 and 2. Larger metropolitan areas tend to exhibit higher values of r (more routes sharing a segment) more frequently, suggesting that both cost‑saving incentives and the spatial clustering of points of interest drive the observed organization.
To interpret these findings, the authors propose two complementary mechanisms. First, sharing physical infrastructure (roads, tracks, tunnels) reduces construction and maintenance expenses, encouraging planners to align routes wherever feasible. Second, urban activity centers (business districts, tourist attractions, residential hubs) are not uniformly distributed; they cluster in certain neighborhoods, creating high‑demand corridors that naturally attract multiple lines. The interplay of these forces constitutes a co‑evolutionary process between city growth and PTN design, where each influences the other in a feedback loop.
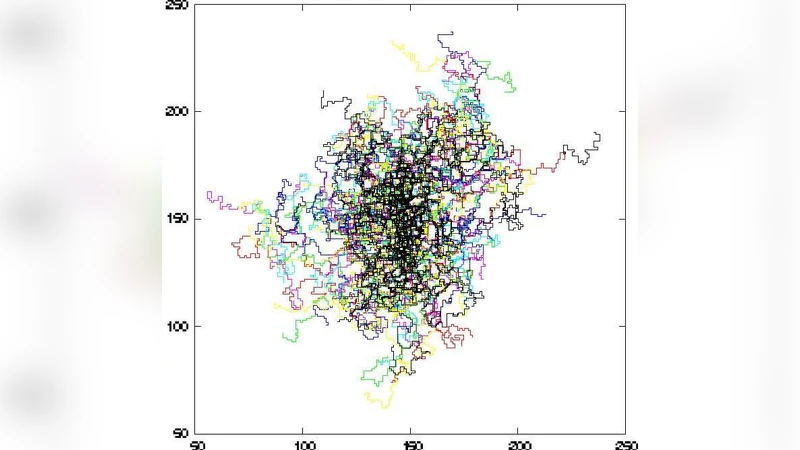
The paper then tests whether the observed power‑law behavior could arise from random placement of routes. In a one‑dimensional setting, routes are modeled as random walks with uniformly chosen start points and lengths. An exact analytical solution shows that P(r,s) follows a Poisson‑like decay rather than a power law, confirming that random placement does not generate the empirical scaling. Extending the analysis to two dimensions, the authors simulate several types of random walks on a lattice (simple, self‑avoiding, biased). All simulated harness distributions decay much faster than the empirical curves, reinforcing the conclusion that real PTNs possess a non‑random, highly organized structure.
The study acknowledges several limitations. The data set is biased toward large metropolitan systems, leaving smaller cities and suburban networks under‑explored. The harness definition ignores temporal variations (peak vs. off‑peak service frequencies), vehicle types, and passenger loads, all of which could affect the functional relevance of overlapping segments. Moreover, while the paper identifies power‑law exponents, it does not establish a quantitative relationship between those exponents and measurable urban indicators such as population size, GDP, or land‑use density.
In summary, the authors provide a novel quantitative framework for measuring route bundling in PTNs, demonstrate that many real networks exhibit scale‑free harness distributions, and show through analytical and simulation studies that such scaling cannot be explained by simple random‑placement models. The findings highlight the importance of cost‑minimization and demand concentration in shaping transport infrastructure, and they open new avenues for integrating network‑science metrics into urban planning, infrastructure investment, and the broader theory of spatially embedded complex networks.
Comments & Academic Discussion
Loading comments...
Leave a Comment