1.6 GHz VLBI Observations of SN 1979C: almost-free expansion
We report on 1.6 GHz Very-Long-Baseline-Interferometry (VLBI) observations of supernova SN 1979C made on 18 November 2002. We derive a model-dependent supernova size. We also present a reanalysis of VLBI observations made by us on June 1999 and by ot…
Authors: J.M. Marcaide, I. Marti-Vidal, M.A. Perez-Torres
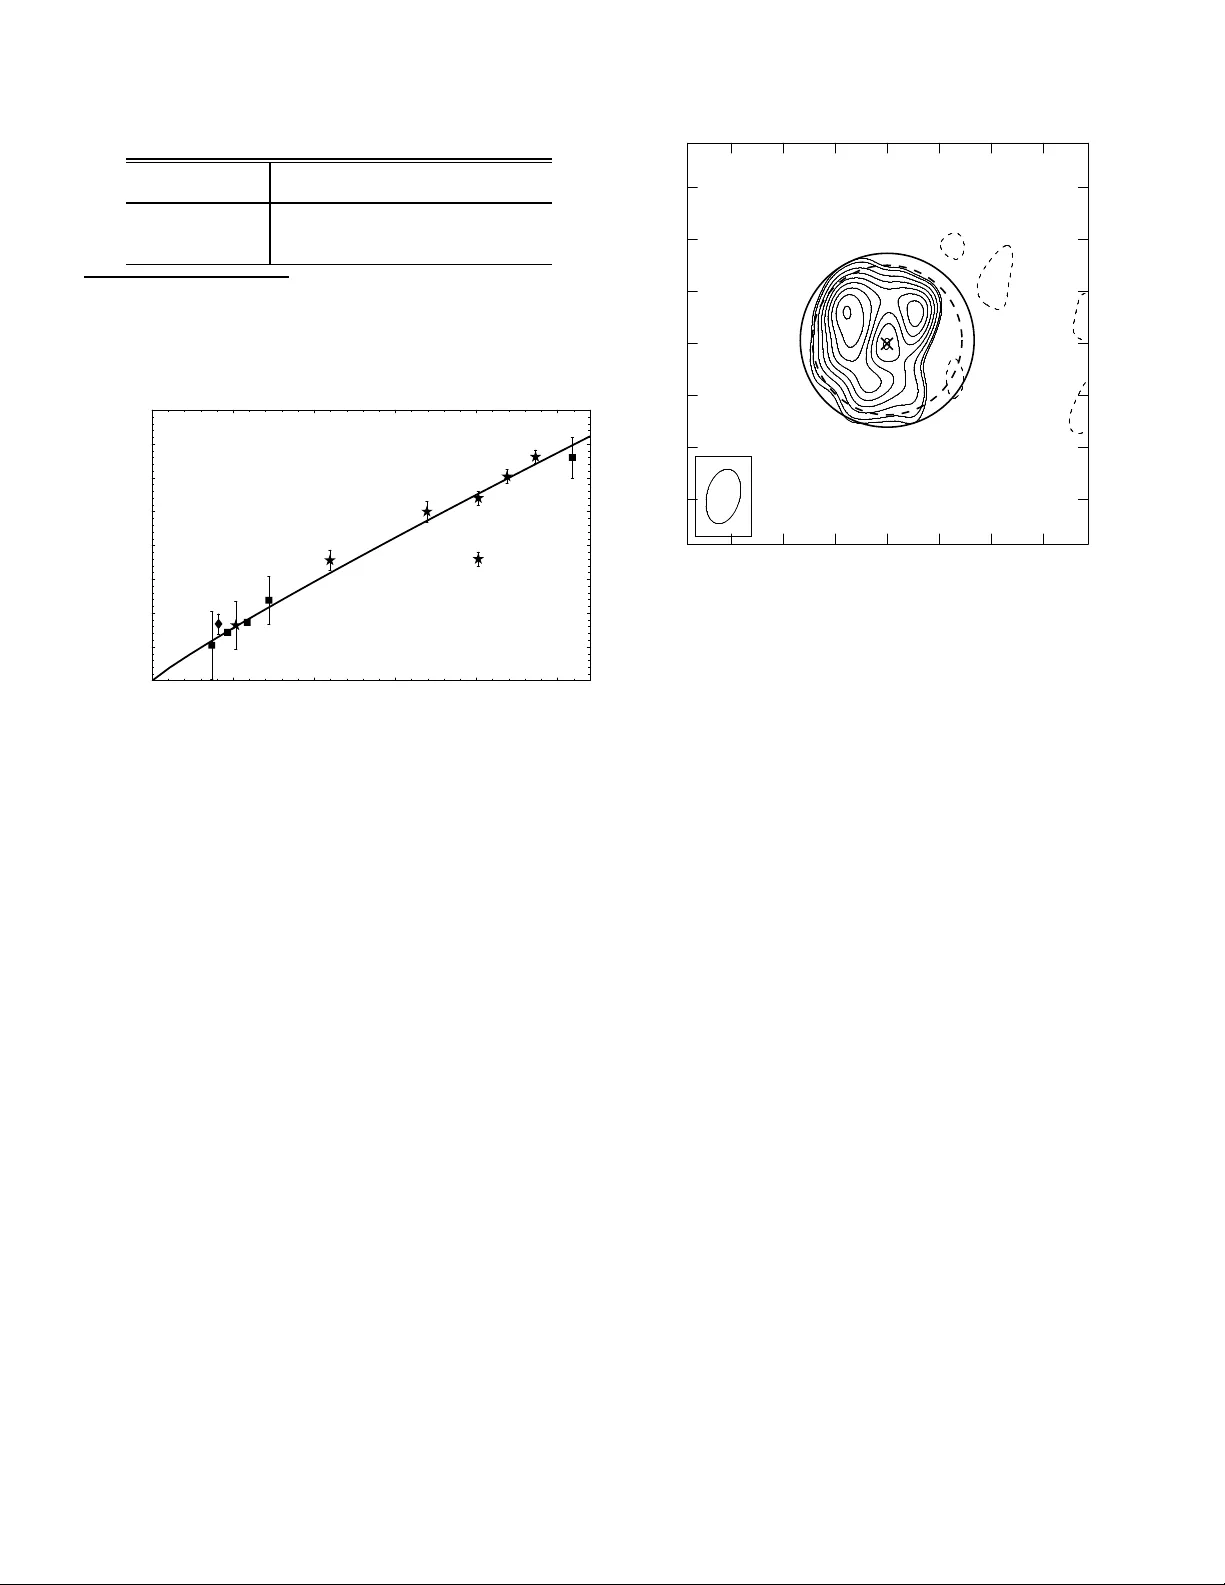
Astronomy & Astrophy sics manuscrip t no. Marcaide-SN1979 C c ESO 2021 September 13, 2021 1.6 GHz VLBI Observations of SN 1979C: almost-free expansion (Resear ch N ote) J.M. Marcaide 1 , I. Mart ´ ı-V idal 1 , 2 , M.A. Perez-T orres 3 , A. Alberdi 3 , J.C. Guirad o 1 , E. Ros 2 , 1 , and K.W . W eiler 4 1 Dpt. Astronomia i Astrof´ ısica, Uni versitat de V al ` encia, C / Dr . Moliner 50, E-46100 Burjassot (Spain) e-mail: J.M.Marcaide @uv.es 2 Max-Planck-Institut f ¨ ur Radioastronomie, Auf dem H ¨ ugel 69, D-5312 1 Bonn ( Germany ) 3 Instituto de Astrof´ ısica de Andaluc ´ ıa (CS IC), C / Camino bajo de Hu ´ etor 50, E-18008 Granada (Spain) 4 Nav al R esearch Laboratory , W ashington D.C., USA Submitted to A&A on 14 May 2009. Accepted on 7 Jul 2009. ABSTRA CT W e report on 1 .6 GHz V ery -Long-Baseline-Interferometry (VLBI) observations of supernov a SN 1979C made on 18 Nov ember 200 2. W e deriv e a model-dependent supernov a size. W e also present a reanalysis of VLBI observations made by us on June 1999 and by other authors on February 2005. W e conclude that, contrary to our earlier claim of strong deceleration in the expansion , SN 1 979C has been under going almost-free expansion ( m = 0 . 91 ± 0 . 09; R ∝ t m ) for ov er 25 years. Ke y words. radio continuum: stars – supe rnov ae: indiv idual: (S N 19 79C) 1. Introduction Supernova SN 1979C w as discovered in the V irgo Cluster galax y M 100, at a distance of 16 .1 ± 1.3 Mpc (Ferrarese et al. 1996), on 19 Apr il 1 979 (Mattei et al. 1 979). It reached an absolute mag - nitude of ∼ − 20, becoming one of the brig htest supernovae ev er observed in the optica l b and (e.g., Y oung & Branch 1989). Radio emission from SN 19 79C was detected and monitored by W eiler & Sramek (1 980) at several frequ encies. Fro m th e an alysis of the r adio lightcurves, W eiler et al. ( 1986) estimated the explo- sion date of the supernova to be 4 April 197 9, 15 days befo re its discovery . The peak flu x density obser ved by W eiler et al. was ∼ 9.8 mJy at 20 cm. This emission level and th e la rge distance to the host ga laxy , M 100, made supernova SN 19 79C the m ost luminou s rad io supernova (RSN) at its time. Sev eral VLBI observations of this supernova ha ve been made since yea r 19 82 thr ough y ear 2 005 at 5, 2.3, and 1 .6 GHz (see Bartel et al. 1985, 2003, 200 8; Barte l 1991; and Marcaide et al. 2002). From these observations, the expansion curve of the super nova was determin ed by two research groups. Each one arrived at very di ff eren t conc lusions. Bartel (1991) foun d that SN 1979 C was f reely expanding over th e first 7 years after ex- plosion. Later , Marcaide et al. (2002), using the early expansion curve published by Bartel et al. (1985) together with optical-line data and n ew VLBI ob servations made in year 1999, claimed a “stro ng dece leration” in the sup ernova expansion, star ting ∼ 6 years after explo sion. I n year 2 002, we perf ormed n ew VLBI observations of SN1979C in order to confirm this stro ng de cel- eration. Later , Bartel & Bietenholz (20 03) reported on VLBI ob- servations m ade in years 19 90, 199 6, a nd 200 1, and claim ed a practically free expansion over almo st two decad es. These re- sults we re in clear co nflict with tho se pu blished by Marcaide et al. (2002). In the next section, we describe th e d etails o f the se n ew VLBI observations o f SN 1979C an d th e calibration scheme used. In Sect. 3, w e present the r esults o btained f rom the data analysis. In Sect. 4, we describe th e results obtained after a re- analysis of the observations repor ted in Marcaide et al. (200 2). In Sect. 5 , we p resent a rea nalysis of the observations r ecently reported b y Bartel & Bietenholz (200 8). In Sect. 6 we repor t on the expansion cur ve of SN 197 9C. Finally , in Sect. 7 we summa- rize our conclusio ns. 2. Observations and Data Reduction Our 1.6 GHz ob servations were made o n 1 8 November 20 02, from 2:20 UT to 21:0 0 UT . Th e participating stations were: the co mplete V ery Long Baseline Array (VLB A; 10 an ten- nas, 25 m diam eter each, spread over the USA), Green Bank (100 m diameter , W est V irginia, USA), E ff elsberg (1 00 m d iame- ter , Germany), Robledo (70 m, Spain), W esterbo rk (phased array of s ize equiv alent to a 93 m diameter antenna , The Netherlands), and Arecibo (300 m diameter , Puerto Rico) . The r ecording rate was set to 256 Mbps, 2-bit samplin g, obtaining a total bandwid th of 64 MHz fo r all station s. The data were cross-correlated at the Array Operation s Cen ter of th e National Radio Astronom y Observatory (NRA O), in So corro, Ne w Mexico, USA. The ob servations wer e scheduled in pha se-referenc e mo de. Each cycle time was divided into a ∼ 5 min long scan of the calibrator source PKS B1157 + 1 56 and a ∼ 15 min long scan of SN 1979 C. The sle wing time of the slowest antenna between sources lasted ty pically about 1.5 min. Every 2 − 3 duty cycles, a 5 min scan o f a s econd ary calibr ator, TXS 1214 + 1 61, was ad ded. The source 3C 274 was also obser ved as a fringe finder at the be- ginning of each VLBI tape. Giv en the long duration o f the experiment and the di ff er- ent latitud es of th e stations, it was n ot possible to assign only one referen ce antenn a fo r the calibration of the whole data set. Therefo re, the obser vations were di vided into two parts for their calibration, the first one (fro m 2 :20 UT to 8:2 0 UT) was cali- brated using Robledo as referen ce antenn a, and the second one 2 J.M. Marcaide et al.: Almost-free expan sion of SN 1979C. (RN) (from 8:20 U T on wards) was calibrated u sing North Lib erty as referenc e antenn a. The cross-cor related data were imported into the NRA O pro- gram aips fo r calibration . The phases o f the 8 di ff erent IFs (o f 8 MHz wid th each ) wer e man ually aligned by fring e-fitting scans of 3C 274 and app lying the resulting antenna phases an d delays to a ll ob servations. After wards, the amplitude calib ration was perfor med using system temp eratures registered at all th e sta- tions a nd gain curves f or the anten nae. Once a hy brid image of PKS B1157 + 1 56 was obtaine d, a stand ard phase-ref erence cal- ibration o f SN 1979 C was perfo rmed taking into account th e structure of PKS B1 157 + 15 6. Finally , the v isibility am plitude calibration for SN 19 79C was refin ed by perfo rming an ampli- tude self-calibratio n o f the PKS B1157 + 156 visibilities and in- terpolating the re sulting g ains to th e SN 1979 C scans. T he cali- brated data were then exporte d from aips into the Caltech soft- ware difmap (Shepherd , Pearson & T ay lor 1995) for further re- duction and imaging. 3. Results W e Fourier-in verted th e calib rated visibilities of SN 1 979C in difmap . Using a CLEAN deconv olution, we obtained the im- age sh own in Fig. 1. The total flu x density o f the image is 2.96 mJy an d the r oot-mean -square (rm s) of th e image residu- als 0.07 mJy / beam . This phase-re ferenced image of SN 1979 C is p oint-like. Howev er, a modulation of the real part of the vis- ibilities as a fun ction of u v-distance is r eadily observable in the data (see Fig. 2). Th at is, the so urce structure is p artially re- solved by the interfer ometer . W e fitted two mod els (a unifo rm sphere an d a 30%-wid e spherical shell) to the visib ilities and obtained the corr esponding estimates o f the source size. The χ 2 -minimization was perfo rmed using the Levenberg-Marquardt algorithm (e.g., Gill & Murray 1978 ), as im plemented in the Mathematica 5.0 package (W olf ram 2003) . Th e parameter un - certainties were co mputed from the diagonal elements of the post-fit c ov ariance matrix. I n T able 1, we summa rize the results of the fits perfo rmed. The fitted radii are incompatible with those reported in Marcaide et al. (2002). 4. Reanalysis of Our Previous Observations W e reanalyzed the observations repo rted in Mar caide et al. (2002). In T able 1, we sho w the results o f such a r eanalysis, which di ff er substantially from those reported i n the original pa- per . T hus, ou r con clusion is th at som ething was no t correc tly reported in Marcaide et al. (2 002). In fact, the model used in the fit reported by Marcaide et al. (20 02) was not really a 30%-wide shell, as said, but a unifor m disc with its inner region removed (i.e., the flux density fr om radii smaller than 0.7 times the disc r a- dius had been removed). The use of such a m odified disc mod el results in a r adius estimate o f 78% of the r adius estimate o f the correct 3 0%-wide spherical- shell model. Actually , Marcaid e et al. (200 2) also repo rted the sizes corr esponding to an op tically thick source (un iform disc) and a ring . These two size estimates were co rrect, and theref ore incon sistent with the size r eported for the optically-th in 30 %-wide shell model. Howe ver , this mis- calculation went unc hecked a nd the inapp ropriate size estimate was used to c ompare with th e optical d ata and early r esults by other authors, thus leading to an inaccurate con clusion abou t the expansion of the source. The deceleration para meter derived by Marcaide et al. ( 2002) from optical- line velocities was obtained assuming that the su- pernova had be en expanding with a constant velocity durin g the Center at RA 12 22 58.668 , Dec 15 47 51.9842 CONT: SN1979C LL 1664.490 MHZ Peak flux = 2.6727 mJy/beam Levs = ( 3, 5, 9, 16, 27, 47, 81) % of Peak. Relative Dec (mas) Relative RA (mas) 60 40 20 0 -20 -40 -60 60 40 20 0 -20 -40 -60 Fig. 1. CLEAN image of SN 1 979C o btained from the obser - vations made on 18 November 2 002. The Full W idth at Half Maximum (FWHM) of the conv o lving beam is shown at the bottom-le ft cor ner (a 8 . 9 × 4 . 2 m as bea m at a p osition ang le of − 2 . 6 ◦ ). 10 20 30 40 - 2 - 1 0 1 2 3 4 5 Real part of visibility (mJy) UV distance (M ) λ Fig. 2. Real p art o f the visibilities taken at epoch 1 8 November 2002 as a function o f d istance in Fourier space. The visibilities have b een averaged into 300 ra dial bin s f or obtaining a clear plot. The solid line corr esponds to a 30%- wide spherica l shell mo del fitted to the visibilities (see text and T able 1). first 5 y ears a fter exp losion. Basically , the authors a ssigned the mean optical-lin e velocity measured during the first 6 weeks af - ter explosion to the expansion velocity du ring th e fifth year af - ter explosion. The main argumen t for suc h an assumption was that the ratio of the e arly optical-line velocity and the veloc- ity derived f rom VLBI at yea r 5 after explosion was ∼ 0. 7, that expected for a 30%-w ide shell o f a supernova (Mar caide et al. 2002, 2009). Howe ver , if the assump tion of a f ree expa nsion over the first 5 years is relaxed, things look di ff erent. W ith an assumption of deceleration of the supern ova begin- ning o n d ay 70 after explosion, the ejecta velocity at year 5 af- ter explosion would be ∼ 25% lower than th e velocity estimated J.M. Marcaide et al.: Almost-free expan sion of SN 1979C. (RN) 3 T able 1. Results of modelfitting to the SN 1 979C visibilities. Age Freq. Radius (mas) (years) (GHz) Uniform Sphere 30%-W ide Shell 20.12 a 1.6 2.70 ± 0.10 2.27 ± 0.10 23.65 b 1.6 3.31 ± 0.10 2.81 ± 0.08 25.92 c 5.0 3.30 ± 0.30 2.84 ± 0.26 a Re-analysis of the observ ations reported in Marcaide et al. (2002). b Observ ations r eported in this paper . c Re-analysis of the observation s reported in Bart el & Bietenholz (2008). 5 10 15 20 25 0.5 1 1.5 2 2.5 3 3.5 4 Radius (mas) Age (years) B03 B03 B03 M09 M09 BM05 B03 B03 M02 Fig. 3. Expansion curve of SN 19 79C using all the av ailable VLBI data. Squares are data at 5 GHz, diam onds at 2.3 GHz , and stars at 1.6 GHz. All these values (except the o ne marked with M02) have b een obtained using the same model fitted to th e visi- bilities (a homogeneou s sphere). Epoch s until year 5 after explo- sion are taken from Bartel et al. (198 5), M02 refers to Marcaide et al. (2002), B03 refers to Bartel & Bietenholz (2003), M09 refers to t he observations here reported (inclu ded the re-analysis of the observations reporte d in Marcaide et al. 200 2), and BM05 refers to the o bservations reported in Bartel et al. ( 2008), which we ha ve reanalyzed for estimating the source size (see text). The solid line is a fit with a time power law (i.e. , R = K t m , with m = 0 . 9 1 ± 0 . 0 9). from a f ree exp ansion, but th e estimated fractio nal shell width would be 0.53; an unrealistically wide shell. Howe ver , this shell width estimate should be interpr eted as an upper bound , giv en that th e op tical-line emission m ay o riginate in a coo l region be- hind the shocked ejecta (Chev alier & Fransson 1994) and , thus, any com parison between o ptical-line velocities an d those in- ferred f rom VLBI (which are ad ditionally a ff ected by any un- certainty in the distance estimate) sh ould not be taken at face value for the derivation of the supern ova expan sion cur ve. The fit of a hom ogeneo us spher e to the data was registered in the research log s, but it was not repo rted in Mar caide et al. (2002). A direct com parison o f that size with those repor ted by Bartel et al. (1985) is also totally compatible wit h an almost free expansion, as is now shown in Fig . 3. Given that Bartel et al. used a unifor m sp here to fit all their o bservations, Mar caide et al. (2002) sho uld ha ve also used this same m odel b ut instead, and unfor tunately , they used a scaling factor, b ased on simulatio ns, to convert the sizes re ported b y Bartel e t al. ( 1985) into sizes correspo nding t o a shell model. Center at RA 12 22 58.66750162 , Dec 15 47 51.9699999 SN1979C IPOL 4987.490 MHZ Cont peak flux = 0.193 mJy/beam Levs = (-25, 25, 30, 40, 50, 60, 70,80,90,99) % of Peak Relative Dec (mas) Relative RA (mas) 6 4 2 0 -2 -4 -6 6 4 2 0 -2 -4 -6 Fig. 4. CLEAN image obtaine d after a r eanalysis o f the ob ser- vations reported in Bartel & Bietenho lz (2008). The contin uous and dash ed lines cor respond to a sphere and a 30 %-wide spher- ical shell fitted to the visibilities. The center of th e models has been fixed at the l ocation of the ce ntral minimum intensity of the image (marked with a cross). 5. Reanalysis of Observ ations by Other A uthors Bartel & Bietenholz (2008) hav e recently r eported on new VLBI observations of S N 1979 C, made at 5 GHz on 25 February 2005. From these observ ations, the autho rs fou nd a shell-like structure for SN 1979 C. Ho w ev er , the authors postponed an estimation of the source size to a future publication. In order to o btain the most co mplete expansion curve, we have reanalyzed their d ata (already public NRA O arc hiv e data) , following the same steps described in Bartel & Bietenholz (2008), except for our decision not to ph ase self-calib rate th e data given the hig h no ise of the visibilities comp ared to the flux density of the sup ernova. Ou r decision translates into a slightly higher rms of the map residuals (20 µ Jy beam − 1 in o ur image com pared to the 11 µ Jy b eam − 1 re- ported by Bartel & Bietenholz). Otherwise, our image (shown in Fig. 4) is similar to that reported in Bartel & Bietenholz (200 8 ). In o ur fits to d etermine the size of the source, we only used th e visibilities with distances in Fourier space sho rter than 50 M λ . This way we a voided any possible b ias ar ising f rom the use of di ff erent shell resolutions between epochs. W e cen tered the fitting models at the locatio n of the central inten sity mini- mum of th e im age ( where th e shell center is supp osed to be). Had we set th e sou rce po sition as a free parameter in the fit, it would have biased th e estimated source size, due to the large shell inhomogen eities. The center of th e fitted sour ce would hav e fallen clo se to the im age peak and the fitted size would ha ve been, ther efore, mainly related to the size of the main blo b of the image, instead of to the size of the shell. The CLEAN im age of SN 1979C, togeth er with the fitted sphere and spherical-shell model, is sho wn in Fig. 4. The sizes estimated from the fits to th e visibilities are also shown in T able 1. 4 J.M. Marcaide et al.: Almost-free expan sion of SN 1979C. (RN) 6. The Expansion Curve Figure 3 sho ws all the av ailab le size es timates of SN 1 979C over the last 2 5 y ears. Estimates fr om epoc hs earlier than 5 y ears af - ter explosion are from Bartel et al. (1985), estimate labelled M02 is fro m Mar caide e t al. (2002), estima tes labelled B03 are fr om Bartel & Bietenho lz (2 003), estimates labelled M 09 refer to th e observations repor ted here and to those wrong ly repo rted as M02 and here reanalyzed , an d estimate BM05 refers to the obser va- tions reported in Bartel et al. (2 008) an d here reanalyzed . All size estimates (but M02) have been obtained mod el fitting a ho- mogene ous spher e to the visibilities as in Bartel et al. (1985). Modelling the expansion c urve with a standard χ 2 minimiza- tion using a time power law (i.e. , R ∝ t m , see Chev alier 198 2) giv es an expansion index m = 0 . 91 ± 0 . 09, compatib le with a f ree expansion ( m = 1). T hus, we conclude tha t supernova SN 1979 C has bee n expandin g with out significan t deceler ation for mo re than two decades. Actually , includ ing BM05 in the fit does not change the result at all. At this epoch the size appears a bit smaller than expected b u t the uncertainty in the size deter mi- nation is large (an d it could be even larger consider ing th at our criteria to center the fitting model may be partially inadequ ate.) 7. Conclusions W e report on 1.6 GHz VLBI o bservations o f SN 19 79C made on November 200 2. T he phase-r eferenced ima ge o f the sup er- nova does n ot show a clear structure and h as a to tal flux den- sity of 2 . 96 ± 0 . 06 mJy . Th e size estimates, co mpared to all the other available VLBI results (but those reported in Marcaid e et al. 200 2) are comp atible with a nearly-free expanding supernova for more than two decades. W e reanalyzed the o bservations r e- ported in Marcaide et a l. (2002) an d found that, f or r easons gi ven in the text, the re sults a nd conclusions then pub lished were not correct. The expansion curve resu lting f rom the reanalysis of all the VLBI data ( including the obser vations rep orted in Bar tel & Bietenh olz 2008) r esults in a new expansion model which is compatible with a near ly-free expansion for over mo re than two decades (expansion index of 0.91 ± 0.09) . Acknow ledge ments. The National Radio Astronomy Observato ry is a facili ty of the National Science Foundati on operated under coop erati ve agreement by Associate d Uni versities, Inc. T he 100-m telescop e at E ff elsberg is a facility of the MPIfR (Max-Planck-Instit ut f ¨ ur Radioast ronomie). T he W esterbork Synthe sis Radio T elescope is operated by the Netherlands Institute for Radio Astronomy ASTR ON, with support of NWO. The Arecibo Observat ory is the principa l fa- cilit y of the National A stronomy and Ionosphere Center , which is operated by the Cornell Uni versity under a cooperat iv e agreemen t with the National Science Founda tion. This work has been partial ly founded by grants A Y A2006-14986 - CO2-01 and A Y A2005-08561-C03 of the Spanish DGICYT . KWW wishes to thank the O ffi ce of Nav al Research Laborat ories for the 6.1 funding s upportin g this research. IMV is a fello w of the Ale xander von Humboldt Founda tion. References Bartel , N. , Rogers, A.E.E. , Shapiro, I.I., et al. 1985, Nature, 318, 25 Bartel , N. 1991, in Supernov ae, ed. S. E. W oosley (Be rlin: Springer), 503 Bartel , N. , & Bieten holz, M.F . 2003, ApJ, 591 , 301 Bartel , N. , & Bieten holz, M.F . 2008, ApJ, 682 , 1065 Che v alier , R.A. 1982, ApJ, 259, 302 Che v alier , R.A., & Fransson, C. 1994, ApJ, 420, 268 Ferrarese, L., Freedman, W . L. , Hill, R. J., et al. 1996, ApJ, 464, 568 Gill., E. & Murray , W . 1978, SIAM J. Numer . Anal., 15, 977 Marcai de, J.M., P ´ erez-T orres, M.A. , Ros, E., et al. 2002, A&A, 384, 408 Marcai de, J.M., Mart ´ ı-V idal, I., Alberdi, A., et al. 2009, A&A, acce pted (arXi v:0903.3833 ) Mattei , J., Johnson, G. E., Rosino, L ., Rafanel li, P . & Kirshner , R. 1979, IA U Circ., 3348 Shepherd M. C., Pearson T . J., & T aylor G. B. 1995, BAAS, 26 , 987 W eiler , K. W . & Sramek, R. A. 1980, IA U Circ., 3485 W eiler , K. W ., Sramek, R. A., Panagia , et al. 1986, ApJ, 301, 790 W olfram S. 2003, The Mathema tica book (5th ed.; W olfram Media) Y oung, T . R. & Branch, D. 1989, ApJ, 342, L79
Original Paper
Loading high-quality paper...
Comments & Academic Discussion
Loading comments...
Leave a Comment