A statistical analysis of product prices in online markets
We empirically investigate fluctuations in product prices in online markets by using a tick-by-tick price data collected from a Japanese price comparison site, and find some similarities and differences between product and asset prices. The average price of a product across e-retailers behaves almost like a random walk, although the probability of price increase/decrease is higher conditional on the multiple events of price increase/decrease. This is quite similar to the property reported by previous studies about asset prices. However, we fail to find a long memory property in the volatility of product price changes. Also, we find that the price change distribution for product prices is close to an exponential distribution, rather than a power law distribution. These two findings are in a sharp contrast with the previous results regarding asset prices. We propose an interpretation that these differences may stem from the absence of speculative activities in product markets; namely, e-retailers seldom repeat buy and sell of a product, unlike traders in asset markets.
💡 Research Summary
The paper conducts a high‑frequency empirical investigation of product price dynamics in online retail markets, using tick‑by‑tick price records scraped from a major Japanese price‑comparison website. The authors compile a panel of thousands of identical products sold by dozens of e‑retailers, yielding over one hundred million price observations spanning two years. Their primary aim is to determine whether product prices exhibit statistical regularities similar to those documented for financial assets, and to identify any systematic differences that may arise from the distinct nature of product markets.
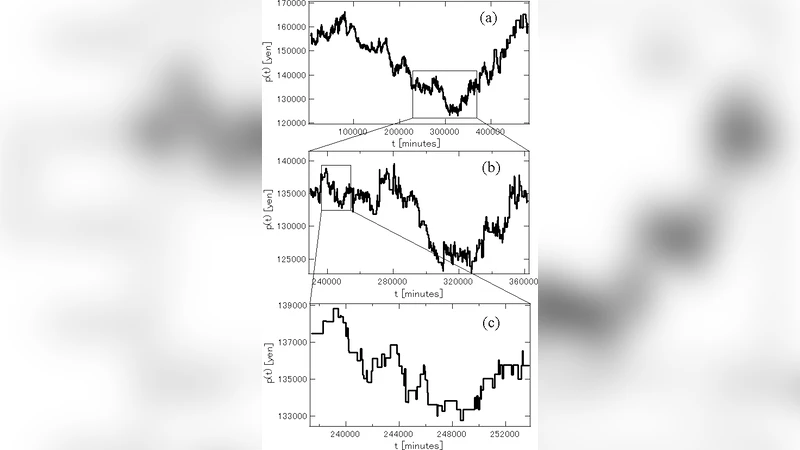
First, the authors construct a time series of the cross‑sectional average price for each product at each tick. Unit‑root tests (ADF and Phillips‑Perron) reveal that the average price series generally contain a unit root, indicating that the series behaves like a random walk with no mean‑reverting tendency. Autocorrelation functions of the first‑difference series decay to zero after a single lag, confirming that the differenced series resembles white noise. This finding mirrors the classic random‑walk property of asset prices.
Second, the study examines short‑run directional dependence by calculating conditional probabilities of price moves given previous moves (e.g., P(up|up↑), P(down|down↓)). The results show a modest but statistically significant increase in the likelihood of a price continuing in the same direction after two or more consecutive moves (probabilities around 0.55–0.60 versus the null 0.5). This “trend‑persistence” or clustering of price direction is reminiscent of the momentum‑type effects reported in equity and foreign‑exchange markets, suggesting that even in a non‑speculative environment, retailers may adjust prices in a correlated fashion, perhaps due to shared cost shocks or competitive responses.
Third, the authors investigate volatility dynamics. They compute absolute price changes (|Δp|) and analyze their autocorrelation structure over horizons up to 30 days (≈2.6 million ticks). While a weak positive autocorrelation is observed at the very short horizon (within a few minutes), the autocorrelation quickly decays to zero, and the Hurst exponent estimated via the Geweke‑Porter‑Hudak (GPH) method lies between 0.51 and 0.54. In contrast, financial asset volatility typically exhibits long‑memory with H≈0.7–0.9. Hence, product price volatility lacks the persistent clustering (“volatility clustering”) that characterizes asset markets.
Fourth, the distribution of price changes is examined. Log‑log plots of the tail and log‑linear plots of the central region indicate that an exponential distribution fits the data far better than a power‑law (Pareto) distribution. Maximum‑likelihood estimation and information‑criterion comparisons (AIC, BIC) confirm the superiority of the exponential model. Consequently, extreme price jumps are far less frequent than in financial markets, where returns follow heavy‑tailed power‑law distributions.
The authors interpret these divergences as a consequence of the absence of speculative trading in product markets. In asset markets, the same security is repeatedly bought and sold, allowing traders’ expectations, herd behavior, and risk‑management strategies to amplify price swings and generate long‑memory volatility. By contrast, e‑retailers typically set a price once per inventory cycle and rarely “turn over” the same unit for profit, so price adjustments are driven mainly by cost changes, inventory considerations, and competitive pricing, leading to more memoryless, exponentially distributed fluctuations.
The paper concludes with a discussion of limitations and future research directions. The dataset is confined to Japan, so cross‑cultural validation is needed. Product categories may differ in price elasticity and promotional intensity, suggesting a need for disaggregated analysis. Moreover, isolating the impact of explicit promotions (flash sales, coupons) could refine the understanding of non‑speculative price shocks. Despite these caveats, the study provides a rigorous benchmark for the stochastic behavior of online product prices and highlights how market microstructure—specifically the lack of speculation—fundamentally shapes price dynamics.
Comments & Academic Discussion
Loading comments...
Leave a Comment