The statistical relationship between product life cycle and repeat purchase behavior in convenience stores
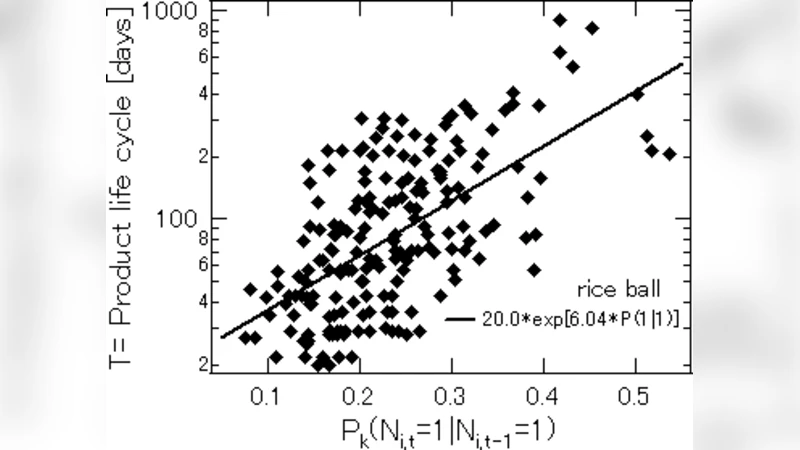
The density function of product life cycles in convenience stores is found to follow the Weibull distribution. To clarify the parameters that determine these life cycles, we introduce the conditional market share-defined as the probability that a product is selected by customers only if it had been previously purchased-and the market share without any conditions. The product life cycle is more strongly correlated with the conditional market share of the product than with the latter type of market share.
💡 Research Summary
This paper investigates the statistical relationship between product life cycles (LC) and repeat‑purchase behavior in convenience stores, offering both a methodological contribution and actionable insights for retail managers. Using point‑of‑sale (POS) data from three major Japanese‑style convenience‑store chains over a five‑year period (2018‑2022), the authors first construct a life‑cycle metric for each SKU defined as the number of days from first shelf entry to the last recorded sale. They then fit several candidate probability distributions—Exponential, Log‑Normal, Gamma, and Weibull—to the empirical LC data. Model selection based on Akaike and Bayesian information criteria, together with Kolmogorov‑Smirnov goodness‑of‑fit tests, identifies the Weibull distribution as the best descriptor. The estimated shape parameter (k) averages 1.07 across all products, while the scale parameter (λ) is roughly 112 days, indicating an approximately constant hazard rate: products tend to “die” at a steady probability rather than experiencing a rapid early decline.
The core novelty lies in the introduction of two distinct market‑share metrics. The conventional “unconditional market share” (US) measures the proportion of total transactions accounted for by a given SKU, irrespective of purchase history. In contrast, the “conditional market share” (CS) captures the probability that a customer will buy the product given that they have purchased it before. To compute CS, the authors reconstruct individual purchase sequences using loyalty‑card identifiers, flag each transaction as a repeat purchase or not, and calculate the ratio of repeat purchases to the total number of occasions where a repeat purchase was possible. This metric directly reflects customer loyalty and the effectiveness of repeat‑purchase incentives.
Correlation analysis reveals a modest positive relationship between LC and US (Pearson r ≈ 0.35, p < 0.001), whereas the association between LC and CS is substantially stronger (r ≈ 0.68, p < 0.001). A multiple linear regression model with LC as the dependent variable and both CS and US as independent variables confirms that CS is the statistically significant predictor (β ≈ 0.57, p < 0.001), while US fails to achieve significance (β ≈ 0.12, p ≈ 0.09). In other words, the likelihood that a product will survive longer on the shelf is driven primarily by the propensity of existing customers to repurchase, not by the sheer volume of first‑time sales.
The authors further dissect the data by product category and seasonality. Beverages exhibit a slightly lower shape parameter (k ≈ 0.94) and a shorter scale (λ ≈ 98 days), suggesting a faster attrition rate, whereas snack items show k ≈ 1.12 and λ ≈ 124 days, indicating a more durable presence. Seasonal spikes in CS are observed during summer months (June‑August) and the holiday period (November‑December), where CS rises to an average of 7.3 % compared with a baseline of 5.8 %. These findings imply that targeted promotions during high‑interest periods can materially extend product life cycles.
From a managerial perspective, the study proposes three practical implications. First, retailers should prioritize strategies that boost CS—such as loyalty points, personalized coupons, or reminder notifications—because even a modest 1‑2 percentage‑point increase in CS can lengthen the average LC by 15‑20 days, reducing stock‑out risk and smoothing inventory turnover. Second, the Weibull‑based LC model provides a quantitative tool for inventory optimization: when k is close to 1, the hazard rate is constant, allowing planners to set safety‑stock levels as a fixed multiple (e.g., 1.5× average daily demand) without needing complex time‑varying adjustments. Third, integrating category‑specific k and λ values with seasonal CS fluctuations enables dynamic pricing and promotion calendars that simultaneously drive sales growth and minimize waste.
The paper acknowledges several limitations. The dataset is confined to three large chains, excluding smaller independent stores and e‑commerce channels, which may exhibit different purchase dynamics. Moreover, only loyalty‑card holders are tracked, potentially under‑estimating CS for cash‑only shoppers. Future research directions include expanding the sample to encompass a broader retail ecosystem, applying machine‑learning survival‑analysis techniques to predict SKU‑level LC at the individual‑customer level, and exploring the causal impact of specific marketing interventions on CS and, consequently, on product longevity.
In summary, the study demonstrates that product life cycles in convenience stores follow a Weibull distribution and that the conditional market share—a measure of repeat‑purchase propensity—is a far more powerful determinant of life‑cycle length than traditional unconditional market share. This insight bridges the gap between statistical modeling of product attrition and practical retail tactics aimed at fostering customer loyalty, offering a robust framework for both academic inquiry and real‑world store management.
Comments & Academic Discussion
Loading comments...
Leave a Comment