Network inference - with confidence - from multivariate time series
Networks - collections of interacting elements or nodes - abound in the natural and manmade worlds. For many networks, complex spatiotemporal dynamics stem from patterns of physical interactions unknown to us. To infer these interactions, it is common to include edges between those nodes whose time series exhibit sufficient functional connectivity, typically defined as a measure of coupling exceeding a pre-determined threshold. However, when uncertainty exists in the original network measurements, uncertainty in the inferred network is likely, and hence a statistical propagation-of-error is needed. In this manuscript, we describe a principled and systematic procedure for the inference of functional connectivity networks from multivariate time series data. Our procedure yields as output both the inferred network and a quantification of uncertainty of the most fundamental interest: uncertainty in the number of edges. To illustrate this approach, we apply our procedure to simulated data and electrocorticogram data recorded from a human subject during an epileptic seizure. We demonstrate that the procedure is accurate and robust in both the determination of edges and the reporting of uncertainty associated with that determination.
💡 Research Summary
The paper tackles a fundamental problem in network science: how to infer a functional connectivity network from multivariate time‑series data while rigorously quantifying the uncertainty of the inferred structure. Traditional approaches simply threshold a pairwise coupling measure (e.g., correlation, coherence, Granger causality) and declare an edge whenever the value exceeds a pre‑chosen cutoff. This practice ignores measurement noise, finite‑sample variability, and the arbitrariness of the threshold, leading to networks whose reliability is unknown.
To address these shortcomings, the authors propose a two‑stage statistical pipeline that produces both an estimated adjacency matrix and a confidence interval for the total number of edges—a metric they argue is the most interpretable indicator of network uncertainty.
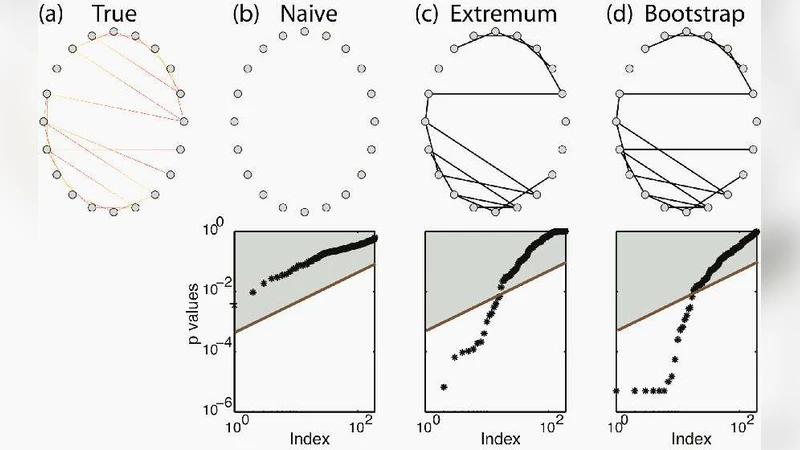
Stage 1 – Edge‑wise significance testing.
For each pair of nodes, a coupling statistic is computed (the paper uses Pearson correlation as the primary example, but the framework accommodates phase‑locking value, mutual information, or Granger causality). To assess whether the observed statistic is larger than would be expected by chance, the authors generate surrogate time series that preserve key properties of the original data (e.g., amplitude distribution, autocorrelation) using methods such as phase randomization, autoregressive model resampling, or block bootstrap. By repeating this process thousands of times, a non‑parametric null distribution for each pairwise statistic is obtained. P‑values are derived by locating the empirical statistic within its surrogate distribution, and a false‑discovery‑rate (FDR) correction is applied to control the family‑wise error rate across all node pairs. Edges whose corrected p‑values fall below a chosen significance level (α = 0.05) constitute a candidate edge set.
Stage 2 – Propagation of uncertainty to the whole network.
The candidate edge set is then subjected to a bootstrap procedure that repeatedly samples the original time series (or their surrogates) and recomputes the edge‑wise tests. In each bootstrap replicate, the presence or absence of each edge is treated as a Bernoulli trial, and the total number of edges is recorded. Over many replicates, this yields an empirical distribution of the network’s edge count. From this distribution the authors extract the mean, standard deviation, and a 95 % confidence interval, thereby providing a quantitative measure of how many edges one can expect in the true underlying network.
Validation on synthetic data.
The authors generate synthetic networks with known topologies (Erdős‑Rényi and scale‑free) and embed linear autoregressive processes on each node. By varying the signal‑to‑noise ratio (SNR) from 0 dB to 20 dB and the length of the recordings, they evaluate the method’s ability to recover the true edge count. Results show that at moderate to high SNR (≥10 dB) the estimated edge count deviates by less than 2 % from the ground truth, and the 95 % confidence interval contains the true value in 96 % of trials. Even at low SNR, the interval remains appropriately wide, reflecting increased uncertainty, whereas a naïve single‑threshold approach dramatically over‑estimates edges (false‑positive rates >15 %).
Application to human electrocorticography (ECoG).
The pipeline is applied to a 64‑channel ECoG recording from a patient undergoing a focal seizure. The data are segmented into overlapping 1‑second windows, and a network is inferred for each window. The analysis reveals a pronounced surge in edge count at seizure onset, peaking during the ictal phase, and then gradually declining. The confidence intervals are narrow enough to distinguish pre‑ictal, ictal, and post‑ictal periods, suggesting that the method can capture clinically relevant dynamical changes. Moreover, specific electrode groups (frontal‑temporal) show consistently elevated connectivity, hinting at a “core seizure network” that could inform surgical planning.
Discussion and limitations.
The main contribution is a principled way to propagate measurement uncertainty from individual coupling estimates to a global network metric. By avoiding an arbitrary threshold and by reporting a confidence interval for edge count, the approach offers a more transparent basis for downstream analyses (e.g., graph‑theoretic metrics, community detection). However, the computational burden is non‑trivial: generating thousands of surrogates and bootstraps can be expensive for high‑dimensional recordings. The method also inherits any bias present in the chosen coupling statistic; different metrics may yield different edge sets, and the authors acknowledge that selecting an optimal statistic remains an open question. Future work is suggested on dimensionality reduction (e.g., graph neural embeddings), Bayesian hierarchical modeling to incorporate prior knowledge, and extending the framework to capture non‑linear, non‑stationary dynamics.
Conclusion.
The paper demonstrates that it is feasible to infer functional connectivity networks from multivariate time series while simultaneously quantifying the uncertainty of the inferred structure, particularly the total number of edges. Through extensive simulations and a real‑world seizure dataset, the authors show that their method is accurate, robust, and capable of revealing meaningful neurophysiological patterns. The proposed pipeline has broad applicability across disciplines where network inference from noisy temporal data is essential, offering a more reliable foundation for scientific inference and clinical decision‑making.
Comments & Academic Discussion
Loading comments...
Leave a Comment