A Time-Series Analysis of the H-alpha Emission Line in V3885 Sagitarii
Flickering is a phenomenon related to the mass accretion observed among many classes of astrophysical objects. In this paper we present a study of the flickering emission lines and continuum of the Cataclysmic Variable V3885 Sgr. The flickering behavior is first analyzed through statistical analysis and lightcurves power spectra. Autocorrelation techniques are then employed to estimate the flickering flares timescales. A cross correlation study between the line and its underlying continuum variability is presented. The cross correlation between the photometric and spectroscopic data is also discussed. The periodograms, calculated using emission line data, show a behavior that is similar to those obtained from photometric datasets found in the literature, with a plateau at lower frequencies and a power law at higher frequencies. The power law index is consistent with stochastic events. The cross-correlation study indicates the presence of a correlation between the variability on H-alpha and its underlying continuum. Flickering timescales derived from the photometric data were estimated as 25 minutes for two lightcurves and 10 minutes for one of them. The average timescales of the line flickering is 40 minutes, while for its underlying continuum it drops to 20 minutes.
💡 Research Summary
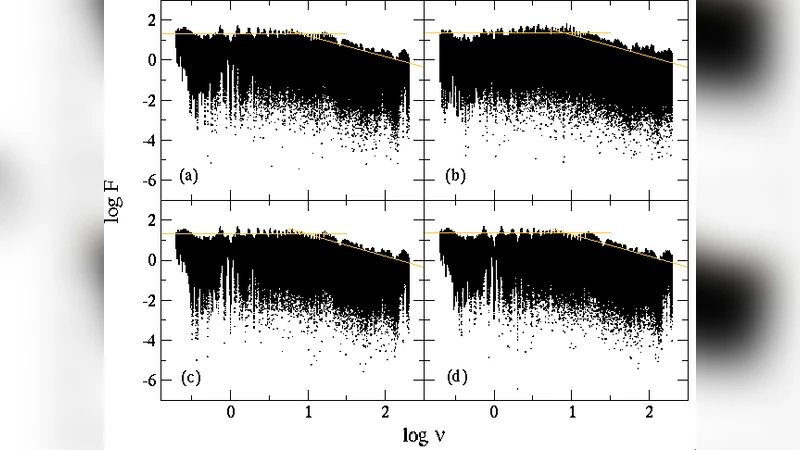
This paper presents a comprehensive time‑series analysis of the flickering phenomenon observed in the cataclysmic variable V3885 Sagitarii, focusing on the Hα emission line and its underlying continuum. The authors first performed a statistical characterization of the flickering by removing the mean level from each light curve, calculating standard deviations and variability coefficients, and then constructing power spectra via Fourier transforms. The resulting periodograms display a classic two‑regime shape: a low‑frequency plateau indicating the presence of long‑timescale variations, and a high‑frequency region that follows a power‑law with an index of roughly –1.5. This spectral slope is consistent with stochastic, shot‑noise‑like events rather than coherent oscillations.
In the time domain, autocorrelation functions (ACFs) were computed for both the line and continuum data. The line ACF yields an average characteristic timescale of about 40 minutes, whereas the continuum ACF indicates a shorter timescale of roughly 20 minutes. The difference suggests that the Hα line, which forms over a more extended region of the accretion disc, retains flickering signatures for a longer duration than the continuum, which originates closer to the disc’s inner edge.
Cross‑correlation analysis between the line and continuum reveals a pronounced peak near zero lag, demonstrating that fluctuations in the emission line and the continuum are essentially simultaneous. A separate cross‑correlation between the photometric (broad‑band) light curves and the spectroscopic series shows a high overall correlation, with occasional slight leads or lags of a few minutes. This pattern implies that the underlying physical driver of flickering—presumably rapid changes in the mass‑transfer rate or localized heating events within the disc—affects both the line‑forming region and the continuum source almost concurrently, with minor propagation delays.
The authors also compare the flickering timescales derived from the spectroscopic data with those obtained from pure photometric monitoring. The photometric series exhibit two distinct timescales: 25 minutes for two of the light curves and 10 minutes for the third. These shorter intervals are consistent with the higher‑frequency components seen in the power spectra and likely correspond to individual flare‑like events superimposed on the longer, disc‑wide variations captured by the line ACF.
Overall, the study supports a picture in which V3885 Sgr’s flickering is driven by stochastic, localized instabilities in the accretion disc—such as magnetorotational turbulence or thermal‑viscous fluctuations—that generate rapid energy releases. These releases manifest simultaneously in the Hα line and the continuum, but the line retains the signature for a longer period due to its formation over a broader disc region.
The paper acknowledges limitations, notably the relatively short observing windows (a few hours per night), which restrict the ability to probe very low‑frequency behavior or to identify any quasi‑periodic oscillations that might emerge over longer baselines. Additionally, the analysis is confined to a single spectral line; extending the study to other emission features (e.g., He II, higher Balmer lines) and to other wavelength regimes (UV, X‑ray) would test the universality of the derived stochastic model.
Future work should aim for extended, multi‑night campaigns with simultaneous multi‑wavelength coverage, enabling a more detailed mapping of flickering across the disc’s vertical and radial structure. Coupling such observations with magnetohydrodynamic simulations of disc turbulence could quantitatively link the observed power‑law indices and timescales to specific physical processes, thereby deepening our understanding of mass‑accretion dynamics in cataclysmic variables.
Comments & Academic Discussion
Loading comments...
Leave a Comment