North Ecliptic Pole Wide Field Survey of AKARI: Survey Strategy and Data Characteristics
We present the survey strategy and the data characteristics of the North Ecliptic Pole (NEP) Wide Survey of AKARI. The survey was carried out for about one year starting from May 2006 with 9 passbands from 2.5 to 24 micron and the areal coverage of about 5.8 sq. degrees centered on NEP. The survey depth reaches to 21.8 AB magnitude near infrared (NIR) bands, and ~ 18.6 AB maggnitude at the mid infrared (MIR) bands such as 15 and 18 micron. The total number of sources detected in this survey is about 104,000, with more sources in NIR than in the MIR. We have cross matched infrared sources with optically identified sources in CFHT imaging survey which covered about 2 sq. degrees within NEP-Wide survey region in order to characterize the nature of infrared sources. The majority of the mid infrared sources at 15 and 18 micron band are found to be star forming disk galaxies, with smaller fraction of early type galaxies and AGNs. We found that a large fraction (60~80 %) of bright sources in 9 and 11 micron stars while stellar fraction decreases toward fainter sources. We present the histograms of the sources at mid infrared bands at 9, 11, 15 and 18 micron. The number of sources per magnitude thus varies as m^0.6 for longer wavelength sources while shorter wavelength sources show steeper variation with m, where m is the AB magnitude.
💡 Research Summary
The paper presents the design, execution, and data products of the North Ecliptic Pole Wide (NEP‑Wide) survey carried out with the AKARI infrared satellite. Observations were performed over roughly one year beginning in May 2006, covering an area of about 5.8 square degrees centered on the NEP with nine IRC filters spanning 2.5 µm to 24 µm (N2, N3, N4, S7, S9W, S11, L15, L18W, L24). The survey achieved depths of AB 21.8 mag in the near‑infrared (NIR) bands and AB 18.6 mag in the mid‑infrared (MIR) bands, comparable to the sensitivity of Spitzer/IRAC in the same wavelength range.
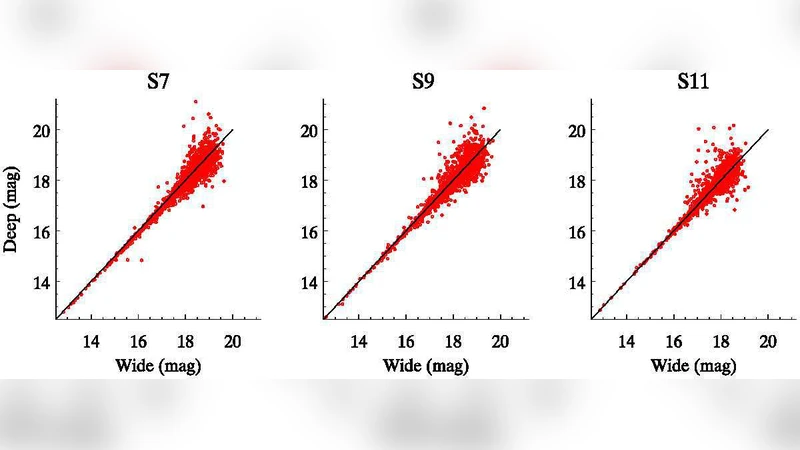
Data reduction followed the standard AKARI pipeline, including dark subtraction, flat‑fielding, non‑linearity correction, and astrometric calibration. Source extraction was performed with SExtractor at a signal‑to‑noise threshold of 5, yielding a catalog of approximately 104 000 infrared detections. The catalog is split roughly 60 % NIR and 40 % MIR sources, with positional accuracies of ~0.5″ and photometric uncertainties of 0.03–0.07 mag. About 70 % of the infrared sources have optical counterparts in the overlapping CFHT imaging (≈2 deg²), with a higher match rate for NIR detections (≈85 %) than for MIR detections (≈55 %).
Cross‑matching enabled a color‑color classification using combinations such as S9W–L15 versus optical g′–r′. The analysis shows a clear wavelength dependence in source populations. In the 9 µm and 11 µm bands, bright objects (AB < 15) are dominated (60–80 %) by stars, reflecting the strong stellar photospheric contribution at these wavelengths. Conversely, at 15 µm and 18 µm the majority (≈70 %) of sources are star‑forming disk galaxies, identified by prominent PAH emission, while early‑type galaxies and active galactic nuclei (AGN) together account for roughly 10–15 % of the MIR sample.
The authors examined the source‑count versus magnitude relation, fitting N(m) ∝ m^α. For the longer‑wavelength MIR bands (L15, L18W) the slope α≈0.6, indicating a relatively gentle increase in source density with fainter magnitudes. In contrast, the shorter‑wavelength NIR and S9W/S11 bands exhibit steeper slopes (α≈0.8–1.0), consistent with a rapid rise in stellar and nearby galaxy detections as the survey reaches its photometric limit. This differential behavior provides empirical constraints on galaxy evolution models, particularly on the contribution of PAH‑rich star‑forming galaxies to the cosmic infrared background.
The paper also discusses data quality: the point‑spread function (PSF) full‑width at half‑maximum is ~2.5″ across all bands, and the background noise is well characterized, allowing reliable detection of faint sources. The catalog includes flags for artifacts, saturation, and edge effects, ensuring that subsequent scientific analyses can filter out compromised measurements.
Scientifically, the NEP‑Wide survey fills a niche between deep, narrow‑field infrared surveys (e.g., AKARI NEP‑Deep) and all‑sky missions (e.g., WISE). Its combination of relatively wide area and moderate depth enables robust statistical studies of infrared source populations, the luminosity function of star‑forming galaxies at 15–18 µm, and the stellar content of the Milky Way foreground. The authors suggest that the catalog will be valuable for cross‑validation with upcoming facilities such as JWST, Euclid, and SPICA, especially for training machine‑learning classifiers that combine optical and infrared colors to separate stars, normal galaxies, and AGN.
In summary, the NEP‑Wide survey provides a high‑quality, multi‑band infrared dataset covering 5.8 deg² with well‑characterized photometry and astrometry. The paper documents the survey strategy, data processing, source catalog construction, and initial scientific results, establishing a solid foundation for future investigations of galaxy evolution, star formation, and the infrared sky at intermediate depths.
Comments & Academic Discussion
Loading comments...
Leave a Comment