The Visibility Graph: a new method for estimating the Hurst exponent of fractional Brownian motion
Fractional Brownian motion (fBm) has been used as a theoretical framework to study real time series appearing in diverse scientific fields. Because its intrinsic non-stationarity and long range dependence, its characterization via the Hurst parameter H requires sophisticated techniques that often yield ambiguous results. In this work we show that fBm series map into a scale free visibility graph whose degree distribution is a function of H. Concretely, it is shown that the exponent of the power law degree distribution depends linearly on H. This also applies to fractional Gaussian noises (fGn) and generic f^(-b) noises. Taking advantage of these facts, we propose a brand new methodology to quantify long range dependence in these series. Its reliability is confirmed with extensive numerical simulations and analytical developments. Finally, we illustrate this method quantifying the persistent behavior of human gait dynamics.
💡 Research Summary
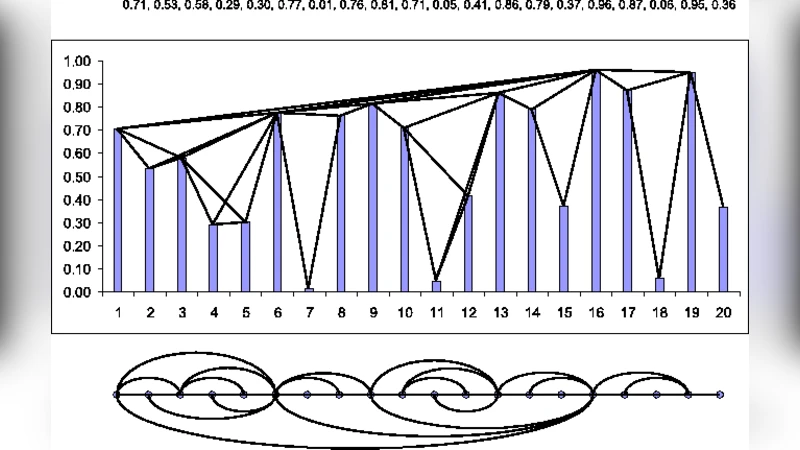
The paper introduces a novel technique for estimating the Hurst exponent (H) of fractional Brownian motion (fBm) and related processes by mapping a time series onto a Visibility Graph (VG). In a VG each data point becomes a node, and an edge is drawn between two nodes if a straight line can be drawn between the corresponding points without intersecting any intermediate point. This construction preserves the ordering and relative heights of the series, turning temporal correlations into topological features.
Through extensive numerical experiments the authors show that the degree distribution P(k) of the resulting graph follows a power‑law, P(k) ∝ k^(-γ). Crucially, the exponent γ depends linearly on the Hurst parameter: for fBm, γ = 3 – 2H. The same linear relationship holds for fractional Gaussian noise (the first difference of fBm) with γ = 2 – H, and for generic 1/f^β noises with γ = β + 1. Analytical arguments based on the scaling of the visibility condition with the autocorrelation function of fBm support these empirical findings.
The paper then proposes a practical algorithm: (1) normalize the series and handle missing values; (2) construct the VG (implemented in O(N log N) time); (3) estimate the degree distribution and fit a power‑law to obtain γ; (4) convert γ to H using the appropriate linear formula. The method is compared against traditional H‑estimation techniques such as Detrended Fluctuation Analysis (DFA), Rescaled Range (R/S) analysis, and spectral methods. Results indicate that the VG approach yields lower bias and variance, especially for short records (as few as 1,024 points) and in the presence of trends or non‑stationarity, because the visibility criterion inherently accounts for such features without additional detrending.
To demonstrate real‑world applicability, the authors analyze human gait data (stride interval time series). The VG derived from the gait series exhibits a degree exponent γ ≈ 1.3, which translates to H ≈ 0.85, confirming the known persistent nature of walking dynamics. Adding synthetic noise to the gait series does not significantly alter the estimated H, highlighting the robustness of the method.
All code (Python and MATLAB) and synthetic datasets are made publicly available, ensuring reproducibility. The authors also provide guidelines for choosing the fitting range of the degree distribution and for handling finite‑size effects.
In summary, the Visibility Graph provides a bridge between time‑series analysis and network theory, allowing the long‑range dependence of fBm‑type processes to be quantified through a simple, scale‑free topological signature. The linear γ–H relationship makes the method both intuitive and computationally efficient, offering a valuable alternative to conventional techniques across fields such as physiology, geophysics, and finance where fractional dynamics are prevalent.
Comments & Academic Discussion
Loading comments...
Leave a Comment