Rotation-invariant convolutional neural networks for galaxy morphology prediction
Measuring the morphological parameters of galaxies is a key requirement for studying their formation and evolution. Surveys such as the Sloan Digital Sky Survey (SDSS) have resulted in the availability of very large collections of images, which have …
Authors: S, er Dieleman, Kyle W. Willett
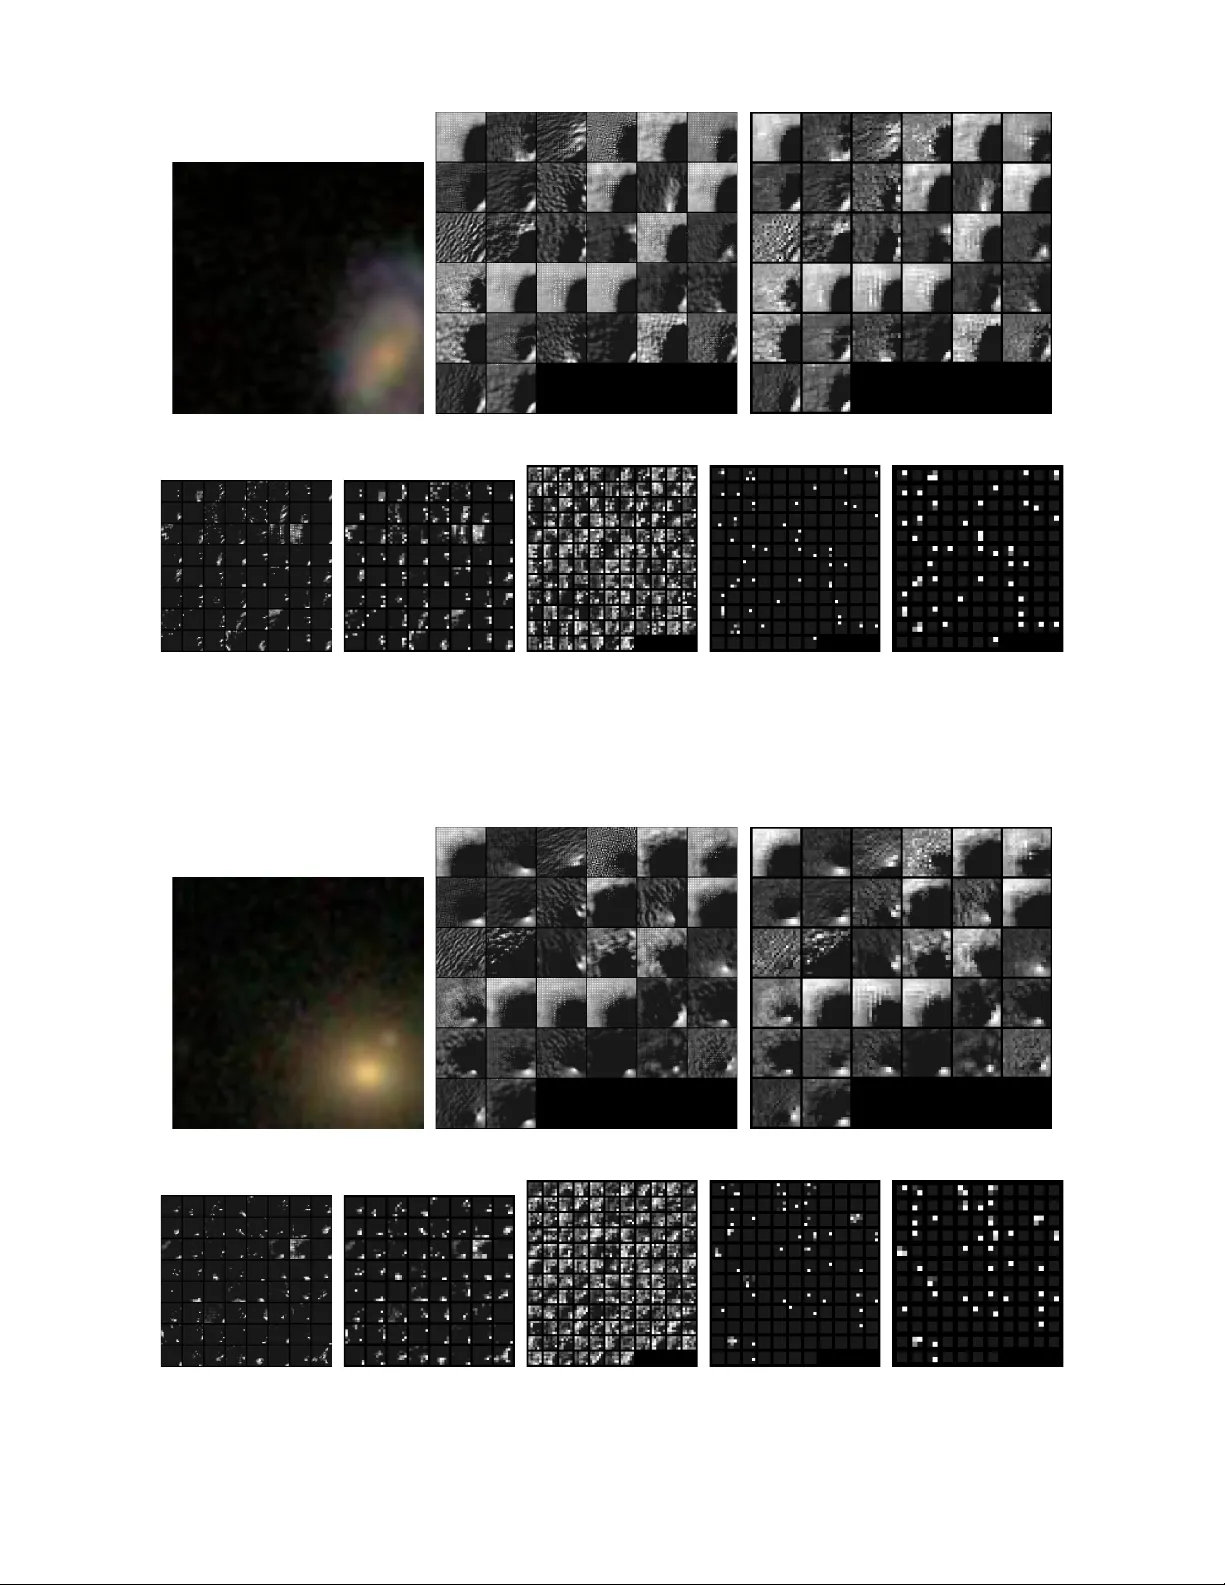
Mon. Not. R. Astron. Soc. 000 , 1–20 (2014) Printed 25 March 2015 (MN L A T E X style file v2.2) Rotation-in v arian t con v olutional neural net w orks for galaxy morphology prediction Sander Dieleman 1 ? , Kyle W. Willett 2 ? and Joni Dam bre 1 1 Ele ctr onics and Information Systems dep artment, Ghent University, Sint-Pietersnieuwstraat 41, 9000 Ghent, Belgium 2 Scho ol of Physics and Astronomy, University of Minnesota, 116 Chur ch St SE, Minne ap olis, MN 55455, USA Accepted 20 March 2015 ABSTRA CT Measuring the morphological parameters of galaxies is a k ey requirement for studying their formation and ev olution. Surv eys suc h as the Sloan Digital Sky Surv ey (SDSS) ha v e resulted in the a v ailabilit y of very large collections of images, whic h hav e p er- mitted p opulation-wide analyses of galaxy morphology . Morphological analysis has traditionally b een carried out mostly via visual inspection b y trained exp erts, which is time-consuming and do es not scale to large ( & 10 4 ) num b ers of images. Although attempts hav e b een made to build automated classification systems, these ha ve not been able to ac hieve the desired level of accuracy . The Galaxy Zo o pro ject successfully applied a cro wdsourcing strategy , inviting online users to classify images b y answ ering a series of questions. Unfortunately , ev en this approac h do es not scale well enough to k eep up with the increasing a v ailability of galaxy images. W e presen t a deep neural netw ork mo del for galaxy morphology classification whic h exploits translational and rotational symmetry . It was developed in the context of the Galaxy Chal lenge , an in ternational competition to build the b est mo del for morphology classification based on annotated images from the Galaxy Zo o pro ject. F or images with high agreemen t among the Galaxy Zoo participan ts, our mo del is able to repro duce their consensus with near-p erfect accuracy ( > 99%) for most questions. Confident model predictions are highly accurate, whic h makes the mo del suitable for filtering large collections of images and forw arding challenging images to exp erts for manual annotation. This approac h greatly reduces the experts’ w orkload without affecting accuracy . The application of these algorithms to larger sets of training data will b e critical for analysing results from future surv eys such as the LSST. Key w ords: metho ds: data analysis – catalogues – tec hniques: image pro cessing – galaxies: general. 1 INTR ODUCTION Galaxies exhibit a wide v ariety of shap es, colours and sizes. These prop erties are indicative of their age, formation con- ditions, and in teractions with other galaxies o ver the course of many Gyr. Studies of galaxy formation and evolution use morphology to probe the ph ysical processes that giv e rise to them. In particular, large, all-sky surv eys of galax- ies are critical for disentangling the complicated relation- ships b et ween parameters such as halo mass, metallicity , en- vironmen t, age, and morphology; deep er surveys prob e the c hanges in morphology starting at high redshifts and taking place o ver timescales of billions of years. Suc h studies require b oth the observ ation of large num- ? E-mail: sander.dieleman@ugent.be (SD), wil- lett@physics.umn.edu (KWW) b ers of galaxies and accurate classification of their morpholo- gies. Large-scale surv eys such as the Sloan Digital Sky Sur- v ey (SDSS) 1 ha ve resulted in the a v ailability of image data for millions of celestial ob jects. Ho wev er, manually insp ect- ing all these images to annotate them with morphological information is impractical for either individual astronomers or small teams. A ttempts to build automated classification systems for galaxy morphologies ha ve historically had difficulties in reac hing the lev els of reliability required for scien tific anal- ysis (Clery 2011). The Galaxy Zoo pro ject 2 w as conceived to accelerate this task through the metho d of crowdsourc- ing. The original goal of the pro ject was to obtain reliable 1 http://www.sdss.org/ 2 http://www.galaxyzoo.org/ c 2014 RAS 2 Dieleman, Wil lett & Dambr e morphological classifications for ∼ 900 , 000 galaxies by al- lo wing members of the public to contribute classifications via a web platform. The pro ject w as m uc h more successful than anticipated, with the en tire catalog b eing annotated within a timespan of several months (originally pro jected to tak e years). Since its original inception, several iterations of the pro ject with differen t sets of images and more detailed classification taxonomies hav e follo wed. Tw o recent sets of developmen ts since the launch of Galaxy Zoo hav e made an automated approac h more fea- sible: first, the large strides in the fields of image classifica- tion and computer vision in general, primarily through the use of de ep neur al networks (Krizhevsky et al. 2012; Raza- vian et al. 2014). Although neural netw orks hav e existed for several decades (McCullo c h & Pitts 1943; F ukushima 1980), they ha ve recently returned to the forefron t of ma- c hine learning research. A significant increase in av ailable computing pow er, along with new tec hniques such as rec- tified linear units (Nair & Hin ton 2010) and drop out regu- larization (Hin ton et al. 2012; Sriv astav a et al. 2014), ha ve made it p ossible to build more pow erful neural netw ork mod- els (see Section 5.1 for descriptions of these tec hniques). Secondly , large sets of reliably annotated images of galaxies are now av ailable as a consequence of the success of Galaxy Zoo. Such data can b e used to train mac hine learn- ing mo dels and increase the accuracy of their morphological classifications. Deep neural net works in particular tend to scale very well as the n umber of a v ailable training examples increases. Nev ertheless it is also possible to train deep neural net works on more modestly sized datasets using tec hniques suc h as regularization, data augmen tation, parameter shar- ing and model a veraging, which we discuss in Section 7.2 and follo wing. An automated approac h is also becoming indispensable: mo dern telescop es con tinue to collect more and more images ev ery da y . F uture telescop es will v astly increase the num- b er of galaxy images that can be morphologically classified, including multi-w av elength imaging, deep er fields, synoptic observing, and true all-sky cov erage. As a result, the crowd- sourcing approach cannot be exp ected to scale indefinitely with the gro wing amount of data. Supplementing both ex- p ert and cro wdsourced catalogues with automated classifi- cations is a logical and necessary next step. In this paper, w e prop ose a conv olutional neural netw ork mo del for galaxy morphology classification that is sp ecifi- cally tailored to the prop erties of images of galaxies. It effi- cien tly exploits both translational and rotational symmetry in the images, and autonomously learns sev eral levels of in- creasingly abstract representations of the images that are suitable for classification. The model was dev elop ed in the con text of the Galaxy Chal lenge 3 , an international comp eti- tion to build the best mo del for automatic galaxy morphol- ogy classification based on a set of annotated images from the Galaxy Zo o 2 pro ject. This mo del finished in first place out of 326 participan ts 4 . The model can efficiently and automat- ically annotate catalogs of images with morphology informa- 3 https://www.kaggle.com/c/galaxy- zoo- the- galaxy- challenge 4 The mo del w as indep enden tly developed by SD for the Kaggle competition. KWW co-designed and administered the c o mp eti- tion, but shared no data or code with any participants until after the closing date. tion, enabling quan titative studies of galaxy morphology on an unpreceden ted scale. The rest of this paper is structured as follows: we in- tro duce the Galaxy Zoo pro ject in Section 2 and Section 3 explains the set up of the Galaxy Challenge. W e discuss re- lated work in Section 4. Con volutional neural net works are describ ed in Section 5, and our method to incorporate rota- tion inv ariance in these mo dels is describ ed in Section 6. W e pro vide a complete ov erview of our mo delling approac h in Section 7 and report results in Section 8. W e analyse the mo del in Section 9. Finally , we draw conclusions in Sec- tion 10. 2 GALAXY ZOO Galaxy Zo o is an online crowdsourcing pro ject where users are asked to describe the morphology of galaxies based on colour images (Lintott et al. 2008, 2011). Our mo del and analysis uses data from the Galaxy Zo o 2 iteration of the pro ject, whic h uses colour images from the SDSS and a more detailed classification scheme than the original pro ject (Wil- lett et al. 2013). Participan ts are asked v arious questions suc h as ‘Ho w rounded is the galaxy?’ and ‘Do es it hav e a cen tral bulge?’, with the users’ answ ers determining which question will b e ask ed next. The questions form a decision tree (Figure 1) which is designed to encompass all p oin ts in the traditional Hubble tuning fork as w ell as a range of more irregular morphologies. The classification scheme has 11 questions and 37 answers in total (T able 1). Because of the structure of the decision tree, each indi- vidual participant answ ered only a subset of the questions for eac h classification. When man y participants hav e classi- fied the same image, their answers are aggregated into a set of weigh ted vote fractions for the en tire decision tree. These v ote fractions are used to estimate confidence levels for each answ er, and are indicative of the difficulty users exp erienced in classifying the image. More than half a million p eople hav e con tributed classifications to Galaxy Zoo, with eac h image indep enden tly classified by 40 to 50 people 5 . Data from the Galaxy Zoo pro jects ha ve already b een used in a wide v ariety of studies on galaxy structure, for- mation, and evolution (Skibba et al. 2009; Bamford et al. 2009; Scha winski et al. 2009; Lintott et al. 2009; Darg et al. 2010; Masters et al. 2010, 2011; Simmons et al. 2013; Melvin et al. 2014; Willett et al. 2015). Comparisons of Galaxy Zo o morphologies to smaller samples from b oth exp erts and au- tomated classifications show high levels of agreement, testi- fying to the accuracy of the crowdsourced annotations (Bam- ford et al. 2009; Willett et al. 2013). 3 THE GALAXY CHALLENGE Our model was dev elop ed in the context of the Galaxy Challenge, an online international comp etition organized by 5 Note that the v ote fractions are post-pro cessed to increase their reliability , for example b y weigh ting users based on their consis- tency with the ma jority , and b y compensating for classification bias induced by different image apparen t magnitudes and sizes (Willett et al. 2013). c 2014 RAS, MNRAS 000 , 1–20 Convnets for galaxy morpholo gy pr e diction 3 Figure 1. The Galaxy Zo o 2 decision tree. Reproduced from Figure 1 in Willett et al. (2013). Galaxy Zo o, sp onsored b y Winton Capital, and hosted on the Kaggle platform for data prediction con tests. It was held from Decem b er 20 th , 2013 to April 4 th , 2014. The goal of the comp etition was to build a mo del that could predict galaxy morphology from images lik e the ones that w ere used in the Galaxy Zoo 2 pro ject. Images of galaxies and morphological data for the com- p etition were taken from the Galaxy Zoo 2 main spectro- scopic sample. Galaxies w ere selected to cov er the full ob- serv ed range of morphology , colour, and size, since the goal w as to develop a general algorithm that could b e applied to many types of images in future surveys. The total num- b er of images provided is limited b oth by the imaging depth of SDSS and the elimination of b oth uncertain and ov er- represen ted morphological categories as a function of colour (primarily red elliptical and blue spiral galaxies). This help ed to ensure that colour is not used as a proxy for morphology , and that a high-p erforming model would be based purely on the images’ structural parameters. The final training set of data consisted of 61,578 JPEG colour images of galaxies, along with probabilities 6 for eac h of the 37 answers in the decision tree. An ev aluation set of 79,975 images was also provided, but with no morpholog- 6 These are actually post-pro cessed v ote fractions obtained from the Galaxy Zo o participants’ answ ers, but w e treat them as prob- abilities in this paper. ical data – the goal of the comp etition was to predict these v alues. Each image is 424 by 424 pixels in size. The morpho- logical data provided w as a mo dified version of the weigh ted v ote fractions in the GZ2 catalog; these were transformed in to “cum ulative” probabilities that ga ve higher weigh ts to more fundamen tal morphological categories higher in the de- cision tree. Images w ere anonymized from their SDSS IDs, with any use of metadata (such as colour, size, position, or redshift) to train the algorithm explicitly forbidden b y the comp etition guidelines. Because the goal w as to predict p robabilities for each an- sw er, as opposed to determining the most likely answ er for eac h question in the decision tree, the models built by par- ticipan ts w ere actually solving a re gr ession problem, and not a classification problem in the strictest sense. The predictive p erformance of a mo del w as determined b y computing the ro ot-mean-square error (RMSE) b et ween predictions on the ev aluation set and the corresp onding crowdsourced probabil- ities. Let p k b e the answer probabilities asso ciated with an image ( k = 1 . . . 37), and ˆ p k the corresp onding predictions. Then the RMSE e ( ˆ p k , p k ) can b e computed as follows: e ( ˆ p k , p k ) = v u u t 37 X k =1 ( ˆ p k − p k ) 2 . (1) This metric w as chosen b ecause it puts more emphasis on questions with higher answer probabilities, i.e. the topmost c 2014 RAS, MNRAS 000 , 1–20 4 Dieleman, Wil lett & Dambr e question answers next Q1 Is the galaxy simply smooth and rounded, with no sign of a disk? A1.1 smooth Q7 A1.2 features or disk Q2 A1.3 star or artifact end Q2 Could this b e a disk viewed edge-on? A2.1 yes Q9 A2.2 no Q3 Q3 Is there a sign of a bar feature through the centre of the galaxy? A3.1 yes Q4 A3.2 no Q4 Q4 Is there any sign of a spiral arm pattern? A4.1 yes Q10 A4.2 no Q5 Q5 How prominent is the central bulge, compared with the rest of the galaxy? A5.1 no bulge Q6 A5.2 just noticeable Q6 A5.3 obvious Q6 A5.4 dominant Q6 Q6 Is there anything o dd? A6.1 yes Q8 A6.2 no end Q7 How rounded is it? A7.1 completely round Q6 A7.2 in b et ween Q6 A7.3 cigar-shaped Q6 Q8 Is the o dd feature a ring, or is the galaxy disturb ed or irregular? A8.1 ring end A8.2 lens or arc end A8.3 disturbed end A8.4 irregular end A8.5 other end A8.6 merger end A8.7 dust lane end Q9 Does the galaxy have a bulge at its centre? If so, what shap e? A9.1 rounded Q6 A9.2 boxy Q6 A9.3 no bulge Q6 Q10 How tightly wound do the spiral arms app ear? A10.1 tigh t Q11 A10.2 medium Q11 A10.3 loose Q11 Q11 Ho w many spiral arms are there? A11.1 1 Q5 A11.2 2 Q5 A11.3 3 Q5 A11.4 4 Q5 A11.5 more than four Q5 A11.6 can’t tell Q5 T able 1. All questions that can be asked ab out an image, with the corresponding answ ers that participants can choose from. Ques- tion 1 is the only one that is asked of every image. The final column indicates the next question to be asked when a particular answer is giv en. Repro duced from T able 2 in Willett et al. (2013). questions in the decision tree, whic h corresp ond to broader morphological categories. The provided answer probabilities are deriv ed from cro wdsourced classifications, so they are somewhat noisy and biased in certain wa ys. As a result, the predictive mo dels that w ere built exhibited some of the same biases. In other words, they are mo dels of ho w the cr owd would classify images of galaxies, whic h ma y not necessarily correspond to the “true” morphology . An example of such a discrepancy is discussed in Section 9. The mo dels built by participan ts were ev aluated as follo ws. The Kaggle platform automatically computed t w o scores based on a set of mo del predictions: a public score, computed on about 25% of the ev aluation data, and a priv ate score, computed on the other 75%. Public scores were im- mediately rev ealed during the course of the comp etition, but priv ate scores were not rev ealed un til after the comp etition had finished. The priv ate score was used to determine the final ranking. Because the participan ts did not kno w which ev aluation images b elonged to whic h set, they could not di- rectly optimize the priv ate score, but w ere instead encour- aged to build a predictiv e mo del that generalizes w ell to new images. 4 RELA TED W ORK Mac hine learning tec hniques, and artificial neural netw orks in particular, hav e been a p opular to ol in astronom y researc h for more than tw o decades. Neural net works were initially applied for star-galaxy discrimination (Odewahn et al. 1992; Bertin 1994) and classification of galaxy sp ectra (F olkes et al. 1996). More recen tly they hav e also b een used for photomet- ric redshift estimation (Firth et al. 2003; Collister & Lahav 2004). Galaxy morphology classification is one of the most widespread applications of neural netw orks in astronomy . Most work in this domain pro ceeds by prepro cessing the photometric data and then extracting a limited set of hand- crafted features that are kno wn to b e discriminativ e, such as ellipticit y , concen tration, surface brigh tness, and radii and log-lik eliho od v alues measured from v arious t yp es of radial profiles (Storrie-Lom bardi et al. 1992; Lahav et al. 1995; Naim et al. 1995; Laha v et al. 1996; Ball et al. 2004; Banerji et al. 2010). Support v ector mac hines (SVMs) ha ve also been applied in this fashion (Huertas-Company et al. 2010). Earlier work in this domain typically relied on muc h smaller datasets and used net works with very few trainable parameters (betw een 10 1 and 10 3 ). Modern netw ork archi- tectures are capable of handling at least ∼ 10 7 parameters, allo wing for more precise fits and a larger morphological classification space. More recen t work has profited from the a v ailability of larger training sets using data from surv eys suc h as the SDSS (Banerji et al. 2010; Huertas-Company et al. 2010). Another recent trend is the use of general purpose im- age features, instead of features that are sp ecific to galaxies: the WND-CHARM feature set (Orlo v et al. 2008), originally designed for biological image analysis, has b een applied to galaxy morphology classification in combination with near- est neighbour classifiers (Shamir 2009; Shamir et al. 2013; Kuminski et al. 2014). Other approaches to this problem attempt to forgo any form of handcrafted feature extraction by applying principal comp onen t analysis (PCA) to preprocessed images in com- bination with a neural net work (De La Calleja & F uentes 2004), or b y applying k ernel SVMs directly to ra w pixel data (P olsterer et al. 2012). Our approac h differs from prior work in t wo main areas: • Most prior work uses handcrafted features (e.g., WND- CHARM) that required exp ert knowledge and many hours of engineering to develop. W e w ork directly with raw pixel data and our use of conv olutional neural netw orks allo ws for a set of task-sp ecific features to be learned from the data. The net works learn hierarchies of features, whic h allow them to detect complex patterns in the images. Handcrafted features mostly rely on image statistics and very local pattern detec- tors, making it harder to recognize complex patterns. F ur- thermore, it is usually necessary to p erform feature selection b ecause the handcrafted represen tations are highly redun- dan t and man y features are irrelev ant for the task at hand. Although many other participan ts in the Galaxy Challenge c 2014 RAS, MNRAS 000 , 1–20 Convnets for galaxy morpholo gy pr e diction 5 used conv olutional neural netw orks, there is little discussion of this approach in the astronomical literature. • Apart from the recen t w ork of Kuminski et al. (2014), whose algorithms are also trained on Galaxy Zo o data, most researc h has fo cused on classifying galaxies into a limited n umber of classes (t ypically betw een 2 and 5), or predict- ing scalar v alues that are indicative of galaxy morphology (e.g., Hubble T-types). Since the classifications made b y Galaxy Zo o users are m uch more fine-grained, the task the net works must solve is more c hallenging. Since many out- standing astrophysical questions require more detailed mor- phological data (suc h as the n umber and arrangemen ts of clumps into proto-galaxies, the relation b et ween bar strength and central star formation, link b et ween merging activity and active black holes, etc.), developmen t of mo dels that can handle these more difficult tasks is crucial. Our method for classifying galaxy morphology exploits the rotational symmetry of galaxy images; how ever, there are other in v ariances and symmetries (b esides translational) that may b e exploited for conv olutional neural netw orks. Bruna et al. (2013) define conv olution operations ov er ar- bitrary graphs, generalizing from the typical grid of pixels to other lo cally connected structures. Sifre & Mallat (2013) extract represen tations that are inv arian t to affine transfor- mations, based on scattering transforms. How ever, these rep- resen tations are fixed (i.e., not learned from data), and not sp ecifically tuned for the task at hand, unlike the represen- tations learned by conv olutional neural netw orks. Mairal et al. (2014) prop ose to train con volutional neu- ral netw orks to appro ximate k ernel feature maps, allo wing for the desired inv ariance prop erties to b e encoded in the c hoice of kernel, and subsequently learned. Gens & Domingos (2014) prop ose deep symmetry netw orks, a generalization of con volutional neural net works with the ability to form fea- ture maps o ver any symmetry group, rather than just the translation group. Our approach f o r exploiting rotational symmetry in the input images, describ ed in Section 6, is quite similar in spirit to this work. The ma jor adv antage to our implementation is a demonstrably effectiv e result at a reasonable computational cost. 5 BA CKGR OUND 5.1 Deep learning The idea of de ep le arning is to build models that represen t data at m ultiple levels of abstraction, and can disco ver accu- rate represen tations autonomously from the data itself (Ben- gio 2007). Deep learning models consist of sev eral la yers of pro cessing that form a hierarch y: each subsequen t lay er ex- tracts a progressively more abstract representation of the input data and builds up on the representation from the pre- vious lay er, typically b y computing a non-linear transforma- tion of its input. The parameters of these transformations are optimized by tr aining the mo del on a dataset. A fee d-forwar d neur al network is an example of such a mo del, where each lay er consists of a num b er of units (or neurons) that compute a weigh ted linear combination of the la yer input, follo wed by an elemen twise non-linearity . These weigh ts constitute the mo del parameters. Let the v ec- tor x n − 1 b e the input to la yer n , W n b e a matrix of w eights, output lay er N (output) x N = f ( W N x N − 1 + b N ) lay er N − 1 (hidden) x N − 1 = f ( W N − 1 x N − 2 + b N − 1 ) lay er 1 (hidden) x 1 = f ( W 1 x 0 + b 1 ) input · · · x N x N − 1 x N − 2 x 1 x 0 Figure 2. Schematic represen tation of a feed-forward neural net- work with N lay ers. and b n b e a vector of biases. Then the output of lay er n can b e represen ted as the v ector x n = f ( W n x n − 1 + b n ) , (2) where f is the activation function , an elemen twise non-linear function. Common c hoices for the activ ation function are lin- ear rectification [ f ( x ) = max( x, 0)], which gives rise to r ecti- fie d line ar units (ReLUs; Nair & Hinton 2010), or a sigmoidal function [ f ( x ) = (1 + e − x ) − 1 or f ( x ) = tanh( x )]. Another p ossibilit y is to compute the maximum across sev eral linear com binations of the input, whic h gives rise to maxout units (Go odfellow et al. 2013). W e will consider a netw ork with N lay ers. The net work input is represented by x 0 , and its output b y x N . A sc hematic represen tation of a feed-forw ard neural net- w ork is sho wn in Figure 2. The net work computes a function of the input x 0 . The output x N of this function is a predic- tion of one or more quan tities of in terest. W e will use t to represen t the desired output (target) corresp onding to the net work input x 0 . The topmost la yer of the net work is re- ferred to as the output layer . All the other lay ers b elo w it are hidden layers . During training, the parameters of all la yers of the net- w ork are jointly optimized to make the output x N appro xi- mate the desired output t as closely as possible. W e quantify the prediction error using an error measure e ( x N , t ). As a result, the hidden lay ers will learn to pro duce represen ta- tions of the input data that are useful for the task at hand, and the output lay er will learn to predict the desired output from these representations. T o determine how the parameters should b e changed to reduce the prediction error across the dataset, we use gr adient desc ent : the gradien t of e ( x N , t ) is computed with resp ect to the model parameters W n , b n for n = 1 . . . N . The parameter v alues of each lay er are then mo dified by c 2014 RAS, MNRAS 000 , 1–20 6 Dieleman, Wil lett & Dambr e rep eatedly taking small steps in the direction opp osite to the gradient: W n ← W n − η ∂ e ( x N , t ) ∂ W n , (3) b n ← b n − η ∂ e ( x N , t ) ∂ b n . (4) Here, η is the le arning r ate , a hyperparameter con trolling the step size. T raditionally , mo dels with many non-linear lay ers of pro cessing hav e not b een commonly used b ecause they were difficult to train: gradient information would v anish as it propagated through the la yers, making it difficult to learn the parameters of lo wer la yers (Hochreiter et al. 2001). Prac- tical applications of neural net works were limited to models with one or tw o hidden la yers. Since 2006, the inv ention of sev eral new techniques, along with a significant increase in a v ailable computing pow er, ha ve made this task muc h more feasible. Initially unsup ervise d pr e-tr aining w as prop osed as a metho d to facilitate training deeper net works (Hinton et al. 2006). Single-la yer unsup ervised models (suc h as restricted Boltzmann machines or auto-enco ders (Bengio 2007)) are stac ked on top of eac h other and trained, and the learned parameters of these mo dels are then used to initialize the parameters of a deep neural net work. These are then fine- tuned using standard gradient descent. This initialization sc heme makes it p ossible to largely av oid the v anishing gra- dien t problem. Nair & Hin ton (2010) and Glorot et al. (2011) prop osed the use of rectified linear units (ReLUs) in deep neural netw orks. By replacing traditional activ ation func- tions with linear rectification, the v anishing gradient prob- lem was significan tly reduced. This also makes pre-training unnecessary in most cases. The introduction of drop out regularization (Hinton et al. 2012; Sriv asta v a et al. 2014) has made it possible to train larger net works with man y more parameters. Dropout is a regularization method that can be applied to a la yer n by randomly removing the output v alues of the previous lay er n − 1 (setting them to zero) with probability p . Typically p is chosen to b e 0 . 5. The remaining v alues are rescaled by a factor of (1 − p ) − 1 to preserve the scale of the total in- put to each unit in lay er n . F or eac h training example that is presented to the netw ork, a different subset of v alues is remo ved. During ev aluation, no v alues are remov ed and no rescaling is p erformed. Drop out is an effectiv e regularizer b ecause it preven ts c o adaptation b et ween units: eac h unit is forced to learn to b e useful by itself, b ecause its utility cannot depend on the presence of other units in the same lay er (as they can b e remo ved at random). 5.2 Con volutional neural net w orks Con volutional neural netw orks or c onvnets (F ukushima 1980; LeCun et al. 1998) are a sub class of neural netw orks with constrained connectivit y patterns b et ween some of the la yers. They can b e used when the input data exhibits some kind of top ological structure, lik e the ordering of image pix- els in a grid, or the temp oral structure of an audio signal. Con volutional neural net works con tain tw o types of lay- ers with restricted connectivity: c onvolutional layers and p o oling layers . A con volutional lay er tak es a stack of fe atur e maps (e.g. the colour c hannels of an image) as input and con- v olves each of these with a set of learnable filters to produce a stac k of output feature maps. This is efficien tly implemented b y replacing the matrix-vector pro duct W n x n − 1 in Equa- tion 2 with a sum of conv olutions. W e represent the input of la yer n as a set of K matrices X ( k ) n − 1 , with k = 1 . . . K . Eac h of these matrices represen ts a differen t input feature map. The output feature maps X ( l ) n , l = 1 . . . L are represented as follo ws: X ( l ) n = f K X k =1 W ( k,l ) n ∗ X ( k ) n − 1 + b ( l ) n ! . (5) Here, ∗ represen ts the t wo-dimensional con volution op era- tion, the matrices W ( k,l ) n represen t the filters of lay er n , and b ( l ) n represen ts the bias for feature map l . Note that a feature map X ( l ) n is obtained by computing a sum of K conv olutions with the feature maps of the previous la yer. The bias b ( l ) n can optionally b e replaced by a matrix B ( l ) n , so that each spatial p osition in the feature map has its own bias (‘un tied’ bi- ases). This allo ws the sensitivity of the filters to v ary across the input. By replacing the matrix product with a sum of conv o- lutions, the connectivit y of the la yer is effectively restricted to take adv antage of the input structure and to reduce the n umber of parameters. Each unit is only connected to a lo- cal subset of the units in the lay er below, and each unit is replicated across the entire input. This is shown in the left side of Figure 3. This means that each unit can b e seen as detecting a particular feature across the input (for example, an oriented edge in an image). Applying feature detectors across the entire input enables the exploitation of transla- tional symmetry in images. As a consequence of this restricted connectivit y pattern, con volutional lay ers t ypically ha ve far few er parameters than traditional dense (or ful ly-c onne cte d ) la yers that compute a transformation of their input according to Equation 2. This reduction in parameters can drastically impro ve generaliza- tion p erformance (i.e., predictive performance on unseen ex- amples) and make the mo del scale to larger input dimen- sionalities. Because con volutional la yers are only able to mo del lo- cal correlations in the input, the dimensionality of the fea- ture maps is often reduced betw een conv olutional lay ers by inserting p ooling la yers. This allo ws higher la y ers to model correlations across a larger part of the input, albeit with a lo wer resolution. A po oling la yer reduces the dimensionalit y of a feature map by computing some aggregation function (t ypically the maxim um or the mean) across small lo cal re- gions of the input (Boureau et al. 2010), as sho wn in the righ t side of Figure 3. This also mak es the mo del in v ariant to small translations of the input, which is a desirable prop- ert y for mo delling images and many other types of data. Unlik e con volutional la yers, p ooling lay ers typically do not ha ve any trainable parameters. By alternating conv olutional and p ooling la yers, higher la yers in the net work see a progressiv ely more coarse rep- resen tation of the input. As a result, these lay ers are able c 2014 RAS, MNRAS 000 , 1–20 Convnets for galaxy morpholo gy pr e diction 7 la y er n − 1 la y er n la y er n + 1 input conv olutions po oling X ( k ) n − 1 X ( l ) n X ( l ) n +1 W ( k,l ) n Figure 3. A schematic ov erview of a conv olutional lay er follow ed by a po oling lay er: each unit in the conv olutional lay er is connected to a local neigh b orhoo d in all feature maps of the previous lay er. The p ooling la yer aggregates groups of neighboring units from the la yer below. to model higher-level abstractions more easily b ecause each unit is able to see a larger part of the input. Con volutional neural netw orks constitute the state of the art in man y computer vision problems. Since their ef- fectiv eness for large-scale image classification was demon- strated, they ha ve been ubiquitous in computer vision re- searc h (Krizhevsky et al. 2012; Razavian et al. 2014; Szegedy et al. 2014; Simon yan & Zisserman 2014). 6 EXPLOITING R OT A TIONAL SYMMETR Y The restricted connectivit y patterns used in conv olutional neural net works drastically reduce the n umber of parameters required to model large images, by exploiting translational symmetry . How ever, there are man y other types of symme- tries that o ccur in images. F or images of galaxies, rotating an image should not affect its morphological classification. This rotational symmetry is exploited b y applying the same set of feature detectors to v arious rotated versions of the in- put. This further increases parameter sharing, whic h has a p ositiv e effect on generalization p erformance. Whereas conv olutions pro vide an efficient wa y to exploit translational symmetry , applying the same filter to multiple rotated versions of the input requires explicitly instan tiating these versions. Additionally , rotating an image b y an angle that is not a multiple of 90 ◦ requires in terp olation and re- sults in an image whose edges are not aligned with the rows and columns of the pixel grid. These complications make exploiting rotational symmetry more challenging. W e note that the original Galaxy Zo o pro ject exp eri- men ted with crowdsourced classifications of galaxies in which the images were b oth vertically and diagonally mirrored. Land et al. (2008) sho wed that the ra w v otes had an excess of 2.5% for S-wise (anticlockwise) spiral galaxies ov er Z-wise (clo c kwise) galaxies. Since this effect was seen in b oth the ra w and mirrored images, it w as interpreted as a bias due to preferences in the human brain, rather than as a true excess in the num b er of apparen t S-wise spirals in the Universe. The existence of such a directional bias in the brain was demonstrated by Gori et al. (2006). The Galaxy Zo o 2 prob- abilities do not contain an y structures related to handedness or rotation-v ariant quan tities, and no rotational or transla- tional biases hav e y et been discov ered in the data. If suc h biases do exist, ho wev er, this w ould presumably reduce the predictiv e pow er of the mo del since the assumption of rota- tional inv ariance to the output probabilities would no longer apply . Our approac h for exploiting symmetry is visualized in Figure 4. W e compute rotated and flipp ed v ersions of the input images, whic h are referred to as viewp oints , and pro- cess each of these separately with the same conv olutional net work arc hitecture, consisting of alternating conv olutional la yers and p ooling lay ers. The output feature maps of this net work for the different viewpoints are then concatenated, and one or more dense la yers are stack ed on top. This ar- rangemen t allows the dense lay ers to aggregate high-level features extracted from differen t viewpoints. In practice, we also crop the top left part of each view- p oin t image both to reduce redundancy betw een the view- p oin ts and to reduce the size of the input images (and hence computation time). Images are cropp ed in suc h a w ay that eac h one contains the centre of the galaxy , b ecause this part of the image tends to b e very informative. The practical implemen tation of viewp oin t extraction is discussed in Sec- tion 7.5, and the modified net work architecture is describ ed in Section 7.6. 7 APPR OA CH In this section, we describ e our practical approac h to devel- oping and training a model for galaxy morphology predic- tion. W e first discuss our exp erimen tal setup and the prob- lem of ov erfitting, which was the main driver b ehind our design decisions. W e then describ e the successive steps in our pro cessing pip eline to obtain a set of answer probabilities from an image. This pipeline consists of fiv e steps (Figure 5): input prepro cessing, augmentation, viewp oin t extraction, a con volutional neural net work and model av eraging. W e also briefly discuss the practical implemen tation of the pip eline from a softw are persp ectiv e. c 2014 RAS, MNRAS 000 , 1–20 8 Dieleman, Wil lett & Dambr e . . . . . . . . . 1. input 2. rotate 3. crop 4. convolutions 5. dense 6. predictions Figure 4. Sc hematic ov erview of a neural netw ork architecture for exploiting rotational symmetry . The input image (1) is first rotated to v arious angles and optionally flipp ed to yield different viewp oin ts (2), and the viewp oin ts are subsequently cropp ed to reduce redundancy (3). Each of the cropped viewp oin ts is pro cessed b y the same stack of con volutional lay ers and p ooling lay ers (4), and their output representations are concatenated and pro cessed by a stack of dense layers (5) to obtain predictions (6). input augmented input predictions preprocessing Section 7.3 viewpoint extraction Section 7.5 model averaging Section 7.8 preprocessed input viewpoints av eraged predictions augmentation Section 7.4 convnet Section 7.6 Figure 5. Schematic ov erview of the pro cessing pip eline. c 2014 RAS, MNRAS 000 , 1–20 Convnets for galaxy morpholo gy pr e diction 9 7.1 Exp erimen tal setup As describ ed in Section 3, the provided dataset consists of a training set with 61,578 ima ges with asso ciated answ er prob- abilities, and an ev aluation set of 79,975 images. F eedback could be obtained during the comp etition b y submitting pre- dictions for the images in the ev aluation set. During the com- p etition, submitted predictions were scored by computing the RMSE on a subset of appro ximately 25% of the ev alua- tion images. It w as not revealed whic h images were part of this subset. The scores used to determine the final ranking w ere obtained b y computing the RMSE on the remaining 75% of images. This arrangement is typical for comp etitions hosted on the Kaggle platform. W e split off a further 10% of the training set images for real-time ev aluation during mo del training, and trained our models only on the remaining 90%. 7.2 Av oiding o v erfitting Mo dern neural netw orks typically hav e a large num b er of learnable parameters – several million in the case of our mo del. This is in stark con trast with the limited size of the training set, whic h had only 5 × 10 4 images. As a result, there is a high risk of overfitting : a net work will tend to memorize the training examples b ecause it has enough capacity to do so, and will not generalize well to new data. W e used several strategies to av oid o verfitting: • data augmen tation : extending the training set b y randomly p erturbing images in a wa y that leav es their asso- ciated answer probabilities unchanged; • regularization : p enalizing model complexity through use of drop out (Hinton et al. 2012); • parameter sharing : reducing the num b er of mo del pa- rameters by exploiting translational and rotational symme- try in the input images; • mo del a veraging : av eraging the predictions of several mo dels. 7.3 Prepro cessing Images are first cropped and rescaled to reduce the dimen- sionalit y of the input. It was useful to crop the images b e- cause the ob ject of in terest is in the middle of the image with a large amoun t of sky bac kground, and t ypically fits within a square with a side of approximately half the image heigh t. W e then rescaled the images to sp eed up training, with little to no effect on predictiv e p erformance. Images were cropp ed from 424 × 424 pixels to 207 × 207, and then do wnscaled 3 times to 69 × 69 pixels. F or a small subset of the images, the cropping operation remo ved part of the ob ject of interest, either because it had an unusually large angular size or b ecause it was not p er- fectly cen tred. W e looked in to recentering and rescaling the images b y detecting and measuring the ob jects in the images using SExtr actor (Bertin & Arnouts 1996). This allo wed us to independently estimate b oth the position and P etrosian radii of the ob jects. This information is then used to cen tre and rescale all images to standardize the sizes of the ob jects b efore further processing. This normalization step had no significant effect on the predictiv e p erformance of our mo dels. Nev ertheless, w e did train a few models using this approac h, b ecause ev en though they ac hieved the same performance in terms of RMSE com- pared to mo dels trained without it, the mo dels make differ- en t mistak es. This is useful in the con text of mo del av eraging (Section 7.8), where high v ariance among a set of compara- bly performing models is desirable (Bishop 2006). The images for the comp etition w ere provided in the same format that is used on the Galaxy Zo o website (424 × 424 JPEG colour images). W e found that keeping the colour information (instead of con verting the images to grayscale) impro ved the predictiv e p erformance considerably , despite the fact that the colours are artificial and in tended for hu- man eyes. These artificial colours are nev ertheless correlated with morphology , and our mo dels are able to exploit this correlation. 7.4 Data augmen tation Due to the limited size of the training set, p erforming data augmen tation to artificially increase the n umber of training examples is instrumental. Each training example w as ran- domly p erturbed in five w ays, which are sho wn in Figure 6: • rotation : random rotation with an angle sampled uni- formly b et ween 0 ◦ and 360 ◦ , to exploit rotational symmetry in the images. • translation : random shift sampled uniformly betw een − 4 and 4 pixels (relative to the original image size of 424 b y 424) in the x and y direction. The size of the shift is limited to ensure that the ob ject of interest remains in the centre of the image. • scaling : random rescaling with a scale factor sampled log-uniformly betw een 1 . 3 − 1 and 1 . 3. • flipping : the image is flipp ed with a probabilit y of 0 . 5. • brightness adjustment : the colour of the image is adjusted as describ ed by Krizhevsky et al. (2012), with tw o differences: the first eigen vector has a m uch larger eigenv alue than the other tw o, so only this one is used, and the standard deviation for the scale factor is set to α = 0 . 5. In practice, this amoun ts to a brigh tness adjustmen t. The first four of these are affine transformations, whic h can b e collapsed into a single transformation together with the one used for preprocessing. This means that the data augmen tation step has no noticeable computational cost. T o maximize the effect of data augmen tation, we randomly per- turb ed the images on demand during training, so the mo dels w ere nev er presen ted with the exact same training example more than once. 7.5 Viewp oin t extraction After prepro cessing and augmentation, we extracted view- p oin ts by rotating, flipping and cropping the input images. W e extracted 16 different viewp oin ts for eac h image: first, t wo square-shap ed crops were extracted from an input im- age, one at 0 ◦ and one at 45 ◦ . Both were also flipp ed hor- izon tally to obtain 4 crops in total. Eac h of these crops is 69 × 69 pixels in size. Then, four ov erlapping corner patches of 45 × 45 pixels were extracted from each crop, and rotated c 2014 RAS, MNRAS 000 , 1–20 10 Dieleman, Wil lett & Dambr e (a) none (b) rotation (c) translation (d) scaling (e) flipping (f ) brightness Figure 6. The five types of random data augmen tation used in this mo del. Note that the effect of translation and brightness adjustment is fairly subtle. (a) 4 crops from an image (b) 4 viewpoints from each crop Figure 7. Obtaining 16 viewp oin ts from an input image. (a) First, tw o square-shaped crops are extracted from the image, one at 0 ◦ (red outline) and one a t 45 ◦ (blue outline). Both are also flipp ed horizontally to obtain 4 crops in total. (b) Then, four ov erlapping corner patches are extracted from each crop, and they are rotated so that the galaxy centre is in the b ottom right corner of each patch. These 16 rotated patc hes constitute the viewp oin ts. This figure is best viewed in colour. so that the centre of the galaxy is in the bottom righ t cor- ner of eac h patc h. These 16 rotated patches constitute the viewp oin ts (Figure 7). This approach allow ed us to obtain 16 different view- p oin ts with just tw o affine transformation op erations, th us a voiding additional computation. All viewpoints can b e ob- tained from the t wo original crops without in terp olation (whic h in practice are array indexing op erations). This also means that image edges and padding hav e no effect on the input, and that the loss of image fidelity after preprocessing, augmen tation and viewp oin t extraction is minimal. 7.6 Net work architecture All viewp oin ts were presented to the netw ork as 45 by 45 b y 3 arra ys of R GB v alues, scaled to the interv al [0 , 1], and pro cessed by the same conv olutional architecture. The re- sulting feature maps were then concatenated and pro cessed b y a stac k of three fully connected la yers to map them to the 37 answer probabilities. The arc hitecture for the best p erforming netw ork is vi- sualized in Figure 8. There are four con volutional lay ers, all with square filters, with filter sizes 6, 5, 3 and 3 resp ectiv ely , and with un tied biases (i.e. each spatial p osition in each fea- ture map has a separate bias, see Section 5.2). The rectifica- tion non-linearity is applied after eac h lay er (Nair & Hin ton 2010). 2 b y 2 max-p ooling follows the first, second and fourth con volutional lay ers. The concatenated feature maps from all viewp oin ts are pro cessed by a stac k of three fully connected la yers, consisting of tw o maxout lay ers (Go odfellow et al. 2013) with 2048 units with tw o linear filters each, and a lin- ear la yer that outputs 37 real num b ers. Maxout lay ers w ere used instead of ReLU la yers to reduce the num b er of connec- tions to the next lay er (and thus the n umber of parameters). W e did not use maxout in the con volutional la yers b ecause it pro ved to o computationally in tensive. W e a rrived at this particular arc hitecture after a man ual parameter searc h: more than 100 arc hitectures were ev alu- ated ov er the course of the competition, and this one was found to yield the b est predictiv e p erformance. The netw ork has roughly 42 million trainable parameters in total. T able 2 lists the hyperparameter settings for the trainable lay ers. The 37 v alues that the netw ork pro duces for an input image are con verted in to a set of probabilities. First, the v al- ues are passed through a rectification non-linearit y , and then normalized p er question to obtain a v alid categorical proba- bilit y distribution for each question. V alid probability distri- butions could also be obtained by using a softmax function p er question, instead of rectification follow ed by normaliza- tion. How ever, this decreased the o verall performance since it was harder for the netw ork to predict a probability of ex- actly 0 or 1. The distributions still need to b e rescaled, ho wev er; they giv e the probability of an answer conditional on its associ- ated question b eing asked, but each user is only asked a subset of the questions. This implies that some questions ha ve a lo wer probability of b eing asked, so the probabilities of the answ ers to these questions should b e scaled do wn to obtain unconditional probabilities. In practice w e scale them b y the probabilities of the answers that preceded them in the decision tree (see Figure 1). This post-pro cessing operation is incorporated into the net work. Because it consists only of differentiable op era- tions 7 , the gradient of the ob jective function can be back- propagated through it. This guaran tees that the output of 7 Although the rectification op eration is not technically differen- c 2014 RAS, MNRAS 000 , 1–20 Convnets for galaxy morpholo gy pr e diction 11 3 ( R GB ) 32 64 128 128 2048 ma x o u t ( 2) 2048 ma x o u t ( 2) 37 x 16 … … … … M a x p o o lin g = 20 x 20 M a x p o o lin g = 8x8 M a x p o o lin g = 2x2 45 45 40 40 16 16 6 6 4 4 6 6 5 5 3 3 3 3 Figure 8. Schematic o verview of the architecture of the b est performing netw ork that w e trained. The sizes of the filters and feature maps are indicated for each layer. t yp e # features filter size non-linearity initial biases initial weigh ts 1 con volutional 32 6 × 6 ReLU 0 . 1 N (0 , 0 . 01) 2 con volutional 64 5 × 5 ReLU 0 . 1 N (0 , 0 . 01) 3 con volutional 128 3 × 3 ReLU 0 . 1 N (0 , 0 . 01) 4 con volutional 128 3 × 3 ReLU 0 . 1 N (0 , 0 . 1) 5 dense 2048 – maxout (2) 0 . 01 N (0 , 0 . 001) 6 dense 2048 – maxout (2) 0 . 01 N (0 , 0 . 001) 7 dense 37 – constraints 0 . 1 N (0 , 0 . 01) T able 2. The hyperparameters of the trainable la yers of the best performing netw ork that we trained, also depicted in Figure 8. The last tw o columns describ e the initialization distributions of the weigh ts and biases of eac h la yer. See Section 7.6 for a description of the incorporation of the output constraints into the last layer of the network. the netw ork will not violate the constraints that the an- sw er probabilities must adhere to (for example, p bar m ust b e greater to or equal to p spiral in the cum ulative probabilities, since it is a higher-lev el question in the decision tree). This resulted in a small but significant p erformance improv ement. In addition to the b est p erforming netw ork, we also trained v arian ts for the purpose of mo del a veraging (see Sec- tion 7.8). These net works differ slightly from the b est per- forming netw ork, and make sligh tly different predictions as a result. V ariants included: • a net work with only tw o dense lay ers instead of three; • a netw ork with a different filter size configuration (filter sizes 8, 4, 3, 3 respectively instead of 6, 5, 3, 3); • a netw ork with ReLUs in the dense la yers instead of maxout units; • a netw ork with 256 filters instead of 128 in the topmost con volutional lay er. In total, 17 different netw orks were trained on this data set. tiable everywhere, it is sub differen tiable so this does not pose a problem in practice. 7.7 T raining T o train the models w e used minibatc h gradien t descen t with a batch size 8 of 16 and Nester ov momentum (Bengio et al. 2013) with co efficien t µ = 0 . 9. Nestero v momentum is a metho d for accelerating gradien t descent b y accumulating gradien ts o ver time in directions that consisten tly decrease the ob jective function v alue. This and similar metho ds hav e are commonly used neural netw ork training b ecause they sp eed up the training pro cess and often lead to improv ed predictiv e performance (Sutsk ever et al. 2013). W e p erformed appro ximately 1.5 million gradient up- dates, corresponding to 25 million training examples. F ol- lo wing Krizhevsky et al. (2012), we used a discrete learning rate schedule to improv e conv ergence. W e b egan with a con- stan t learning rate η = 0 . 04 and decreased it tenfold twice: it was decreased to 0 . 004 after 18 million examples, and to 0 . 0004 after 23 million examples. F or the first 10,000 ex- amples, the output constrain ts were ignored, and the linear output of the top la yer of the netw ork w as simply clipped b et ween 0 and 1. This was necessary to ensure con vergence. W eights in the mo del were initialized by sampling from 8 The batch size c hosen is small because the conv olutional part of the net work is applied 16 times to different viewp oin ts of the input images, yielding an effective batch size of 256. c 2014 RAS, MNRAS 000 , 1–20 12 Dieleman, Wil lett & Dambr e zero-mean normal distributions (Bengio 2012). The v ari- ances of these distributions were fixed at each lay er, and w ere manually chosen to ensure proper flow of the gradien t through the netw ork. All biases were initialized to positive v alues to decrease the risk of units getting stuc k in the sat- uration region. Although this is not necessary for maxout units, the same strategy w as used for the dense lay ers. The initialization strategy for all la yers is sho wn in the last t w o columns of T able 2. During training, we used dropout (Hin ton et al. 2012) in all three dense lay ers. Using drop out was essential to reduce o verfitting to manageable levels. 7.8 Mo del av eraging T o further improv e the prediction accuracy , we av eraged the predictions of several different mo dels, and across several transformations of the input images. Two requirements for mo del a veraging to be effective is that eac h individual model m ust hav e roughly the same prediction accuracy , and the prediction errors should be as uncorrelated as possible. F or eac h mo del, we computed predictions for 60 affine transformations of the input images: a combination of 10 ro- tations, spaced b y 36 ◦ , 3 rescalings (with scale factors 1 . 2 − 1 , 1 and 1 . 2) and optional horizontal flipping. An un weigh ted a verage of the predictions w as computed. Ev en though the mo del is trained to b e robust to these types of deforma- tions (see Section 7.4), computing av eraged predictions in this fashion still helped to increase prediction accuracy (see T able 3). In total, 17 v ariants of the mo del w ere trained with pre- dictions computed from the mean across 60 transformations. This resulted in 1020 sets of predictions av eraged in total. 7.9 Implemen tation All asp ects of the mo del w ere implemented using Python and the Theano library (Bergstra et al. 2010; Bastien et al. 2012). This allow ed the use of GPU acceleration without an y additional effort. Theano is also able to p erform au- tomatic differentiation, which simplifies the implementation of gradient-based optimization techniques. Netw orks were trained on NVIDIA GeF orce GTX 680 cards. Data augmen- tation was p erformed on the CPU using the scikit-image pac k age (v an der W alt et al. 2014) in parallel with model training on the GPU. T raining the net work described in Sec- tion 7.6 to ok roughly 67 hours in real time. The co de to repro duce the winning submis- sion for the Galaxy Challenge is a v ailable at https://github.com/benanne/kaggle-galaxies . 8 RESUL TS Comp etition results of the models are listed in T able 3. W e rep ort the performance of our b est p erforming netw ork, with and without av eraging across 60 transformations, as well as that of the combination of all 17 v ariants. The ro ot-mean- square error in T able 3 is the same metric used to score submissions in the Galaxy Challenge (Equation 1). Both av- eraging across transformations and av eraging across differ- en t mo dels contributed significantly to the final score. It is mo del leaderb oard score public priv ate best p erforming network 0.07671 0.07693 + av eraging ov er 60 transformations 0.07579 0.07603 + av eraging ov er 17 netw orks 0.07467 0.07492 T able 3. Performance (in RMSE) of the best performing net work, as well as the p erformance after a veraging across 60 transforma- tions of the input, and across 17 v ariants of the netw ork. Please refer to Section 3 for details on how the scores were computed. w orth noting that our model p erforms w ell even without an y mo del a veraging, which is important because fast inference is desirable for practical applications. If predictions are to be generated for millions of images, combining a large n umber of predictions for each image w ould require an impractical amoun t of computation. Although morphology prediction was framed as a re- gression problem in the comp etition (see Section 3), it is fundamen tally a classification task. T o demonstrate the ca- pabilities of our model in a more interpretable fashion, w e can look at classification accuracies. F or each question, w e can obtain classifications by selecting the answer with the highest probabilit y for each image. W e can do this both for the probabilities obtained from Galaxy Zo o participants, and for the probabilities predicted by our mo del. W e can then compute the classification accuracy simply b y counting the n umber of images for whic h the classifications matc h up. Re- ducing the probabilit y distributions to classifications in this fashion clearly causes some information to b e discarded, but classification accuracy is a metric that is m uch easier to in- terpret. T o find out how the level of agreemen t b et ween the Galaxy Zo o participants affects the accuracy of the predic- tions of our mo del, w e can compute the entrop y of the prob- abilit y distribution ov er the answers for a given question. The en tropy of a discrete probability distribution p ov er n options x 1 , . . . , x n is giv en b y: H ( p ) = − n X i =1 p ( x i ) log p ( x i ) . (6) If the en tropy is minimal, all participan ts selected the same answ er (i.e. every one agreed). If the en tropy is maxi- mal, all answ ers w ere equally lik ely to be selected. The en- trop y ranges b et ween 0 and log( n ). W e can conv ert it in to a measure of agreement a ( p ) as follows: a ( p ) = 1 − H ( p ) log( n ) . (7) The quan tity a ( p ) will equal 0 in case of maximal dis- agreemen t, and 1 in case of maximal agreement. T o assess the conditions under which the predictions of the mo del can b e trusted, w e can measure the confidence of a prediction using the same measure a ( p ) by applying it to the probabilit y distributions predicted b y the model, instead of the distributions of the crowdsourced answ ers. This allows us to relate model confidence and prediction accuracy . F or eac h question, w e selected the subset of images from c 2014 RAS, MNRAS 000 , 1–20 Convnets for galaxy morpholo gy pr e diction 13 the real-time ev aluation set 9 for which at least 50% of par- ticipan ts answered the question. This is to ensure that w e only consider images for whic h the question is likely rele- v ant. W e ranked all images in this subset according to the measure a ( p ) and divided them in to 10 equal bins. W e did this seperately for b oth the cro wdsourced answers and the mo del predictions. F or each bin, w e computed the av erage of a ( p ) and the classification accuracy using the best p er- forming netw ork (no av eraging). These v alues are visualized in a set of graphs for each question in Figure 9. The red circles show classification accuracy versus agreemen t. The blue squares sho w classification accuracy v ersus mo del con- fidence. The classification accuracy across the entire subset is also sho wn as a thick horizontal line. The dashed hori- zon tal lines indicate the maximal accuracy of 100% and the c hance-level accuracy , which dep ends on the n umber of op- tions. The num b er of images in eac h subset and the o verall classification accuracy are indicated ab o ve the graphs. F or all questions, the classification accuracy tapers off as the level of agreemen t b et ween Galaxy Zoo participants decreases. This makes sense, as those images are harder to classify . Kuminski et al. (2014) rep ort similar results us- ing the WND-CHARM algorithm, with lo west accuracies for features describing spiral arm and irregular structures. Our mo del achiev es near-perfect accuracy for most of the ques- tions when the lev el of agreemen t is high. Classifications for bulge dominance (Q5) and spiral arm tigh tness (Q10) hav e lo w agreemen t o verall, and are also more difficult to answ er for the mo del. Similarly , the confidence of the mo del in its predictions is correlated with classification accuracy: w e ac hiev e near- p erfect accuracy for most questions when the mo del is highly confiden t. This is a useful property , because it allo ws us to determine when we are able to trust the predictions, and when we should defer to an exp ert instead. As a conse- quence, the mo del could be used to filter a large collection of images, in order to obtain a muc h smaller set that can b e annotated manually b y exp erts. Suc h a tw o-stage approach w ould greatly reduce the exp erts’ w orkload at virtually no cost in terms of accuracy . F or questions 1, 2, 3, 6 and 7 in particular, w e are able to mak e confiden t, accurate predictions for the ma jority of examples. This w ould allo w us to largely automate the as- sessmen t of e.g. smoothness (Q1) and roundedness (Q7). F or questions 5 and 10 on the other hand, confidence is low across the b oard and the classification accuracy is usually too low to be of practical use. As a result, determining bulge domi- nance (Q5) and spiral arm tigh tness (Q10) would still require a lot of man ual input. The lev el to which w e are able to auto- mate the annotation process dep ends on the morphological prop erties we are interested in, as well as the distribution of morphology t yp es in the dataset w e wish to analyse. T o assess how well the model is able to predict v arious differen t morphology types, w e computed precision and re- call scores for all answ ers individually . The precision ( P ) and recall ( R ) scores are defined in terms of the n umber of true 9 W e could also hav e conducted this analysis on the ev aluation set from the competition, but since the true answer probabilities for the real-time evaluation set were readily av ailable and this set contains over 6,000 images, we used this instead. p ositiv e ( T P ), false p ositiv e ( F P ) and false negativ e ( F N ) classifications as follows: P = T P T P + F P , R = T P T P + F N . (8) The scores are listed in T able 4. W e used the same strat- egy as before to obtain classifications, and only considered those examples for which at least 50% of the Galaxy Zoo participan ts answ ered the question. The n umbers of exam- ples that were a v ailable for each question and answ er are also sho wn. F rom these scores, w e can establish that the mo del has more difficult y with morphology types that occur less fre- quen tly in the dataset, e.g., star or artifact (A1.3), no bulge (A5.1), dominant bulge (A5.4) and dust lane (A8.7). W e note that images in the first category are attempted to b e deli- brately excluded from the Galaxy Zo o data set via flags in the SDSS pipeline. Both the precision and recall scores are affected, so this effect cannot b e attributed en tirely to a bias to wards more common morphologies. How ever, recall is gen- erally affected more strongly than precision, which indicates that the mo del is more conserv ativ e in predicting rare mor- phology t yp es. F or a few very rare answ ers, we were unable to compute precision scores because the mo del nev er pre- dicted them for the examples that were considered: lens or ar c (A8.2), b oxy bulge (A9.2) and four spir al arms (A11.4). While these are all rare morphologies, they hav e consider- able scientific interest and constructing a mo del that can accurately iden tify them is still a primary goal. 9 ANAL YSIS T raditionally , neural netw orks are often treated as black b o xes that perform some complicated and unin terpretable sequence of computations that yield a goo d approximation to the desired output. How ev er, analysing the parameters of a trained mo del can b e v ery informative, and sometimes ev en leads to new insights ab out the problem the netw ork is trying to solv e (Zeiler & F ergus 2014). This is especially true for conv olutional neural netw orks trained on images, where the first-la yer filters can b e interpreted visually . Figure 10 sho ws the 32 filters learned in the first lay er of the b est p erforming net work described in Section 7.6. Each filter was contrast-normalized individually to bring out the details, and the three colour channels are shown separately . Comparing the filter weigh ts across colour channels reveals that some filters are more sensitive to particular colours, while others are sensitive to patterns, edges and textures. The same phenomenon is observed when training con volu- tional neural netw orks on more traditional image datasets. The filters for edge detection seem to b e lo oking for curv ed edges in particular, whic h is to b e exp ected b ecause of the radial symmetry of the input images. Figures 11 and 12 sho w how an input viewp oin t (i.e. a 45 × 45 part of an input image, see Section 7.5) activ ates the units in the conv olutional part of the netw ork. Note that the geometry of the input image is still apparent in the acti- v ations of higher conv olutional la yers. The activ ations of all la yers except the third are also quite sparse, esp ecially those of the fourth lay er. One possible reason wh y the third la yer c 2014 RAS, MNRAS 000 , 1–20 14 Dieleman, Wil lett & Dambr e 0.0 0.2 0.4 0.6 0.8 1.0 agreement / confidence 0 20 40 60 80 100 classification accuracy Q1: smoothness, 6144 examples average accuracy: 87.79% 0.0 0.2 0.4 0.6 0.8 1.0 agreement / confidence 0 20 40 60 80 100 classification accuracy Q2: edge-on, 3362 examples average accuracy: 96.04% 0.0 0.2 0.4 0.6 0.8 1.0 agreement / confidence 0 20 40 60 80 100 classification accuracy Q3: bar, 2449 examples average accuracy: 90.16% 0.0 0.2 0.4 0.6 0.8 1.0 agreement / confidence 0 20 40 60 80 100 classification accuracy Q4: spiral, 2449 examples average accuracy: 82.52% 0.0 0.2 0.4 0.6 0.8 1.0 agreement / confidence 0 20 40 60 80 100 classification accuracy Q5: bulge, 2449 examples average accuracy: 79.67% 0.0 0.2 0.4 0.6 0.8 1.0 agreement / confidence 0 20 40 60 80 100 classification accuracy Q6: anything odd, 6144 examples average accuracy: 94.76% 0.0 0.2 0.4 0.6 0.8 1.0 agreement / confidence 0 20 40 60 80 100 classification accuracy Q7: roundedness, 2619 examples average accuracy: 91.68% 0.0 0.2 0.4 0.6 0.8 1.0 agreement / confidence 0 20 40 60 80 100 classification accuracy Q8: odd feature, 824 examples average accuracy: 78.16% 0.0 0.2 0.4 0.6 0.8 1.0 agreement / confidence 0 20 40 60 80 100 classification accuracy Q9: bulge shape, 493 examples average accuracy: 89.86% 0.0 0.2 0.4 0.6 0.8 1.0 agreement / confidence 0 20 40 60 80 100 classification accuracy Q10: arm tightness, 1049 examples average accuracy: 70.73% 0.0 0.2 0.4 0.6 0.8 1.0 agreement / confidence 0 20 40 60 80 100 classification accuracy Q11: no. of arms, 1049 examples average accuracy: 73.12% Figure 9. Lev el of agreement (red circles) and model confidence (blue squares) v ersus classification accuracy for all questions (see T able 1), computed on the real-time ev aluation set. The ov erall classification accuracy is indicated as a thick horizontal line. The dotted and dashed horizontal lines indicate the maximal accuracy of 100% and the c hance-level accuracy resp ectiv ely . The num b er of images that were included in the analysis and the overall classification accuracy for each question are indicated ab o ve the graphs. activ ations are not as sparse is b ecause there is no po oling la yer directly follo wing it. It is also p ossible to visualize what neurons in the top- most hidden lay er of the netw ork (i.e. just b efore the output la yer) hav e learned about the data, by selecting representa- tiv e examples from the test set that maximize their activ a- tions. This reveals what type of inputs the unit is sensitiv e to, and what kind of in v ariances it has learned. Because w e used maxout units in this la yer, we can also select examples that minimally activ ate the units, allo wing us to determine whic h t yp es of inputs each unit discriminates betw een. Figure 13 shows such a visualization for three different units. Clearly each unit is able to discriminate betw een t wo distinct types of galaxies. The units also exhibit rotation in- c 2014 RAS, MNRAS 000 , 1–20 Convnets for galaxy morpholo gy pr e diction 15 (a) red channel (b) green channel (c) blue channel Figure 10. The 32 filters learned in the first conv olutional la yer of the b est-performing netw ork. Each filter w as con trast-normalized individually across all channels. v ariance, as well as some scale in v ariance. F or some units, w e observ ed selectivit y only in the positive or in the nega- tiv e direction (not shown). A minority of units seem to be m ultimo dal, activ ating in the same direction for t w o or more distinct types of galaxies. Presumably the activ ation v alue of these units is disambiguated in the context of all other unit v alues. The unit visualized in Figure 13b detects imaging ar- tifacts: black lines running across the centre of the images, whic h are the result of dead pixels in the SDSS camera. This is in teresting b ecause suc h (known) artifacts are not morphological features of the depicted galaxies. It turns out that the netw ork is trying to replicate the behaviour of the Galaxy Zoo participants, who tend to classify images fea- turing such artifacts as disturb e d galaxies (answ er A8.3 in T able 1), even though this is not the intended meaning of this answ er. Most lik ely this is b ecause the button for this answ er in the Galaxy Zoo 2 web interface seems to feature suc h a black line. Finally , w e can lo ok at some examples from the real- time ev aluation set (see Section 7.1) with low and high pre- diction errors, to get an idea of the strengths and w eaknesses of the mo del (Figure 14). The reported RMSE v alues were obtained with the b est p erforming net work and without any a veraging, and without centering or rescaling. The images that are difficult to classify are quite v ar- ied. Some are faint, but look fairly t ypical otherwise, suc h as Figure 14a. Most are negatively affected by the cropping op eration in v arious w ays: either b ecause they are not prop- erly centred, or b ecause they are very large (Figures 14b and 14c resp ectiv ely). This w as the original motiv ation for in tro ducing an additional rescaling and centering step during prepro cessing, but did not end up improving the o verall pre- diction accuracy . The easiest galaxies to classify are mostly smo oth, round ellipticals. 10 CONCLUSION AND FUTURE W ORK W e presen t a con volutional neural netw ork for fine-grained galaxy morphology prediction, with a no vel architecture that allows us to exploit rotational symmetry in the in- put images. The net work was trained on data from the Galaxy Zoo 2 pro ject and is able to reliably predict v ari- ous asp ects of galaxy morphology directly from raw pixel data, without requiring any form of handcrafted feature ex- traction. It can automatically annotate large collections of images, enabling quan titative studies of galaxy morphology on an unprecedented scale. Our no vel approac h to exploiting rotational symmetry w as essen tial to achiev e state-of-the-art performance, win- ning the Galaxy Challenge hosted on Kaggle. Although our winning solution required a veraging man y sets of predictions from different net works for eac h image, using a single net- w ork also yields competitive results. Our mo del can b e adapted to work with any collection of cen tered galaxy images and arbitrary morphological decision trees. Our implementation was developed using open source to ols and the source co de is publicly av ailable. The model can b e trained and used on consumer hardware. Its predic- tions are highly reliable when they are confident, making our approach applicable for fine-grained morphological anal- ysis of large-scale survey data. P erforming such large-scale analyses is an important direction for future research. F or future work, we would like to train netw orks on larger collections of annotated images. F rom previous ap- plications in the domain of computer vision, it has become clear that the p erformance of conv olutional neural net works scales very well with the size of the dataset. The ∼ 55 , 000 galaxy images used in this paper (90% of the provided train- ing set) is quite a small dataset b y modern standards. Even though we combined several techniques to a void ov erfitting, whic h allow ed us to train very large mo dels on this dataset effectiv ely , a clear opp ortunit y to improv e predictive p er- formance is to train the same mo del on a larger dataset, since Galaxy Zo o has already collected annotations for a m uch larger num b er of images. More recent iterations of the Galaxy Zo o pro ject hav e concentrated on higher red- shift samples, so care will ha ve to be taken to ensure that the model is able to generalize across differen t redshift slices. The use of larger datasets may also allow for a further increase in model capacit y (i.e. the num b er of trainable pa- rameters) without the risk of excessive ov erfitting. These high-capacit y models could be used as the basis for m uch larger surv eys suc h as the LSST. The integration of mo del predictions into existing annotation w orkflows, b oth b y ex- p erts and through cro wdsourcing platforms, will also require further study . Another possibility is the application of our approac h to c 2014 RAS, MNRAS 000 , 1–20 16 Dieleman, Wil lett & Dambr e input (45 × 45) lay er 1 (32 maps, 40 × 40) po oling 1 (32 maps, 20 × 20) lay er 2 (64 maps, 16 × 16) po oling 2 (64 maps, 8 × 8) lay er 3 (128 maps, 6 × 6) lay er 4 (128 maps, 4 × 4) po oling 4 (128 maps, 2 × 2) Figure 11. Activ ations of each lay er in the conv olutional part of the b est p erforming network, given the input viewp oin t sho wn in the top left. The num b er of feature maps and the size of each map is indicated b elo w eac h figure. The geometry of the input image is still apparent in the activations of higher convolutional layers. The activations of all layers except the thi r d are also quite sparse. input (45 × 45) lay er 1 (32 maps, 40 × 40) po oling 1 (32 maps, 20 × 20) lay er 2 (64 maps, 16 × 16) po oling 2 (64 maps, 8 × 8) lay er 3 (128 maps, 6 × 6) lay er 4 (128 maps, 4 × 4) po oling 4 (128 maps, 2 × 2) Figure 12. Same as Figure 11, but for a different input viewp oin t in the upp er left. c 2014 RAS, MNRAS 000 , 1–20 Convnets for galaxy morpholo gy pr e diction 17 (a) (b) (c) Figure 13. Example images from the test set that maximally and minimally activ ate units in the topmost hidden la yer of the best performing netw ork. Eac h group of 12 images represents a unit. The top row of images in eac h group maximally activ ate the unit, and bottom row of images minimally activate it. F rom top to b ottom, these galaxies primarily corresp ond to the Galaxy Zo o 2 lab els of: lo ose winding arms, edge-on disks, irregulars, disturbed, other, and tight winding arms. ra w photometric data which hav e not been preprocessed for visual inspection by h umans. The net works should be able to learn useful features from this represen tation, including structural c hanges from multiple wa vebands (eg, H¨ außler et al. 2013). Automated classification of other data mo dal- ities that exhibit radial symmetry (a commonly o ccurring prop ert y in nature, e.g. in flow ers, animals) also presents an in teresting opportunity . F rom a machine learning point of view, w e would lik e to in vestigate impro ved net work arc hitectures based on recen t dev elopments, suc h as the trend tow ards deep er net works with in excess of 20 la yers of processing and the use of smaller receptiv e fields (Szegedy et al. 2014; Simony an & Zisserman 2014). c 2014 RAS, MNRAS 000 , 1–20 18 Dieleman, Wil lett & Dambr e (a) 0.24610 (b) 0.21877 (c) 0.21145 (d) 0.20088 (e) 0.01112 (f ) 0.01174 (g) 0.01187 (h) 0.01223 Figure 14. Example images from the real-time ev aluation set, along with their prediction RMSEs for the b est-performing netw ork. The images on the top row were the most difficult for the model to classify; the images on the b ottom row were the easiest. Larger angular size and non-radially symmetric morphology are the most challenging targets for the mo del. A CKNOWLEDGEMENTS W e w ould lik e to thank Pieter-Jan Kindermans, F rancis wyf- fels, A¨ aron v an den Oord, Pieter Buteneers, Chris Lin tott, Philip Marshall and the anonymous reviewer for their v alu- able feedback. W e would like to ac knowledge Jo yce Noah- V anhouck e, Chris Lin tott, Da vid Harv ey , Thomas Kitching and Philip Marshall for their help in designing the Kag- gle Galaxy Challenge. W e thank Win ton Capital for their financial support of the comp etition, and the Galaxy Zoo v olunteers for providing the original morphology classifica- tions. Their efforts are individually ac knowledged at http: //authors.galaxyzoo.org . KWW is supp orted in part b y a UMN Grant-in-Aid. REFERENCES Ball N. M., Lov eday J., F ukugita M., Nak amura O., Ok a- m ura S., Brinkmann J., Brunner R. J., 2004, MNRAS, 348, 1038 Bamford S. P ., Nichol R. C., Baldry I. K., Land K., Lintott C. J., Sc hawinski K., Slosar A., Szalay A. S., Thomas D., T orki M., et al., 2009, MNRAS, 393, 1324 Banerji M., Lahav O., Lintott C. J., Ab dalla F. B., Scha w- inski K., Bamford S. P ., Andreescu D., Murra y P ., Raddic k M. J., Slosar A., et al., 2010, MNRAS, 406, 342 Bastien F., Lamblin P ., Pascan u R., Bergstra J., Go odfellow I., Bergeron A., Bouchard N., W arde-F arley D., Bengio Y., 2012, preprint Bengio Y., 2007, T echnical rep ort, Learning deep architec- tures for AI. Dept. IRO, Universit ´ e de Montreal Bengio Y., 2012, in , Neural Netw orks: T ricks of the T rade. Springer, pp 437–478 Bengio Y., Boulanger-Lewando wski N., Pascan u R., 2013, in IEEE In ternational Conference on Acoustics, Sp eec h and Signal Processing (ICASSP) Adv ances in optimizing recurren t net works. pp 8624–8628 Bergstra J., Breuleux O., Bastien F., Lam blin P ., Pascan u R., Desjardins G., T urian J., W arde-F arley D., Bengio Y., 2010, in Pro ceedings of the Python for Scientific Comput- ing Conference (SciPy) Theano: a CPU and GPU math expression compiler Bertin E., 1994, in , Science with Astronomical Near- Infrared Sky Surveys. Springer, pp 49–51 Bertin E., Arnouts S., 1996, Astronom y and Astroph ysics Supplemen t Series, 117, 393 Bishop C. M., 2006, P attern recognition and mac hine learn- ing. V ol. 1, springer New Y ork Boureau Y.-L., Ponce J., Lecun Y., 2010, in 27th Inter- national Conference on Machine Learning A theoretical analysis of feature po oling in visual recognition Bruna J., Zarem ba W., Szlam A., LeCun Y., 2013, preprint Clery D., 2011, Science, 333, 173 Collister A. A., Laha v O., 2004, P ASP , 116, 345 Darg D., Ka vira j S., Lintott C., Scha winski K., Sarzi M., Bamford S., Silk J., Pro ctor R., Andreescu D., Murray P ., et al., 2010, MNRAS, 401, 1043 De La Calleja J., F uentes O., 2004, MNRAS, 349, 87 Firth A. E., Lahav O., Somerville R. S., 2003, MNRAS, 339, 1195 F olkes S., Laha v O., Maddox S., 1996, MNRAS, 283, 651 F ukushima K., 1980, Biological cyb ernetics, 36, 193 c 2014 RAS, MNRAS 000 , 1–20 Convnets for galaxy morpholo gy pr e diction 19 precision recall # examples Q1: smoothness 6144 A1.1 smooth 0.8459 0.8841 2700 A1.2 features or disk 0.9051 0.8742 3435 A1.3 star or artifact 1.0000 0.4444 9 Q2: edge-on 3362 A2.1 yes 0.9065 0.8885 655 A2.2 no 0.9732 0.9778 2707 Q3: bar 2449 A3.1 yes 0.7725 0.7101 483 A3.2 no 0.9302 0.9486 1966 Q4: spiral 2449 A4.1 yes 0.8715 0.8270 1451 A4.2 no 0.7659 0.8226 998 Q5: bulge 2449 A5.1 no bulge 0.6697 0.5000 146 A5.2 just noticeable 0.7828 0.8475 1174 A5.3 obvious 0.8292 0.8049 1092 A5.4 dominan t 0.4444 0.1081 37 Q6: anything o dd 6144 A6.1 yes 0.8438 0.7500 828 A6.2 no 0.9617 0.9784 5316 Q7: roundedness 2619 A7.1 completely round 0.9228 0.9282 1197 A7.2 in b et ween 0.9128 0.9171 1279 A7.3 cigar-shap ed 0.9000 0.8182 143 Q8: odd feature 824 A8.1 ring 0.9097 0.9161 143 A8.2 lens or arc ? 0.0000 2 A8.3 disturbed 0.8000 0.4138 29 A8.4 irregular 0.8579 0.8674 181 A8.5 other 0.6842 0.6810 210 A8.6 merger 0.7398 0.7773 256 A8.7 dust lane 0.5000 0.6667 3 Q9: bulge shape 493 A9.1 rounded 0.9143 0.9412 340 A9.2 boxy ? 0.0000 8 A9.3 no bulge 0.8601 0.8483 145 Q10: arm tightness 1049 A10.1 tight 0.7500 0.7350 449 A10.2 medium 0.6619 0.7112 457 A10.3 loose 0.7373 0.6084 143 Q11: no. of arms 1049 A11.1 1 1.0000 0.2037 54 A11.2 2 0.8201 0.8691 619 A11.3 3 0.4912 0.3182 88 A11.4 4 ? 0.0000 21 A11.5 more than 4 0.4000 0.4000 20 A11.6 can’t tell 0.5967 0.7368 247 T able 4. Precision and recall scores for each answer. W e com- pute these v alues only for the subset of examples in the real-time ev aluation set where at least 50% of participan ts answered the question. W e also give the num b er of examples that are in this subset for each answer. A question mark indicates that we were unable to compute the precision score b ecause the model did not predict this answer for any of the considered examples. Gens R., Domingos P ., 2014, in Adv ances in Neural Infor- mation Pro cessing Systems 27 (NIPS 2014) Deep symme- try net works Glorot X., Bordes A., Bengio Y., 2011, in JMLR W&CP: Pro ceedings of the F ourteenth International Conference on Artificial In telligence and Statistics (AIST A TS 2011) Deep sparse rectifier neural netw orks Go odfellow I. J., W arde-F arley D., Mirza M., Courville A., Bengio Y., 2013, reprin t Gori S., Ham burger K., Spillmann L., 2006, Vision researc h, 46, 3267 H¨ außler B., Bamford S. P ., Vik a M., Ro jas A. L., Barden M., Kelvin L. S., Alpaslan M., Rob otham A. S. G., Driver S. P ., Baldry I. K., Brough S., Hopkins A. M., Liske J., Nic hol R. C., P op escu C. C., T uffs R. J., 2013, MNRAS, 430, 330 Hin ton G. E., Osindero S., T eh Y.-W., 2006, Neural Com- putation, 18, 1527 Hin ton G. E., Sriv astav a N., Krizhevsky A., Sutsk ev er I., Salakh utdinov R. R., 2012, T echnical report, Improving neural netw orks by preven ting co-adaptation of feature detectors. Universit y of T oronto Ho c hreiter S., Bengio Y., F rasconi P ., Schmidh ub er J., , 2001, Gradient flow in recurrent nets: the difficulty of learning long-term dep endencies Huertas-Compan y M., Aguerri J., Bernardi M., Mei S., Almeida J. S., 2010, preprint Krizhevsky A., Sutskev er I., Hinton G. E., 2012, in Ad- v ances in Neural Information Processing Systems 25 (NIPS 2012) Imagenet classification with deep conv olu- tional neural netw orks Kuminski E., George J., W allin J., Shamir L., 2014, P ASP , 126, 959 Laha v O., Naim A., Buta R. J., Corwin H. G., de V au- couleurs G., Dressler A., Huchra J. P ., v an den Bergh S., Ra ychaudh ury S., So dre Jr. L., Storrie-Lom bardi M. C., 1995, Science, 267, 859 Laha v O., Nairn A., Sodr´ e L., Storrie-Lombardi M., 1996, MNRAS, 283, 207 Land K., Slosar A., Lin tott C., Andreescu D., Bamford S., Murra y P ., Nic hol R., Raddic k M. J., Sc hawinski K., Sza- la y A., Thomas D., V andenberg J., 2008, MNRAS, 388, 1686 LeCun Y., Bottou L., Bengio Y., Haffner P ., 1998, Proceed- ings of the IEEE, 86, 2278 Lin tott C., Sc hawinski K., Bamford S., Slosar A., Land K., Thomas D., Edmondson E., Masters K., Nichol R. C., Raddic k M. J., Szala y A., Andreescu D., Murray P ., V an- den b erg J., 2011, MNRAS, 410, 166 Lin tott C. J., Sc hawinski K., Keel W., V an Ark el H., Ben- nert N., Edmondson E., Thomas D., Smith D. J., Herb ert P . D., Jarvis M. J., et al., 2009, MNRAS, 399, 129 Lin tott C. J., Scha winski K., Slosar A., Land K., Bamford S., Thomas D., Raddic k M. J., Nic hol R. C., Szalay A., Andreescu D., Murray P ., V andenberg J., 2008, MNRAS, 389, 1179 McCullo c h W. S., Pitts W., 1943, The bulletin of mathe- matical biophysics, 5, 115 Mairal J., Koniusz P ., Harchaoui Z., Sc hmid C., 2014, preprin t Masters K. L., Mosleh M., Romer A. K., Nic hol R. C., Bam- ford S. P ., Scha winski K., Lintott C. J., Andreescu D., c 2014 RAS, MNRAS 000 , 1–20 20 Dieleman, Wil lett & Dambr e Campb ell H. C., Crow croft B., et al., 2010, MNRAS, 405, 783 Masters K. L., Nichol R. C., Hoyle B., Lintott C., Bamford S. P ., Edmondson E. M., F ortson L., Keel W. C., Sc haw- inski K., Smith A. M., et al., 2011, MNRAS, 411, 2026 Melvin T., Masters K., Lin tott C., Nichol R. C., Simmons B., Bamford S. P ., Casteels K. R. V., Cheung E., Edmond- son E. M., F ortson L., Scha winski K., Skibba R. A., Smith A. M., Willett K. W., 2014, MNRAS Naim A., Laha v O., So dre L., Storrie-Lom bardi M., 1995, MNRAS, 275, 567 Nair V., Hinton G. E., 2010, in Pro ceedings of the 27th In- ternational Conference on Mac hine Learning (ICML-10) Rectified linear units impro ve restricted boltzmann ma- c hines Odew ahn S., Sto c kwell E., Pennington R., Humphreys R., Zumac h W., 1992, in , Digitised Optical Sky Surveys. Springer, pp 215–224 Orlo v N., Shamir L., Macura T., Johnston J., Ec kley D. M., Goldb erg I. G., 2008, Pattern recognition letters, 29, 1684 P olsterer K. L., Gieseke F., Kramer O., 2012, in Astronom- ical Data Analysis Soft ware and Systems XXI V ol. 461, Galaxy classification without feature extraction. p. 561 Raza vian A. S., Azizp our H., Sulliv an J., Carlsson S., 2014, preprin t Sc hawinski K., Lintott C., Thomas D., Sarzi M., Andreescu D., Bamford S. P ., Ka vira j S., Khochfar S., Land K., Mur- ra y P ., et al., 2009, MNRAS, 396, 818 Shamir L., 2009, MNRAS, 399, 1367 Shamir L., Holinchec k A., W allin J., 2013, Astronom y and Computing, 2, 67 Sifre L., Mallat S., 2013, in IEEE Conference on Computer Vision and Pattern Recognition (CVPR) Rotation, scaling and deformation in v ariant scattering for texture discrimi- nation. pp 1233–1240 Simmons B. D., Lin tott C., Sc ha winski K., Moran E. C., Han A., Ka vira j S., Masters K. L., Urry C. M., Willett K. W., Bamford S. P ., Nichol R. C., 2013, MNRAS, 429, 2199 Simon yan K., Zisserman A., 2014, preprin t Skibba R. A., Bamford S. P ., Nichol R. C., Lin tott C. J., Andreescu D., Edmondson E. M., Murray P ., Raddick M. J., Scha winski K., Slosar A., Szalay A. S., Thomas D., V andenberg J., 2009, MNRAS, 399, 966 Sriv astav a N., Hinton G., Krizhevsky A., Sutsk ever I., Salakh utdinov R., 2014, Journal of Machine Learning Re- searc h, 15, 1929 Storrie-Lom bardi M., Lahav O., Sodre L., Storrie-Lombardi L., 1992, MNRAS, 259, 8P Sutsk ever I., Martens J., Dahl G., Hinton G., 2013, in Pro- ceedings of the 30th International Conference on Machine Learning (ICML-13) On the importance of initialization and momen tum in deep learning. pp 1139–1147 Szegedy C., Liu W., Jia Y., Sermanet P ., Reed S., Anguelo v D., Erhan D., V anhouc k e V., Rabinovic h A., 2014, preprin t v an der W alt S., Sch¨ on b erger J. L., Nunez-Iglesias J., Boulogne F., W arner J. D., Y ager N., Gouillart E., Y u T., 2014, T echnical rep ort, scikit-image: Image pro cessing in Python. PeerJ PrePrints Willett K. W., Lintott C. J., Bamford S. P ., Masters K. L., Simmons B. D., Casteels K. R., Edmondson E. M., F ortson L. F., Ka vira j S., Keel W. C., et al., 2013, MNRAS, 435, 2835 Willett K. W., Scha winski K., Simmons B. D., Masters K. L., Skibba R. A., Kavira j S., Melvin T., W ong O. I., Nic hol R. C., Cheung E., Lin tott C. J., F ortson L., 2015 Zeiler M. D., F ergus R., 2014, in , Computer Vision–ECCV 2014. Springer, pp 818–833 This paper has b een t yp eset from a T E X/ L A T E X file prepared b y the author. c 2014 RAS, MNRAS 000 , 1–20
Original Paper
Loading high-quality paper...
Comments & Academic Discussion
Loading comments...
Leave a Comment