Turnover Rate of Popularity Charts in Neutral Models
It has been shown recently that in many different cultural phenomena the turnover rate on the most popular artefacts in a population exhibit some regularities. A very simple expression for this turnover rate has been proposed by Bentley et al. and its validity in two simple models for copying and innovation is investigated in this paper. It is found that Bentley’s formula is an approximation of the real behaviour of the turnover rate in the Wright-Fisher model, while it is not valid in the Moran model.
💡 Research Summary
The paper revisits the turnover rate of popularity charts—defined as the number of artefacts that either enter or leave the top‑y list between successive updates—in two classic neutral models of cultural transmission: the Wright‑Fisher model and the Moran model. The motivation stems from Bentley et al.’s (2013) claim that, for the Wright‑Fisher model, the turnover rate follows a simple universal law
z = 2 √(μ y)
where μ is the per‑individual innovation probability and y is the chart size. This expression is attractive because it is independent of the population size N and suggests a square‑root dependence on the innovation rate reminiscent of a random‑walk process. The authors set out to test the robustness of this formula across a much broader parameter space and to determine whether it also holds for the Moran model.
Model definitions and simulation protocol
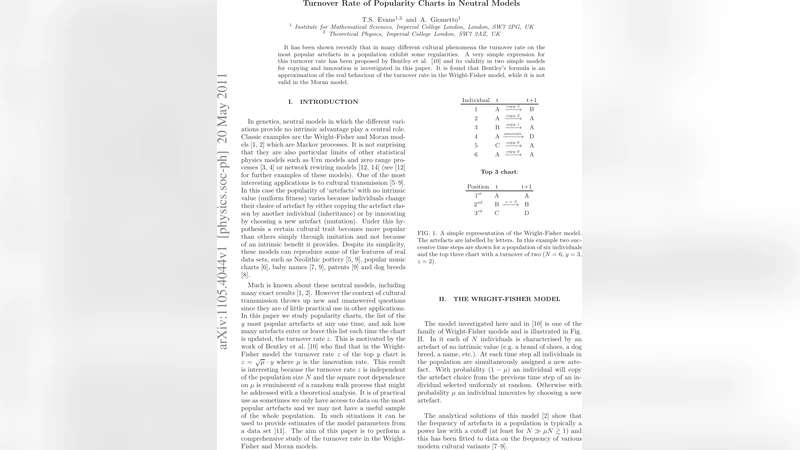
In the Wright‑Fisher model each of the N individuals simultaneously adopts a new artefact at each generation. With probability (1 − μ) an individual copies the artefact of a randomly chosen peer from the previous generation; with probability μ it innovates, i.e., creates a brand‑new artefact. Simulations start from a maximally diverse state (each individual holds a unique artefact) and are run for τ = 4 μ⁻¹ generations to reach stationarity, as verified by the decay of the two‑point correlation function F₂(t). After the burn‑in, the top‑y chart is constructed at each of the next T = 50 + μ⁻¹ generations using a quicksort routine, and the turnover z is measured as the sum of entries and exits between consecutive charts. An ensemble of E = 10⁴ independent runs yields the average turnover ⟨z⟩ and its standard error.
The Moran model differs only in the update rule: at each elementary time step a single individual is selected at random, copies another individual with probability (1 − μ) or innovates with probability μ. The same turnover measurement is applied after the system reaches equilibrium.
Key empirical findings
The authors discover two distinct regimes in the Wright‑Fisher model, separated by the dimensionless quantity N μ ≈ 0.15 y.
- Low‑innovation regime (N μ < 0.15 y).
Here the average number of new artefacts per generation (N μ) is smaller than the chart size y, so the top‑y list often contains empty slots. In this situation the turnover is dominated by the immediate extinction of each newly introduced artefact. Consequently the measured turnover follows a simple linear law
z ≈ 2 N μ
independent of y. This result explains why the turnover does not display the square‑root dependence on μ in this regime.
- High‑innovation regime (N μ > 0.15 y).
In this region the data roughly follow the Bentley form, but a more accurate fit requires a generalized power‑law
z = d μᵃ yᵇ Nᶜ
with fitted exponents a ≈ 0.55, b ≈ 0.86, c ≈ 0.13 and prefactor d ≈ 1.38. The exponent a is close to the √μ prediction (a = 0.5) and b is near the linear dependence on y (b = 1), yet the non‑zero c reveals a weak but systematic dependence on population size, contradicting Bentley’s claim of N‑independence. Residual analysis shows systematic deviations for large N μ, prompting the authors to introduce a correction term
Res(μ, y, N) = R₀
Comments & Academic Discussion
Loading comments...
Leave a Comment