The Nyquist-Shannon sampling theorem and the atomic pair distribution function
We have systematically studied the optimal real-space sampling of atomic pair distribution data by comparing refinement results from oversampled and resampled data. Based on nickel and a complex perovskite system, we demonstrate that the optimal sampling is bounded by the Nyquist interval described by the Nyquist-Shannon sampling theorem. Near this sampling interval, the data points in the PDF are minimally correlated, which results in more reliable uncertainty prediction. Furthermore, refinements using sparsely sampled data may run many times faster than using oversampled data. This investigation establishes a theoretically sound limit on the amount of information contained in the PDF, which has ramifications towards how PDF data are modeled.
💡 Research Summary
The paper investigates the optimal real‑space sampling interval for atomic pair distribution function (PDF) analysis by directly applying the Nyquist‑Shannon sampling theorem. The PDF, G(r), is obtained as a truncated Fourier transform of the total scattering structure function, F(Q), which is experimentally limited to a maximum momentum transfer Q_max. According to the Nyquist‑Shannon theorem, a continuous signal containing frequency components up to Q_max can be perfectly reconstructed from samples taken at intervals dr smaller than the Nyquist interval dr_N = π / Q_max. The authors derive the reconstruction formula (Eq. 4) and discuss how sampling finer than dr_N preserves all information, while sampling at or above dr_N leads to aliasing: high‑Q information folds back into lower Q, distorting the PDF.
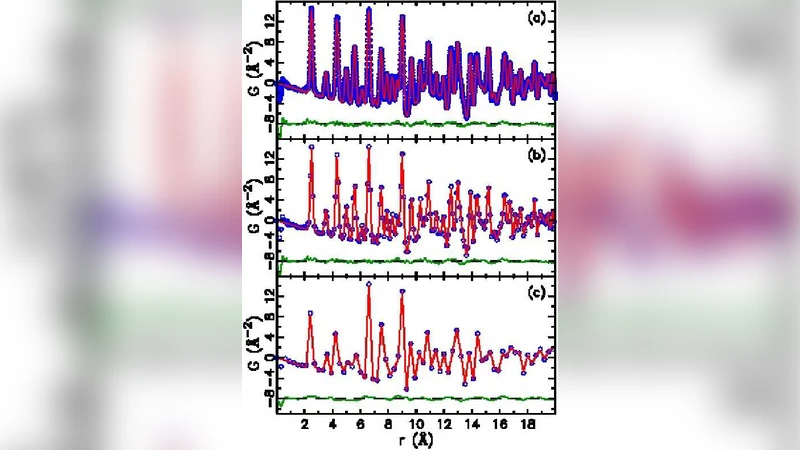
To test these theoretical predictions, the authors performed systematic experiments on two benchmark systems: elemental nickel measured with high‑energy X‑ray rapid acquisition PDF (RaPDF) (Q_max = 29.9 Å⁻¹) and the perovskite LaMnO₃ measured with time‑of‑flight neutron diffraction (Q_max = 32.0 Å⁻¹). PDFs were first generated on a very fine grid (dr = 0.01 Å) and then sparsified by removing points to achieve a series of coarser grids ranging from dr = 0.02 Å up to dr = 0.15 Å. For each grid, the same structural model (lattice parameters, isotropic atomic displacement parameters, scale, resolution, etc.) was refined using PDFgui, which employs a Levenberg‑Marquardt algorithm and provides parameter uncertainties.
The authors introduce a “parameter quality factor” Q_p(dr) = Δp(dr) / σ(Δp(dr)), where Δp(dr) is the absolute difference between a parameter refined from a sparsely sampled PDF and the reference refinement (dr = 0.01 Å), and σ(Δp(dr)) combines the uncertainties from both refinements. A value Q_p ≤ 1 indicates that the sparse‑data refinement is statistically consistent with the reference; Q_p > 1 signals unreliability.
Results show that when dr is close to, but still smaller than, the Nyquist interval (≈0.10 Å for Ni, ≈0.098 Å for LMO), the PDFs become visibly less smooth yet retain the essential peak shapes. The quality factors for all refined parameters remain ≤1, indicating that the structural information is preserved and the uncertainties are realistic. As dr exceeds dr_N, aliasing becomes evident: Q_p rises well above 1 (often 1.5–3.0), lattice constants and ADPs deviate significantly, and the refined model no longer represents the true structure. Conversely, using dr much smaller than dr_N (over‑sampling) does not improve the structural information but dramatically increases computational time (5–10× slower) and leads to artificially small uncertainties because of strong point‑to‑point correlations.
The paper also discusses the theoretical upper bound on the number of independent observations, N = Δr·Q_max/π, where Δr is the r‑range used in the refinement. While N provides a ceiling on the number of structural parameters that can be extracted, the actual usable information depends on signal‑to‑noise ratio, peak overlap, and the specific features of interest. In the present study, the observation‑to‑parameter ratios (OPR) exceed 30 for Ni and 10 for LMO, ensuring that the refinements are well‑constrained.
In conclusion, the authors demonstrate that the Nyquist interval offers a rigorous, physics‑based guideline for choosing the PDF sampling grid. Sampling at dr ≈ 0.9·dr_N yields minimally correlated data points, reliable uncertainty estimates, and a substantial speed‑up (up to an order of magnitude) compared with conventional oversampled PDFs. Sampling coarser than dr_N leads to aliasing and unreliable refinements, while oversampling wastes computational resources without adding information. These findings have immediate practical implications for high‑throughput PDF analysis, real‑time structural monitoring, and the development of automated pipelines that must balance accuracy, speed, and data volume. Future work could extend the validation to amorphous materials, low‑Q_max datasets, and integrate the optimal sampling strategy into machine‑learning‑based PDF modeling frameworks.
Comments & Academic Discussion
Loading comments...
Leave a Comment