Valued Ties Tell Fewer Lies, II: Why Not To Dichotomize Network Edges With Bounded Outdegrees
Various methods have been proposed for creating a binary version of a complex network with valued ties. Rather than the default method of choosing a single threshold value about which to dichotomize, we consider a method of choosing the highest k out…
Authors: Andrew C. Thomas, Joseph K. Blitzstein
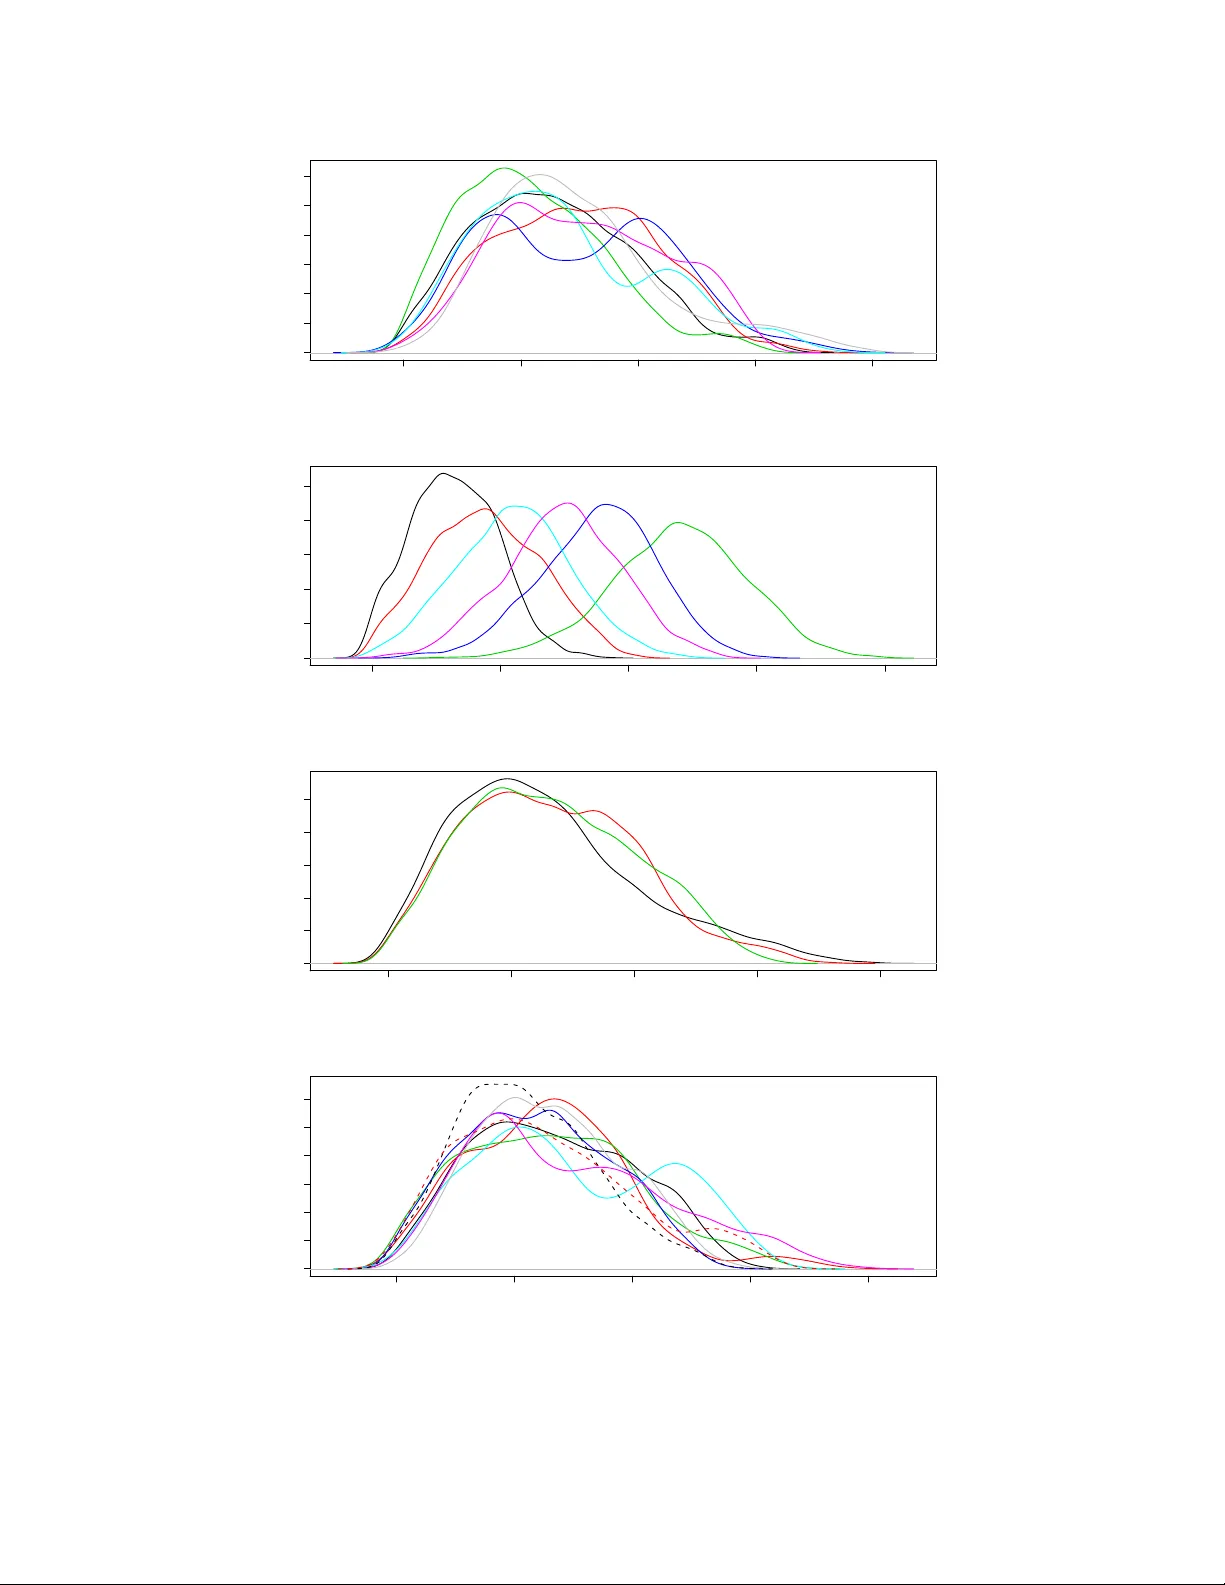
V alued Ties T ell F ew er Lies, I I: Wh y Not T o Dic hotomize Net w ork Edges With Bounded Outdegrees Andrew C. Thomas ∗ Joseph K. Blitzstein † Octob er 26, 2018 Abstract V arious metho ds ha v e b een proposed for creating a binary version of a complex net work with v alued ties. Rather than the default metho d of choosing a single threshold v alue ab out whic h to dic hotomize, we consider a metho d of c ho osing the highest k outb ound arcs from eac h p erson and assigning a binary tie, as this has the adv antage of minimizing the isolation of no des that may otherwise be weakly connected. Ho w ev er, sim ulations and real data sets establish that this metho d is w orse than the default thresholding m etho d and should not b e generally considered to deal with v alued netw orks. 1 In tro duction When considering complex net w orked systems, there is a strong history of reducing the relative strengths of connections into a simpler, binary format. Muc h of this has to do with the history of the discipline and its ro ots in graph theory , though as the field of complex netw ork analysis has gro wn into the analysis of many types of data, muc h of the softw are that exists for this analysis is still applicable only to binary connections. This has spa wned a num b er of attempts to create binary versions of v alued net w orks so as to p erform some kind of analysis. A standard strategy for accomplishing this is to apply a uniform threshold to all ties in the set, set all higher v alues to “one” and all below to “zero”. Thomas and Blitzstein [2010b] sho ws that even “principled” c hoices of threshold can differ wildly from each other, so that substantial amoun ts of information can b e lost, and moreso than in other settings where dichotomization is practiced. (Thomas and Blitzstein [2010b] also con tains a more thorough discussion of dic hotomization of v alued net works.) One of the issues with a straight threshold is that a netw ork that was originally fully connected ma y no w ha v e disconnected comp onents, esp ecially weakly connected no des that now b ecome singletons; this can lead to other cases of bias, including the notion that “strong” and “w eak” ∗ Visiting Assistan t Professor, Departmen t of Statistics, Carnegie Mellon Universit y . Corresp onding author: email act@acthomas.ca. This work was supported by gran t PO1-AG031093 from the NIA through the Christakis lab at Harv ard Medical School and D ARP A gran t 21845-1-1130102 through the CMU Statistics Departmen t. † Assistan t Professor, Department of Statistics, Harv ard Univ ersity . 1 ties ha ve different functions in so cial net w orks [Granov etter, 1973]. If a binary v ersion of a v alued graph is accurate, it is lik ely that b oth of these kinds of ties must b e resp ected in some w a y . There is also the kno wn problem that many net work data sets are incomplete due to the friend-naming mechanism [Thomas, 2010], which typically asks resp onden ts to name up to a fixed n um b er of contacts (who will themselves hop efully b e in the netw ork) and censors the rest from view. Assuming that all resp onden ts’ c hoices of friends are true, the consequences of this can b e mitigated with a high limit on the num b er of p otential names. Com bining these factors leads to an in triguing p ossibility for dic hotomizing the net w ork: the artificial implemen tation of the “name- k -friends” strategy at the analysis stage. By delib erately c ho osing each individual’s k strongest ties as the binary netw ork, and resymmetrizing if necessary , a binary v ersion of the v alued graph can b e produced that ma y preserv e whatev er features of in terest in the system are of in terest to the in vestigator. The pro cedure for a particular v alued graph, whether from a real data set or sim ulated according to a model family , is as follo ws: • Cho ose a feature, or set of features, of the v alued graph to b e preserv ed in the transformation. These can corresp ond to no dal c haracteristics like closeness or b etw eenness cen trality , or global prop erties lik e diameter. • Select a ladder of maximal out-degrees to whic h no des can b e censored. F or eac h outdegree v alue k , create a directed graph by selecting the top k outb ound arcs in v alue, censoring the rest and assigning the non-zero ties a v alue of 1. • If the original graph is undirected, symmetrize the dic hotomized directed graph to pro duce an undirected coun terpart, b y assigning an edge if either or b oth arcs is equal to 1. • F or each maximal out-degree, calculate the relev an t statistics for the dic hotomized graph. Compare these to the v alued graph and c ho ose an optimal maximal out-degree for eac h statistic in the selection according to this statistic. T o inv estigate the effectiveness of this pro cedure, we first outline the sim ulation of netw orks from a broad generativ e mo del framework, as sp ecified in Thomas and Blitzstein [2010a]. w e then outline a n um b er of features that can b e preserved in the transformation of the v alued graphs in to binary coun terparts, and demonstrate the metho d on a series of sim ulated and real examples. W e show that this metho d p erforms worse on t w o real data sets than the standard thresholding pro cedure, and still maintains man y of its flaws on simulated data, namely that netw orks with high heterogeneity on no de degree are not w ell-preserved under the transformation. 2 2 Sim ulation Mo dels W e use the Generalized Linear Model framework of Thomas and Blitzstein [2010a] to generate v alued, undirected net w orks with v arious c haracteristics and properties. In particular, sp ecify Y ij as the v alued connection b et w een no des i and j ; in the simulation pro cess, we consider only undirected graphs so that Y ij = Y j i . The generation pro ceeds according to the follo wing recip e (iden tical to that in Thomas and Blitzstein [2010b]): • Select a generativ e family from the GLM to olkit where edges hav e nonnegative v alue, suc h as Y ij | µ ij ∼ 1 µ ij Gamma ( µ 2 ij ) or Y ij | µ ij ∼ P oisson ( µ ij ) . The former will giv e a con tin uum of tie v alues, while the latter can pro duce graphs that con tain explicit zeros. • Select a series of laten t parameters that define µ ij : – Sender/receiver effects α i ∼ N (0 , σ 2 α ), where a larger σ α yields more heterogeneity b et w een no des. – Latent geometric structure: nodes ha v e p ositions ~ d i , and a coefficient of distance vs. connectivit y γ . F or this inv estigation, no des can lie equally spaced on a ring of unit radius, or in a single cloud from a biv ariate normal distribution. – Latent clusters. Eac h no de is assigned membership in one of three clusters ( a i = k ), and prefer links either within their cluster or with those no des in other clusters with prop ensit y λ . In this simulation, only one of clusters and geometry can b e implemen ted at one time. – An assortative mixing factor χ equal to 0.5, 0 or -0.5 (the disassortative case), whic h determines whether degree itself is a factor in tie formation; in the assortative case, the p opular individuals are more lik ely to form ties with with each other than otherwise exp ected, and lik ewise for the unp opular individuals. – The n um b er of no des in the system, in this case b etw een 50 and 600 (limited up wards to make computation tractable). 3 Quan tit y V alues No des 50 100 200 300 400 500 600 P op/Greg Signal 0.1 0.5 1 2.5 10 100 Geometry None Ring Cloud Cluster + Cluster - Geo. Strength 0.25 3 Assortativ e Mixing 0 0.5 -0.5 F amily Gamma P oisson T able 1: Simulation parameters to inv estigate the effects of censoring and dic hotomizing v alued net w orks by out-degree as an alternative to threshold-based dic hotomization. Netw orks with 50, 100 and 200 no des are sim ulated in the tests of geometric prop erties; larger netw orks (up to 600) are also generated for the linear mo del implemen tations. All together, this giv es an outcome parameter for a tie equal to µ ij = α i + α j + χα i α j − γ | ~ d i − ~ d j | + λ I ( a i = a j ); (1) note that this is symmetric in i and j . A list of all options for the ab ov e parameters is shown in T able 1. T o keep the parameter v alues p ositive, their v alues are b ounded ab ov e zero with the trans- formation function µ pos = f ( µ ) = exp ( µ − 1) I ( µ < 1) + µ I ( µ ≥ 1), rather than setting all negativ e-parameter draws to zero; in execution, the difference is negligible compared to the magnitude of the other ties in the system. 3 Effect on Net w ork Characteristics The statistical measures w e consider are based on t wo families of distance measures on graphs: • Geo desic measures, which are based on the shortest path distance d ( i, j ) b et w een tw o no des i and j (see F reeman [1979] for an excellen t ov erview of these metho ds). The recipro cal of this is the closeness 1 /d ( i, j ) whic h has the prop ert y that tw o no des in separate comp onents ha v e zero closeness, rather than infinite distance. • Ohmic measures, which are based on the interpretation of so cial ties as resistors (or, more appropriately , conductors) in an electrical grid, so that the distance d Ω ( i, j ) b etw een tw o no des i and j is equiv alen t to the resistance of the circuit formed b y connecting no des i and j (with sym b ol 1 /G eq ij , so that G eq ij is the so cial equiv alent of electrical conductance). The notion is useful in physical chemistry [Klein and Randic, 1993; Brandes and Fleisc her, 2005] but is also finding new uses in complex net w ork analysis due to its connections with random w alks and eigenv alue decomp ositions [Newman, 2005]. Thomas [2009] gives a more thorough 4 analysis of these measures and their comparisons with their geo desic equiv alen ts; what is most relev an t is that these are more sensitive to the total length of all paths that connect t w o p oin ts, to whic h geo desic measures, concerned only with the shortest single path, are largely indifferent. F or any netw ork, v alued or binary , there is a collection of graph statistics based on geo desic and Ohmic measures that apply to the individuals within. The choice of threshold affects the no de statistics b oth in absolute terms and relative to eac h other, and the inherent uncertaint y in the measuremen t of tie v alues suggests that these statistics v ary b etw een differen t iterations at the same threshold lev el, hence the increased reliabilit y of using a n umber of replicates. F or this analysis, three measures of net work cen trality are considered: • Harmonic geodesic closeness, C 1 /C ( i ) = P j 1 d ( i,j ) + 1 d ( j,i ) ; • Ohmic closeness, C Ω ( i ) = P j G eq ij ; • Fixed-p ow er Ohmic b et w eenness, C P ( i ) = P a P b 6 = a 1 √ G eq ab P j 6 = i I ab ij , as described in Thomas [2009] 1 (relativ e rank only) Considering the absolute measures of node c haracteristics, it is simply a matter of calculating the statistic for each no de, at eac h threshold, within each replicate, and con v erting the estimate in to the units of the v alued graph. The optimal threshold is that whic h giv es the lo w est squared deviation across iterations It ma y also be preferable to consider only the relativ e imp ortance of nodes, thereby removing the concern of a c hange in units. As a frequently asked question of netw ork ed systems is “Who is the most imp ortan t individual” b y some set of criteria, rank-order statistics are a logical choice to measure the change of imp ortance of individuals b et w een t wo instances of a graph. Since there is also far more interest in the more imp ortan t individuals (those with rank R i closer to 1) than the less imp ortant ones (with rank R i closer to N ), a rank discrepancy statistic of the form D ab = 1 N X i ( R ai − R bi ) 2 √ R ai R bi is used, where R ai and R bi are the ranks of individual i in instances lab elled a and b . Ties in rank are randomly assorted so that, among other factors, an empt y or complete graph is uninformativ e as to the supremacy of one no de o ver another. 5 ● ● ● ● ● ● ● ● ● ● ● ● ● ● ● ● ● ● ● ● ● ● ● ● ● ● ● ● ● ● ● ● ● ● ● ● ● ● ● ● ● ● ● ● ● ● ● ● ● ● ● ● ● ● ● ● ● ● ● ● ● ● ● ● ● ● ● ● ● ● ● ● ● ● ● ● ● ● ● ● ● ● ● ● ● ● ● ● ● ● ● ● ● ● ● ● ● ● ● ● ● ● ● ● ● ● ● ● ● ● ● ● ● ● ● ● ● ● ● ● ● ● ● ● ● ● ● ● ● ● ● ● ● ● ● ● ● ● ● ● ● ● ● ● ● ● ● ● ● ● ● ● ● ● ● ● ● ● ● ● ● ● ● ● ● ● ● ● ● ● ● ● ● ● ● ● ● ● ● ● ● ● ● 0.5 1.0 2.0 5.0 10.0 20.0 50.0 200.0 0.5 1.0 2.0 5.0 20.0 50.0 200.0 Ideal Maximal Out−Degree: Node−Rank−Based Geodesic Closeness Ideal Cut Ohmic Closeness Ideal Cut ● ● ● ● ● ● ● ● ● ● ● ● ● ● ● ● ● ● ● ● ● ● ● ● ● ● ● ● ● ● ● ● ● ● ● ● ● ● ● ● ● ● ● ● ● ● ● ● ● ● ● ● ● ● ● ● ● ● ● ● ● ● ● ● ● ● ● ● ● ● ● ● ● ● ● ● ● ● ● ● ● ● ● ● ● ● ● ● ● ● ● ● ● ● ● ● ● ● ● ● ● ● ● ● ● ● ● ● ● ● ● ● ● ● ● ● ● ● ● ● ● ● ● ● ● ● ● ● ● ● ● ● ● ● ● ● ● ● ● ● ● ● ● ● ● ● ● ● ● ● ● ● ● ● ● ● ● ● ● ● ● ● ● ● ● ● ● ● ● ● ● ● ● ● ● ● ● ● ● ● ● ● ● 0.5 1.0 2.0 5.0 10.0 20.0 50.0 200.0 0.5 1.0 2.0 5.0 20.0 50.0 200.0 Ideal Maximal Out−Degree: Node−Rank−Based Ohmic Closeness Ideal Cut Ohmic Betweenness Ideal Cut ● ● ● ● ● ● ● ● ● ● ● ● ● ● ● ● ● ● ● ● ● ● ● ● ● ● ● ● ● ● ● ● ● ● ● ● ● ● ● ● ● ● ● ● ● ● ● ● ● ● ● ● ● ● ● ● ● ● ● ● ● ● ● ● ● ● ● ● ● ● ● ● ● ● ● ● ● ● ● ● ● ● ● ● ● ● ● ● ● ● ● ● ● ● ● ● ● ● ● ● ● ● ● ● ● ● ● ● ● ● ● ● ● ● ● ● ● ● ● ● ● ● ● ● ● ● ● ● ● ● ● ● ● ● ● ● ● ● ● ● ● ● ● ● ● ● ● ● ● ● ● ● ● ● ● ● ● ● ● ● ● ● ● ● ● ● ● ● ● ● ● ● ● ● ● ● ● ● ● ● ● ● ● 0.5 1.0 2.0 5.0 10.0 20.0 50.0 200.0 0.5 1.0 2.0 5.0 20.0 50.0 200.0 Ideal Maximal Out−Degree: Value−Based Geodesic Closeness Ideal Cut Ohmic Closeness Ideal Cut Figure 1: T op: Scatterplots of ideal threshold p oin ts based on rank discrepancy statistics for harmonic geo desic cen trality , Ohmic closeness and Ohmic b et w eenness. Note the separation of ideal cuts based on netw ork size; blac k, red, blue represent net works of size 50, 100 and 200 resp ectiv ely . Bottom, scatterplots of ideal threshold p oints based on direct v alue comparison for geo desic and Ohmic closeness. There is separation of the optimal cut p oin t based on netw ork size for Ohmic closeness, though not for geo desic closeness, suggesting that higher tie densities are required to fully capture the essence of multiple paths that is captured in Ohmic statistics. 6 3.1 Results on Simulated Data Figure 1 shows the ideal cutp oints for a series of 183 graphical families with v arying character- istics. F or rank statistics, once again there is a general agreement on the ideal cutp oint b y rank discrepancies, as most v alues lie on the diagonal of equality; note once again that in sev eral cases in the first diagram, higher outdegree maxima are required for Ohmic statistics to be satisfied. In all cases, there is a strong effect of netw ork size on the ideal outdegree; restated, ho w ever, this suggests that the ideal density (edges ov er total edges, n ( n − 1) / 2) is roughly iden tical for eac h netw ork size in the Ohmic family of statistics. This is not the case for geo desic statistics, ho w ever, as there is a strong v ariability on the ideal outdegree, namely for v alue-based statistics. The maximum, ho wev er, does app ear to scale with netw ork size in this case. Figure 2 details the optimal maximal outdegrees for diameter when dividing the cases by generativ e parameter. In this case, t wo inputs prov ed to show the most discrimination b etw een optima: heterogeneity on degree and net work size. First, there is a preference for denser graphs for the geo desic case, and not the Ohmic, the opp osite scenario when considering closeness statistics. Additionally , it is the more heterogeneous cases that drive this b eha viour; m uch greater inclusion is necessary as heterogeneity increases b eyond σ α = 4. This b ehaviour is indep endent of netw ork size, as the extreme v alues are presen t for geo desic diameter at each c hoice of size. 3.2 Results on Real Data Examples This metho d of dichotomization w as c hosen largely as a conv enien t alternative to the straight thresholding metho d, but its v alue is b est prov en on examples of real data that may need the metho d to b e analyzed. In particular, we consider tw o data sets: • The EIES electronic comm unications data of F reeman and F reeman [1980], in which arcs from one of 32 individuals to another is a message coun t. There are many arcs with v alue equal to zero. • The fMRI brain-w av e data of Ac hard et al. [2006] in whic h the 90 no des corresp ond to brain regions and the edges are, essentially , partial correlations of signals. In contrast, there are no zero es in this data if we consider (for demonstration’s sake) the partial correlations to b e without error. The results for the straight thresholding pro cedure w ere presen ted graphically in Thomas and Blitzstein [2010b]. As table 2 sho ws for the results for the EIES data, straight thresholding is preferred hands do wn; fix of the seven test statistics are significan tly smaller under thresholding than censoring 1 In brief: for all pairs of no des ( a, b ), a fixed p o w er of 1 W att is applied across the terminals corresp onding to the no des, which hav e an Ohmic in verse distance G eg ab . The measured current through node i , P j 6 = i I ab ij determines the importance of the node to curren t flo w b etw een a and b . 7 ● ● ● ● ● ● ● ● ● ● ● ● ● ● ● ● 0.1 0.4 1 4 10 100 0.5 2.0 5.0 20.0 100.0 Ideal Arcs Per Node by Node Heterogeneity: Geodesic Diameter Heterogeneity Ideal Arcs Per Node ● ● ● ● ● ● ● ● ● ● ● ● ● ● ● ● ● 0.1 0.4 1 4 10 100 0.5 2.0 5.0 20.0 100.0 Ideal Arcs Per Node by Node Heterogeneity: Ohmic Diameter Heterogeneity Ideal Arcs Per Node ● ● ● ● ● ● ● ● ● ● ● ● ● ● ● ● ● ● ● ● ● ● ● ● ● ● ● ● ● ● ● ● ● ● ● ● ● ● ● ● ● ● ● ● ● ● ● ● ● ● ● ● ● ● ● ● ● ● ● ● ● ● ● ● ● ● ● ● ● ● ● ● ● ● ● ● ● ● ● ● ● ● ● ● ● ● ● ● ● ● ● ● ● ● ● ● ● ● ● ● ● ● ● ● ● ● ● ● ● ● ● ● ● ● ● ● ● ● ● ● ● ● ● ● ● ● ● ● ● ● ● ● ● ● ● ● ● ● ● ● ● ● ● ● ● ● ● ● ● ● ● ● ● ● ● ● ● ● ● ● ● ● ● ● ● ● ● ● ● ● ● ● ● ● ● ● ● ● ● ● ● ● ● 50 100 150 200 0.5 2.0 5.0 20.0 100.0 Ideal Arcs Per Node by Network Size: Geodesic Diameter Network Size Ideal Arcs Per Node ● ● ● ● ● ● ● ● ● ● ● ● ● ● ● ● ● ● ● ● ● ● ● ● ● ● ● ● ● ● ● ● ● ● ● ● ● ● ● ● ● ● ● ● ● ● ● ● ● ● ● ● ● ● ● ● ● ● ● ● ● ● ● ● ● ● ● ● ● ● ● ● ● ● ● ● ● ● ● ● ● ● ● ● ● ● ● ● ● ● ● ● ● ● ● ● ● ● ● ● ● ● ● ● ● ● ● ● ● ● ● ● ● ● ● ● ● ● ● ● ● ● ● ● ● ● ● ● ● ● ● ● ● ● ● ● ● ● ● ● ● ● ● ● ● ● ● ● ● ● ● ● ● ● ● ● ● ● ● ● ● ● ● ● ● ● ● ● ● ● ● ● ● ● ● ● ● ● ● ● ● ● ● 50 100 150 200 0.5 2.0 5.0 20.0 100.0 Ideal Arcs Per Node by Network Size: Ohmic Diameter Network Size Ideal Arcs Per Node Figure 2: A comparison of the ideal arcs-p er-no de for the geo desic and Ohmic diameters, as plotted b y no de heterogeneity and netw ork size resp ectively . F or cases of extreme no dal heterogeneit y , geo desic diameter is optimized at muc h higher out-degree than in the Ohmic case. Similarly , when plotting outcomes as a function of net w ork size, there are far more p oints of geo desic optimality that lie at the extremes (av erage outdegree, (0.5, 1.0, 1.5) as well as around N/2) as opp osed to Ohmic distance measures. 8 F reeman-F reeman EIES Thresholding Thresholding Censoring Censoring Measure Arcs/No de Optim um Optim um Outdegree Geo desic Centralit y Rank 6 24.5 51.97 18 Ohmic Centralit y Rank 7 7.79 35.69 24+ Ohmic Betw eenness Rank 17 6.445 7.807 24+ Geo desic Centralit y V alue 6 6715 18160 24+ Ohmic Centralit y V alue 11 16480 59530 11 Geo desic Diameter 15 0.09056 0.942 10 Ohmic Diameter 17 0.4646 0.4131 12 T able 2: Comparing the optimal dichotomizations for the 32-no de EIES net work [F reeman and F reeman, 1980] under straigh t thresholding and the delib erate censoring of outdegree. In five of the seven netw ork measures, the thresholding metho d is far sup erior at conserving the prop erty from the v alued graph; the diameter measures yield essentially iden tical results. Ac hard Brain wa v e Thresholding Thresholding Censoring Censoring Measure Arcs/No de Optimum Optim um Outdegree Geo desic Centralit y Rank 14.72 149.5 372.1 18.4 Ohmic Centralit y Rank 22.2 132.8 278.5 20 Ohmic Betw eenness Rank 22.2 251.9 386.8 27.7 Geo desic Centralit y V alue 80+ 0.3587 0.3609 81 Ohmic Centralit y V alue 80+ 41.37 39.67 81 Geo desic Diameter 33.4 0.018 0.013 18.4 Ohmic Diameter 68.8 0.069 0.126 54.3 T able 3: Comparing the optimal dichotomizations for the 90-node Ac hard brain netw ork [Ac hard et al., 2006] under straigh t thresholding and the delib erate censoring of outdegree. In the no dal rank measures, the straight thresholding dominates the censoring by outdegree; eac h metho d is sup erior at one t yp e of diameter but not the other. The measures on cen trality v alues, how ev er, are largely ignorable, as b oth insist on netw orks that are essen tially complete. Note that the statistics are not comparable b et w een the EIES and Achard examples, as the scales for eac h measure v ary b oth with the underlying netw ork size and the relativ e tie scales. 9 at their ideal lev els, and the sev enth (Ohmic diameter) is on roughly the same scale. This is lik ely b ecause the EIES data are extremely heterogeneous in p opularit y/gregariousness – some individuals sen t far more communications than others, to a wider v ariet y of p eople – which is more sensitiv e to raw censoring than ra w thresholding in the case of the most central individuals. F or the Ac hard data, the solution is less clear. The rank-based criteria fa vour the thresholded v ersion; the diameters each prefer one metho d or the other; and the v alue-based statistics b oth essen tially suggest a nearly complete graph, the act of censoring on outdegree ma y app ear similar to the act of thresholding, at least from the p oin t of view of the outdegree on each no de. Still, the notion that an already questionable pro cedure in thresholding pro duces a b etter result than outdegree censoring in sev eral cases is notew orthy . 4 Effect on Linear Mo dels W e turn now to the use of the dic hotomized graph as the measurer of con tagion in a tw o-time-step linear mo del framework. F or the sake of demonstration we use the same linear mo del form ulation as was used in the thresholding analysis of Thomas and Blitzstein [2010b], Y i 1 = µ + γ Y i 0 + β X j X ij 0 Y j 0 + ε i 1 , so that the mo del is generated by the original v alued graph and estimated using either the v alued or degree-censored cases. The p erformance in estimating the contagion effect β is measured b y taking the mean squared error of the estimates against the generated v alue. Figure 3 sho ws a single instance of censoring b y outdegree for a linear model at v arious maximal outdegrees for the net work parameter β . The example in this case has a negligible correlation b et w een no dal indegree and past property v alue, and while the v alue at one out-arc per no de is inconsisten t with the true generative parameter, man y of the rest come quite close in their estimates adjusted for scale. Still, the inflation in the estimate’s mean squared error is noticeably large, 100 times larger than the (true) v alued case. In the aggregate, ho w ever, the same issues p ersist in this compression mo de: estimates for β are highly inflated in absolute v alue under most conditions, as seen in Figure 4 and as was observ ed in the thresholding case. When considering aggregate loss of efficiency in terms of mean squared error ratio for β , the same susp ect app ears to b e the most discriminating. Heterogeneit y by no de p opularity is easily the most influential in determining the inefficiency in these estimates, as sho wn in Figure 5. Even small differen tiation provides a ma jor shift in precision, with a rough increase in scale of e 5 ≈ 150 times the mean squared error in the v alued case. None of the other generative parameters ha ve this level of influence on the efficiency of the censoring-based estimation. 10 Tie Coefficients by Outdegree Outdegree (before symmetrization) Coefficient Size 0.5 1 1.5 2 2.5 3 3.5 4 4.5 5 5.5 9.8 14 16 18 20 23 25 26 28 30 32 34 36 38 40 42 45 −0.7 −0.6 −0.5 −0.4 −0.3 −0.2 −0.1 0.0 ● ● ● ● ● ● ● ● ● ● ● ● ● ● ● ● ● ● ● ● ● ● ● ● ● ● ● ● ● ● Normalized Tie Coefficients by Outdegree Outdegree (before symmetrization) Normalized Coefficient 0.5 1 1.5 2 2.5 3 3.5 4 4.5 5 5.5 9.8 14 16 18 20 23 25 26 28 30 32 34 36 38 40 42 45 −0.15 −0.10 −0.05 0.00 ● ● ● ● ● ● ● ● ● ● ● ● ● ● ● ● ● ● ● ● ● ● ● ● ● ● ● ● ● ● ● Log Mean Squared Error: network beta = −0.0777, degree−prior correlation = 0.00904 Outdegree (before symmetrization) log MLE 0.5 1 1.5 2 2.5 3 3.5 4 4.5 5 5.5 9.8 14 16 18 20 23 25 26 28 30 32 34 36 38 40 42 45 1e−06 5e−06 5e−05 5e−04 5e−03 ● ● ● ● ● ● ● ● ● ● ● ● ● ● ● ● ● ● ● ● ● ● ● ● ● ● ● ● ● ● ● Figure 3: A censoring profile for a single v alued graph, where directed ties hav e b een symmetrized. In the b est case, the mean squared error is 100 times larger for a dichotomized netw ork than the v alued case. 11 Figure 4: The t -statistics for the estimates of the auto correlation term β , with resp ect to the true generated v alue. By conditioning on the true v alue, it b ecomes clear that the estimates are inflated in magnitude with resp ect to the truth. 5 Conclusions The preceding inv estigation of delib erate censoring is worth while, in that it shows censoring by outdegree app ears to b e just as lossy for net w ork compression as thresholding, ev en when c hanges of scale are factored in. How ever, this in itself is not the end of the story; while b oth censoring and thresholding are metho ds that can b e used to construct binary approximations to v alued graphs, minimizing a c hosen statistic is an approac h that transcends b oth censoring and thresholding. In particular, the ideal solution to the dic hotomization issue would b e to searc h the space of all 2 n ( n − 1) binary graphs and select the graph that best appro ximates the v alued graph. In this wa y , b oth thresholding and censoring pro duce excellen t starting p oints for randomized searc hes and hill-clim bing approac hes. In b oth inv estigations, the biggest factor for information loss is the heterogeneity of no de p opularit y . Since this factor affects b oth the n umber and strength of nonzero edges, it is entirely lik ely that the distortion is due to one or b oth of these effects. A generativ e mo del that could in v estigate this trend w ould do w ell to separate the tw o in some wa y . In particular, consider the situation where one p erson has to divide the hours in a da y b et w een the people in the rest of the so cial environmen t. The outcome here would stretch b et w een t w o alternativ es: many shallo w in teractions (casual friends) and one strong in teraction (a b est friend or partner). Incorp orating this in to a mo del places emphasis on v ariabilit y ov er mean v alue. A plausible mec hanism to generate this scenario would incorp orate this heterogeneity in to v ariabilit y , suc h as in the normal form 12 0 10 20 30 40 0.00 0.01 0.02 0.03 0.04 0.05 0.06 Kernel Density Plot: log(MSE) Difference by Network Size log(MSE) Difference Density 100 200 50 300 400 500 600 0 10 20 30 40 0.00 0.02 0.04 0.06 0.08 0.10 Kernel Density Plot: log(MSE) Difference by Heterogeneity log(MSE) Difference Density 0.1 0.4 100 10 1 4 0 10 20 30 40 0.00 0.01 0.02 0.03 0.04 0.05 Kernel Density Plot: log(MSE) Difference by Assortativity log(MSE) Difference Density −0.5 0.5 0 0 10 20 30 40 0.00 0.01 0.02 0.03 0.04 0.05 0.06 Kernel Density Plot: log(MSE) Difference by Geometry log(MSE) Difference Density Low Gaussian High Strong Clusters Low Ring Low Strong Clusters Low Repulsive High Ring High Repulsive None High Gaussian Figure 5: Scatterplot and densit y plot of the minimal mean squared error ratio for thresholding tests. The x-axis of the scatterplot is the generated correlation b etw een indegree and the prior outcome v alue, and no effect is visible. 13 Z ij = µ + ε ij ; (2) ε ij ∼ N (0 , α i α j ); (3) α i ∼ 1 c Gamma ( c ) , (4) whic h has ha ve t w o driving parameters µ and ε , though the first w ould be, in this proposal, uniform across all edges. That said, the main ob jection remains: there is still a considerable loss of information, and an in tro duction of bias, that tak es place when this op eration is conducted. With any loss of statistical p ow er, it still cannot b e guaranteed that a compressed graph structure will pro duce estimates with the correct cov erage prop erties, considerably jeopardizing the scientific v alue of the particular inv estigation. References A chard, S. , Sal v ador, R. , Whitcher, B. , Suckling, J. and Bullmore, E. (2006). A Re- silien t, Low-F requency , Small-W orld Human Brain F unctional Netw ork with Highly Connected Asso ciation Cortical Hubs. The Journal of Neur oscienc e , 26 63–72. URL http://www.jneurosci.org/cgi/content/full/26/1/63 . Brandes, U. and Fleischer, D. (2005). Cen trality Measures Based on Curren t Flow. In 22nd Symp osium on The or etic al Asp e cts of Computer Scienc e (ST ACS05) . 533544. Freeman, L. and Freeman, S. (1980). A Semi-Visible College: Structural Effects on a So cial Net w orks Group. In Ele ctr onic Communic ation: T e chnolo gy and Imp acts . W estview Press, 77– 85. Freeman, L. C. (1979). Cen tralit y In So cial Netw orks: Conceptual Clarification. So cial Networks , 1 215–239. Grano vetter, M. (1973). The Strength of W eak Ties. A meric an Journal of So ciolo gy , 78 1360–1380. Klein, D. and Randic, M. (1993). Resistance distance. Journal of Mathematic al Chemistry , 12 81–95. Newman, M. (2005). A Measure of Bet weenness Centralit y Based on Random W alks. So cial Networks , 27 3954. 14 Thomas, A. C. (2009). Ohmic Circuit In terpretations of Net w ork Distance and Cen tralit y. Unpublished manuscript., URL http://www.acthomas.ca/academic/relational.htm . Thomas, A. C. (2010). Censoring Outdegree Compromises Inferences of Social Net w ork P eer Effects and Autocorrelation. Submitted to So ciological Metho dology , URL . Thomas, A. C. and Blitzstein, J. K. (2010a). Marginally Sp ecified Hierarchical Mo dels for Relational Data. Unpublished man uscript, URL http://www.acthomas.ca/papers/a- framework- for- modelling.pdf . Thomas, A. C. and Blitzstein, J. K. (2010b). V alued Ties T ell F ew er Lies: Why Not T o Dic hotomize Net w ork Edges With Thresholds. Submitted to Annals of Applied Statistics. 15
Original Paper
Loading high-quality paper...
Comments & Academic Discussion
Loading comments...
Leave a Comment