A Predictive Framework for Cyber Security Analytics using Attack Graphs
Security metrics serve as a powerful tool for organizations to understand the effectiveness of protecting computer networks. However majority of these measurement techniques don’t adequately help corporations to make informed risk management decisions. In this paper we present a stochastic security framework for obtaining quantitative measures of security by taking into account the dynamic attributes associated with vulnerabilities that can change over time. Our model is novel as existing research in attack graph analysis do not consider the temporal aspects associated with the vulnerabilities, such as the availability of exploits and patches which can affect the overall network security based on how the vulnerabilities are interconnected and leveraged to compromise the system. In order to have a more realistic representation of how the security state of the network would vary over time, a nonhomogeneous model is developed which incorporates a time dependent covariate, namely the vulnerability age. The daily transition-probability matrices are estimated using Frei’s Vulnerability Lifecycle model. We also leverage the trusted CVSS metric domain to analyze how the total exploitability and impact measures evolve over a time period for a given network.
💡 Research Summary
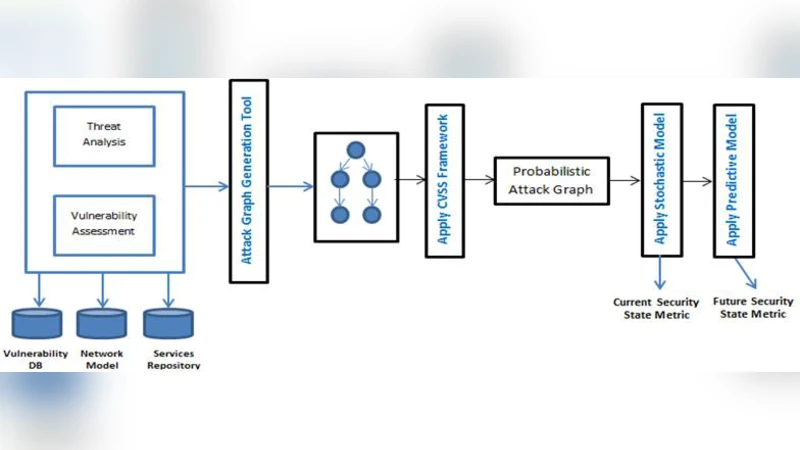
The paper addresses a critical gap in cyber‑risk assessment: most existing security metrics and attack‑graph analyses treat vulnerabilities as static objects, ignoring how their exploitability and mitigations evolve over time. To overcome this limitation, the authors propose a stochastic, time‑varying security framework that integrates vulnerability age, exploit availability, and patch deployment into a non‑homogeneous Markov model. The core idea is to treat each node in an attack graph as a state whose transition probabilities change daily according to the vulnerability’s lifecycle.
Frei’s Vulnerability Lifecycle model supplies the time‑dependent probability that an exploit exists or a patch has been applied for a given vulnerability. These probabilities are combined with the CVSS base‑score components: the Exploitability sub‑score (reflecting access vector, complexity, and privileges required) and the Impact sub‑score (quantifying confidentiality, integrity, and availability loss). By mapping the Exploitability sub‑score to a dynamic transition weight and the Impact sub‑score to a loss function, the framework can compute both the likelihood of an attacker reaching a critical asset and the expected monetary or operational loss at any future date.
Methodologically, the authors first construct an attack graph for a realistic enterprise network (≈150 hosts, ≈200 vulnerabilities) using standard tools and enrich each node with CVSS data, disclosure dates, and patch dates sourced from NVD and internal patch‑management logs. For each day t, a transition matrix P(t) is generated: Pij(t)=Pr(state i→state j at day t) = f_exploit(age_i, t)·w_ij, where f_exploit is derived from the beta‑distribution parameters of Frei’s model and w_ij encodes the structural connectivity of the graph. The initial state vector s0 represents the probability distribution of an attacker’s foothold. The system evolves as s_{t+1}=s_t·P(t), and the cumulative probability of reaching the target node is tracked over a planning horizon of several months. Simultaneously, the expected loss E
Comments & Academic Discussion
Loading comments...
Leave a Comment