Prioritizing the Components of Vulnerability in a Genetic Algorithms Minimization of Flood Risk
We compare two prioritization schemes for the components of flooding vulnerability: urbanized area ration, literacy rate, mortality rate, poverty, radio/tv penetration, non-structural measures and structural measure. We prioritize the components, giving each a weight. We then express the vulnerability function as a weighted sum of its components. This weighted sum serves as the fitness function in a genetic algorithm, which comes up with the optimal design for a flood-resistant city.
💡 Research Summary
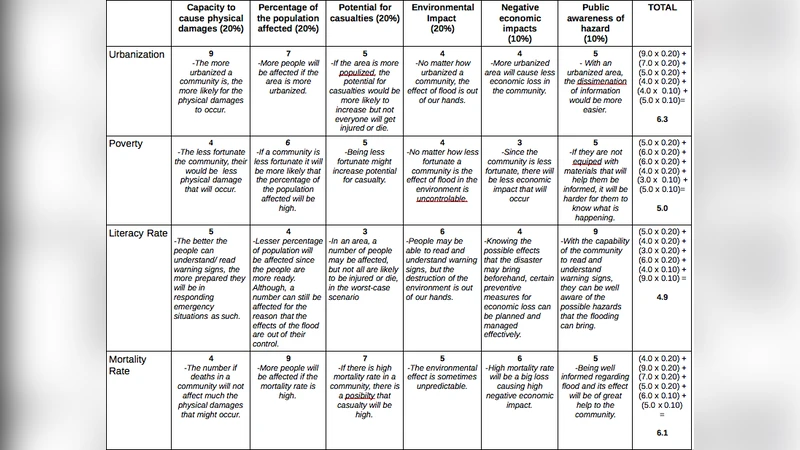
The paper addresses the growing challenge of flood risk in rapidly urbanizing regions by proposing a systematic method to prioritize vulnerability components and integrate them into a genetic algorithm (GA) for optimal city design. The authors identify seven key indicators that together capture the socio‑economic and infrastructural dimensions of flood vulnerability: (1) urbanized area ratio, (2) literacy rate, (3) mortality rate, (4) poverty rate, (5) radio/television penetration, (6) non‑structural measures (education, awareness, evacuation drills), and (7) structural measures (levees, pumps, drainage networks).
Two distinct weighting schemes are developed to reflect different philosophies of importance assignment. The first scheme relies on expert judgment: a panel of thirty professionals (urban planners, hydrologists, disaster managers) rates each indicator on a five‑point scale, and the normalized scores become the weights. The second scheme is data‑driven: the authors compute Pearson correlation coefficients between each indicator and historical flood loss metrics (monetary damage, fatalities) and then perform a multiple regression analysis. The resulting regression coefficients are normalized to serve as objective weights. Sensitivity analysis is also conducted to gauge how variations in each indicator affect the overall vulnerability score.
With weights (w_i) and normalized indicator values (x_i), the vulnerability function is defined as a simple weighted sum (V = \sum_{i=1}^{7} w_i x_i). This scalar function is used directly as the fitness function in a GA that searches for the optimal configuration of flood mitigation measures. The decision variables encoded in the GA chromosome include (a) the scale of drainage network expansion, (b) the location and capacity of structural defenses (levees, pumps), and (c) the allocation of budget to non‑structural programs (public education, early‑warning systems). The GA parameters are set to a population size of 200, a crossover probability of 0.7, a mutation probability of 0.01, and a maximum of 500 generations, with early stopping after 20 generations of negligible improvement.
Empirical testing is performed on a case study city in South Korea, using district‑level statistics from national censuses and a ten‑year record of flood events. All indicators are normalized to the interval
Comments & Academic Discussion
Loading comments...
Leave a Comment