Multiscale statistical testing for connectome-wide association studies in fMRI
Alterations in brain connectivity have been associated with a variety of clinical disorders using functional magnetic resonance imaging (fMRI). We investigated empirically how the number of brain parcels (or scale) impacted the results of a mass univ…
Authors: P. Bellec, Y. Benhajali, F. Carbonell
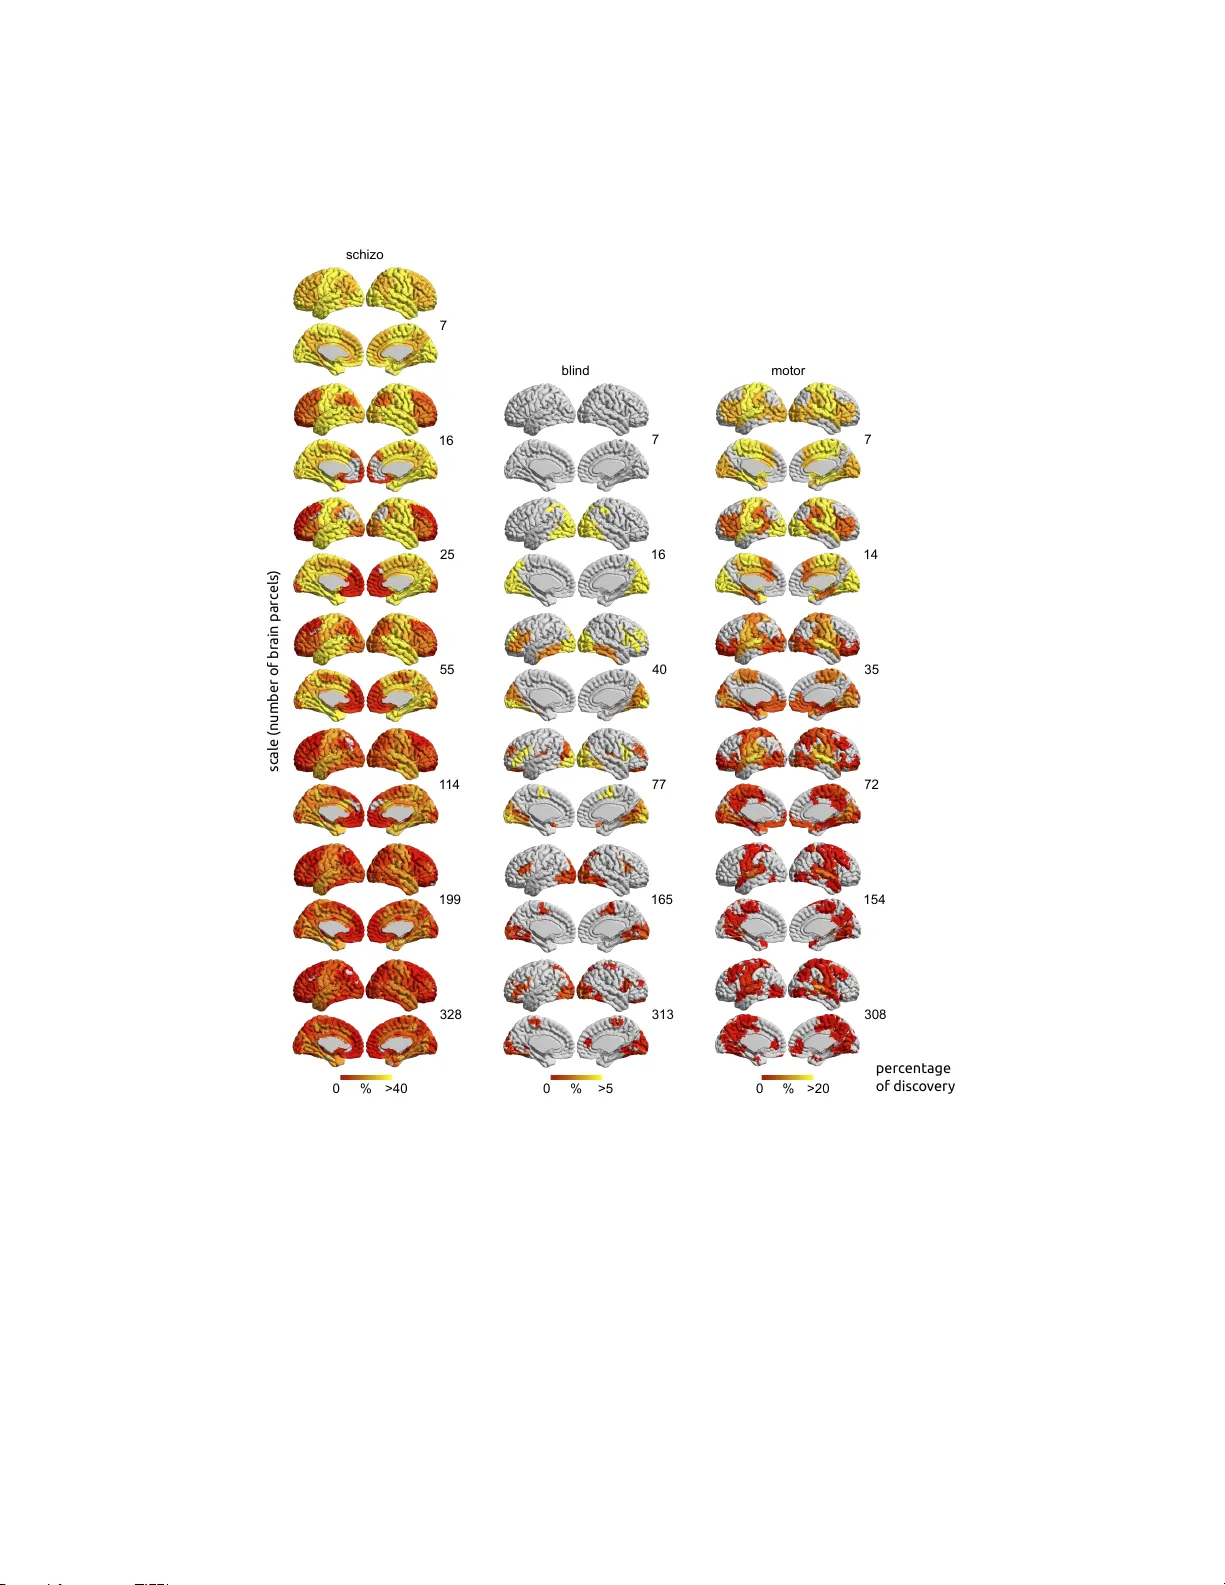
Multiscale statistical testing for connectome-wide asso ciation studies in fMRI Pierre Bellec a,b, ∗ , Y assine Benha jali a,c , F elix Carb onell d , Christian Dansereau a,b , Genevi ` ev e Alb ouy a,e , Maxime P elland e , Cameron Craddo c k f,g , Olivier Collignon e , Julien Do y on a,e , Emman uel Stip h,i , Pierre Orban a,h a F unctional Neur oimaging Unit, Centr e de R e cher che de l’Institut Universitair e de G´ eriatrie de Montr´ eal b Dep artment of Computer Scienc e and Op er ations R ese arch, University of Montr eal, Montr e al, Queb e c, Canada c Dep artment of Anthr op olo gy, University of Montr eal, Montr e al, Quebe c, Canada d Biosp e ctive Inc orp or ate d, Mo ntr e al, Queb e c, Canada e Dep artment of Psycholo gy, University of Montr e al, Montr e al, Queb e c, Canada f Nathan Kline Institute for Psychiatric R ese ar ch, Or angebur g, NY, Unite d States of Americ a g Center for the Developing Br ain, Child Mind Institute, New Y ork, NY, United States of Americ a h Dep artment of Psychiatry, University of Montr e al, Montr e al, Queb ec, Canada i Centr e Hospitalier de l’Universit´ e de Montr´ eal, Montr e al, Queb e c, Canada Abstract Alterations in brain connectivity hav e b een asso ciated with a v ariet y of clinical disorders using functional magnetic resonance imaging (fMRI). W e in vestigated empirically how the num b er of brain parcels (or scale) impacted the results of a mass univ ariate general linear mo del (GLM) on connectomes. The brain parcels used as no des in the connectome analysis w ere functionnally defined by a group cluster analysis. W e first v alidated that a classic Benjamini-Hoch b erg pro cedure with parametric GLM tests did con trol appropriately the false-disco very rate (FDR) at a given scale. W e then observ ed on realistic simulations that there w as no substan tial inflation of the FDR across scales, as long as the FDR was con trolled indep enden tly within eac h scale, and the presence of true associations could be established using an omnibus p erm utation test com bining all scales. Second, w e observed b oth on simulations and on three real resting-state fMRI datasets (schizophrenia, congenital blindness, motor practice) that the rate of disco very v aried markedly as a function of scales, and was relatively higher for lo w scales, below 25. Despite the differences in discov ery rate, the statistical maps derived at different scales were generally very consistent in the three real datasets. Some seeds still show ed effects b etter observed around 50, illustrating the p oten tial benefits of multiscale analysis. On real data, the statistical maps ∗ Corresponding author Email addr ess: pierre.bellec@criugm.qc.ca (Pierre Bellec) Pr eprint submitte d to Neur oimage Septemb er 2, 2021 agreed well with the existing literature. Overall, our results supp ort that the m ultiscale GLM connectome analysis with FDR is statistically v alid and can capture biologically meaningful effects in a v ariet y of exp erimental conditions. Keywor ds: fmri, general linear mo del, functional brain parcellation, multiple comparison, false disco v ery rate, multiscale analysis, connectome Highligh ts • A mass-univ ariate GLM analysis on connectomes was estimated m ultiple times using functional brain parcellations at differen t scales. • A new omnibus test p ooling GLM discov eries across all scales. • On sim ulations, the FDR was controlled within scale and, in the presence of a significan t omnibus test, no mark ed inflation of the FDR w as observ ed across scales. • On three real datasets, the statistical asso ciation maps generated at dif- feren t scales were mostly consistent. • In all exp erimen ts, the highest disco very rates were found b elow scale 25, y et some effects were b etter seen around scale 50. 1. In tro duction Context. Brain connectivity in resting-state fMRI has b een found to b e asso ci- ated with a wide v ariet y of clinical disorders (F o x and Greicius, 2010; Castellanos et al., 2013; Barkhof et al., 2014). Rather than fo cusing on a limited set of a priori regions of in terest, a recen t trend is to p erform statistical tests of as- so ciation across the whole connectome, i.e. at every p ossible brain connection (Shehzad et al., 2014). Such connectome-wide asso ciation studies (CW AS) crit- ically dep end on the c hoice of the brain parcels that are used to estimate the connections. Analysis ha ve b een p erformed at different sc ales in the literature (Mesk aldji et al., 2013), e.g. v oxels (Shehzad et al., 2014), regions (W ang et al., 2007), or distributed netw orks (Jafri et al., 2008; Marrelec et al., 2008). The main ob jective of this work was to develop a statistical framework to study the impact of the spatial scale on the results of a CW AS. Mass-univariate c onne ctome-wide asso ciation studies. The mass-univ ariate ap- proac h to CW AS (W orsley et al., 1998) consists of indep enden tly estimating a GLM at every connection. In the GLM, a series of equations are solved to find a linear mixture of explanatory v ariables (called co v ariates) that b est fit the connectivit y v alues observ ed across the many sub jects. A p v alue is generated for each connection to quan tify the probability that the estimated strength of asso ciation betw een this connection and a co v ariate of in terest could ha v e arisen randomly in the absence of a true asso ciation (W orsley and F riston, 1995). The 2 significance lev el of eac h test needs to b e corrected for the total n um b er of tests, i.e. the num b er of brain connections, e.g. using random field theory (W orsley et al., 1998) or FDR (Benjamini and Ho c h b erg, 1995). Correction for mul- tiple comparisons ho wev er generally comes at the cost of a sharp decrease in sensitivit y . Multisc ale p ar c el lations and testing. A straightforw ard wa y to mitigate the im- pact of multiple comparisons on statistical p ow er is to reduce the num b er of brain parcels. F or example, the AAL template (Tzourio-Mazoy er et al., 2002) includes 116 brain parcels based on anatomical landmarks. Data-driven algo- rtihms can also generate functional brain parcels (Bellec et al., 2006; Thirion et al., 2006; Craddo c k et al., 2012; Blumensath et al., 2013; Thirion et al., 2014; Gordon et al., 2014). F ew inv estigators hav e examined ho w scale impacts the results of a GLM-connectome analysis. Ab ou Elseoud et al. (2011) explored the impact of the num b er of comp onen ts in a dual-regression indep endent comp o- nen t analysis on the difference b et w een patients suffering from non-medicated seasonal affectiv e disorder and normal healthy controls. The authors concluded that the num b er of significan t findings was maximized at scale 45 (in this case, 45 indep enden t comp onents). The impact of the n umber of brain parcels w as also in vestigated using spatially-constrained sp ectral clustering (Craddo ck et al., 2012) at muc h higher scales (from 50 to 3000+) b y Shehzad et al. (2014). The authors concluded that the asso ciation b et ween resting-state connectivity and in telligence quotient w as consisten t across scales. It should b e noted that, in the ab o ve-men tioned studies (Ab ou Elseoud et al., 2011; Shehzad et al., 2014), the authors did not inv estigate the implications that the replication of statistical tests at m ultiple scales may hav e in terms of the control of false p ositiv es. W e are th us not curren tly aw are of a v alid statistical framework to examine the results of a CW AS with data-driven brain parcellations at multiple scales. Main obje ctives. In this pap er, we dev elopp ed a new metho d to explore m ul- tiscale statistical parametric connectome (MSPC). Multiscale functional brain parcellations and asso ciated connectomes were first generated using a group cluster analysis (Bellec et al., 2010; Bellec, 2013). A GLM was then applied on the connectomes and the FDR w as controlled at eac h scale indep enden tly (Benjamini and Ho c hberg, 1995). W e developed an omnibus test to assess the significance of the n umber discov eries, p o oled across all scales. Our first ob jec- tiv e w as to empirically assess if the FDR was well controlled within scale, and, when the omnibus test was rejected, across scales as w ell. Our second ob jectiv e w as to ev aluate ho w the scale impacted the results of a MSPC in terms of the n umber and nature of the discov eries. In particular, w e w anted to chec k if dif- feren t scales would bring complemen tary and biologically plausible insights in the results of the GLM. W e conducted a series of experiments inv olving b oth sim ulated and real datasets to address these t wo ob jectiv es, whic h ha ve b een summarized, along with the main findings, in T able 1. Simulations. W e generated several simulation datasets. A first set of exp er- imen ts inv olved independent tests on purely synthetic data. A second set of 3 exp erimen ts were based on a mixture of real fMRI data with synthetic signal, in order to introduce realistic dep endencies b et ween tests, b oth within and across scales. W e simulated group differences using a v ariety of scenarios cov ering dif- feren t combinations of effect and sample sizes as well as differen t prop ortions of true non-n ull h yp othesis. As part of the sim ulation study , w e also applied MSPC on real fMRI datasets (the Cambridge sample) using random group differences, th us pro viding insigh ts in the b eha viour of the metho d under the global n ull h yp othesis, where there is no true asso ciation to find. R e al datasets. W e ev aluated the MSPC on three real datasets: (1) a study comparing patients suffering from sc hizophrenia with health y con trol sub jects (referred to here as the SCHIZO study , with a large sample size, n = 146); (2) a study on patien ts suffering of congenital blindness, compared to sigh ted con trols (referred to here as the BLIND study , with a small sample size, n = 31), and; (3) a study of motor learning, where resting-state data connectivity was compared b efore and after learning of a motor task (referred to here as the MOTOR study , with a mo derate sample size, n = 54). These three datasets were c hosen to assess ho w the scale impacted the results of the MSPC with a v ariety of effect and sample sizes. W e had strong a priori hypotheses for those three analyses: c hanges in the visual netw ork for the BLIND dataset, in the motor netw ork for the MOTOR dataset and a more general dysconnectivity in the SCHIZO dataset. These a priori w ere useful to assess the biological plausibilit y of the findings. W e c heck ed the assumptions of the parametric GLM estimation, to further v alidate the sp ecificit y of the MSPC approach. W e finally quantified similarities and differences of the MSPC findings across scales. 4 Sp ecific ob jectiv es Exp erimen t(s) Finding(s) Chec k the assumptions of the paramet- ric GLM tests and the FDR-BH algo- rithm, within scales. Assumptions of the GLM were tested on four real data samples at high scales (300+). Sim ulations of group differ- ences at multiple scales with tests fea- turing realistic dep endencies. Although trends of departure from normality and homoscedastic- it y were observed, no tests passed significance (Section 5.2). In the sim ulations with dependent tests, p oten tial departures from the assumptions of the GLM of FDR-BH did not compromise the sp ecificit y of the FDR-BH pro cedure (Figure 5). Assess the sp ecificit y of MSPC in the absence of signal (“global n ull”). T est for differences in av erage connec- tivit y betw een random subgroups of the Cam bridge sample. The FWE under the global n ull w as controlled at nominal level b y the m ultiscale omnibus test (Figure 5). Assess the sp ecificity of MSPC within and across scales. Multiscale sim ulation of group differ- ences with indep endent or dependent tests. The FDR w as controlled at nominal level or b elo w within scale (Figures 3, 5). The FDR across scales was controlled in most realistic simulations, and slightly lib eral (effective FDR of 0.09 for a nominal lev el of 0.05) in the w orst-case scenario, otherwise featuring sensitivity close to zero at high scales (Figures 5 and 6). Assess the sensitivity of MSPC across scales. Same as ab o ve. The sensitivit y v aried substantially across scales. This seemed to reflect at least tw o phenomena: (1) an intrinsic property of the FDR-BH pro cedure, which lo oses sensitivity when the num b er of m ultiple comparison increases, before reac hing a plateau; (2) effect sizes ma y c hange as a function of scale (Figures 4, 6, 7). Assess the plausibility of the results iden tified with MSPC on real data. GLM connectome analyses in three real datasets at m ultiple scales. The MSPC iden tified biologically plausible changes in connectivity in all three analyses (Figures 10, 11). Assess if different scales can identify complemen tary effects. Same as ab o ve. The disco very rate w as markedly higher at low scales, b elo w 50 (Figures 8, 10). Statistical parametric maps were highly consistent across scales (Figure 12), although some effects asso ciated with sp ecific structures w ere b etter seen at high scales (Figures 10, 11). T able 1: Summary of the specific ob jectives, exp eriments and findings of the pap er. 5 2. Statistical testing pro cedures 2.1. F unctional p ar c el lations The first step to build a connectome is to select a parcellation of the brain, with R parcels. In this w ork, we used functional brain parcellations, aimed at defining groups of brain regions with homogeneous time series. A n um b er of algorithms ha ve b een prop osed with additional spatial constraints, to ensure that the resulting parcels are spatially connected (Lu et al., 2003; Thirion et al., 2006; Craddo c k et al., 2012). How ever, from a pure functional viewp oin t, the spatial constraint seems somewhat arbitrary , as functional units in the brain at lo w resolution encompass distributed netw orks of brain regions with homotopic regions often b eing part of a single parcel (De Luca et al., 2006; Damoiseaux et al., 2006). Some works ha v e thus used distributed parcels as the spatial units to measure functional brain connectivity , e.g. (Jafri et al., 2008; Marrelec et al., 2008). T o generate the functional parcelations, we relied on a recent metho d called “Bo otstrap Analysis of Stable Clusters” (BASC), which can identify con- sisten t functional parcels for a group of sub jects (Bellec et al., 2010), using a hierarc hical cluster with W ard’s criterion b oth at the individual and the group lev els. The functional parcels can b e generated at any arbitrary scale (within the range of the fMRI resolution), and we considered only parcels generated at the group level, which were non-ov erlapping and not necessarily spatially con tiguous. 2.2. F unctional c onne ctome F or eac h scale, and each pair of distinct parcels i and j at this scale, the b et ween-parcel connectivity y i,j is measured b y the Fisher transform of the Pear- son’s correlation b etw een the av erage time series of the parcels. Note that other measures can b e used to quan tify in teractions b et ween parcels, suc h as partial correlations (Marrelec et al., 2006). W e used correlation as it is the simplest, most p opular and still fairly accurate (Smith et al., 2011) measure of in terac- tion in fMRI. The statistical framework presented here could still b e applied to man y other measures (see 6). The within-parcel connectivity y i,i is the Fisher transform of the av erage correlation b et w een time series of every pair of distinct v oxels inside parcel i . The connectome Y = ( y i,j ) R i,j =1 is thus a R × R matrix. Eac h column j (or row, as the matrix is symmetric) co des for the connectivit y b et ween parcel j and all other brain parcels, or in other word is a full brain functional connectivity map. See Figure 1 a-b for a representation of a parcella- tion and associated connectome. Connectomes are generated indep endently at eac h scale. See App endix A for a more formal description of the connectome generation. 2.3. Statistic al p ar ametric c onne ctome F or a scale with R parcels, there are exactly L = R ( R +1) / 2 distinct elements in an individual connectome Y . This connectome can b e stored as a 1 × L vector, where the brain connections hav e b een ordered arbitrarily along one dimension. 6 0 1 x = 1 y = -55 z = 30 y = -55 z = 30 1 200 a Decomposition of the brain into resting-state networks (scale 200) b Matrix of functional connectivity between network time series (connectome). Each row/column is a functional connectivity map space space c Estimation of a statistical parametric connectome = . + Group of functional connectome in stereotaxic space for N subjects 1 Patients N subjects Explanatory variables parametric connectomes (regressi on coefficients) residuals estimated using a least-square criterion -1 x = 1 0 0 -0.5 0.5 N subjects K=2 N subjects seed 0 200 0 200 r Figure 1: General linear model applied to connectomes. The connectivit y is measured between R brain parcels generated through a clustering algorithm (panel a ). The connectome is a R × R matrix measuring functional connectivity b et ween- and within-parcels (panel b ). The asso ciation b et ween phenotypes and connectomes is tested independently at each con- nection using a general linear model at the group level (panel c ). The results presented here are for illustration purp ose only , and not related to the results presented in the application sections of the manuscript. When functional data is av ailable on N sub jects, the group of connectomes is then assem bled in to a N × L array Y = ( y n,l ), where n = 1 , . . . , N each co de for one sub ject and l = 1 , . . . , L eac h code for one connection. A general linear mo del (GLM) can then b e used to test the asso ciation b et ween brain connectivit y and a trait of interest, such as the age or sex of participants. All of these C explanatory v ariables are entered in a N × C matrix X . The v ariables are t ypically corrected to hav e a zero mean across sub jects, and an in tercept (i.e. a column filled with 1) is added to X . The GLM relies on the follo wing generativ e model: Y = XB + E , (1) • Y is a N × L matrix where each row codes for a sub ject, and each column co des for a connection, • X is a N × C matrix of explanatory v ariables (or cov ariates) where eac h ro w codes for a sub ject and each column co des for a cov ariate, 7 • B is an unkno wn C × L matrix of linear regression co efficients where each ro w codes for a cov ariate and each column co des for a connection, • E is a N × L random (noise) v ariable, with similar co ding as Y . W e relied on the following parametric assumptions on the noise E are (1) that its ro ws are independent; (2) that eac h elemen t follo ws a normal distribution with zero mean, and (3) that the v ariance of all elements are constant within a column, also called the homoscedasticity assumptions. As the data gener- ated from different sub jects are statistically indep endent the first assumption is reasonable. W e tested the normality and homoscedasticity assumptions on real datasets. Under these parametric assumptions, the regression co efficien ts B can b e estimated with ordinary least squares and, for a given “con trast” vector c of size 1 × C , the significance of c ˆ B can b e tested with a connectome of t -test ( t l ) L l =1 , with asso ciated p -v alues ( p l ) L l =1 . The quantit y p l con trols for the risk of false p ositive findings at each connection l . The GLM applied on connectomes is illustrated in Figure 1 c . See App endix B for the equations related to the estimation and testing of regression co efficien ts in the GLM. 2.4. The Benjamini-Ho chb er g FDR pr o c e dur e The num b er L of tests ( p l ) l gro ws quadratically with the scale K . The sig- nificance v alue applied on p l within a scale th us needs to b e adjusted for this m ultiple comparison problem. W e impleme n ted the benjamini-Ho ch b erg (BH) pro cedure (Benjamini and Ho c hberg, 1995) to control the FDR at a sp ecified lev el α within scale. The idea of the FDR is not to strictly control the prob- abilit y to observe at least one false p ositiv e (a quantit y know as family-wise error, FWE), but rather to control, on av erage, the prop ortion of false p ositiv e amongst the findings. Note that controlling for the FDR is not necessarily a more lib eral attitude than con trolling for the FWE: if the global n ull hypothe- sis is verified, i.e. all discov eries are false positive, then the FDR is exactly the FWE. In the presence of true disco veries, ho wev er, the FDR pro cedure tolerates in general more noise than a FWE approach. The actual num b er of false dis- co veries will dep end on the amount of signal (true p ositiv e) present in the data, and is therefore a context-dependent question. The BH procedure is a popular tec hnique to control the FDR, whic h w as designed for indep endent tests. The BH still has b een shown to hav e a satis factory b ehaviour even in the presence of p ositiv e correlation b etw een the tests p l (Benjamini and Y ekutieli, 2001). On sim ulations, the sp ecificit y of the FDR-BH algorithm w as assessed in the pres- ence of a realistic amount of correlation b et ween tests, as would b e found in a MSPC analysis of fMRI data. 2.5. Multisc ale p ar c el lations T o explore the asso ciation of connectomes and a trait of interest at multiple scales, some multiscale brain parcellations first need to b e generated, for which w e emplo yed the BASC metho d (Bellec et al., 2010). A GLM w as then estimated with FDR control at each scale indep endently (Figure 2). T o choose the scales 8 -1 0 1 1 # networks -1 0 1 scale (number of networks) 10 50 100 200 500 Figure 2: General linear mo del applied to connectomes at multiple spatial scales. The generation of data-driven brain parcels is iterated at different scales (n umber of parcels), using the b ootstrap analysis of stable clustered (BASC), with a hierarchical clustering using W ard’s criterion. The statistical parametric connectomes are represen ted using b oth their real size (left column) and after rescaling to fit identical size (middle column) to illustrate the quadratic increase in the num b er of connections (multiple comparisons) that comes with an increase in the num b er of parcels. The results presented here are for illustration purp ose only , and not related to the results presented in the application sections of the manuscript. of analysis, a comprehensive strategy would consist of a regular grid, e.g. from 10 to 300 brain parcels, with a step of 10. The GLM results at such scales ma y how ever b e highly redundant, as some parcels may b e found iden tically at differen t scales, if those are close. T o systematically examine the results of the GLM analysis at all selected scales, a b etter strategy w ould be to select a limited n umber of non-redundan t scales that span a giv en range (e.g. 10 to 300). F or this purp ose, we used the m ultiscale stepwise selection (MSTEPS) algorithm recen tly proposed by Bellec (2013) to select scales that provide an accurate summary of the stable features of brain clusters observed at all p ossible scales. Both strategies (comprehensive grid of scales and sparse subset) were examined in this w ork, b oth on simulations and real data. 9 2.6. Multisc ale testing T esting GLM on connectomes at m ultiple scales in tro duces a new level of m ultiple comparisons, this time across scales rather than across connections. In addition to the FDR within scale, one now needs to consider the FDR across scales, i.e. for all tests combined across scales. F or example, if t wo scales w ere used, K = 10 and K = 100, there would b e K ( K + 1) / 2 tests at each scale (i.e. 55 and 5050). If there were 10 disco veries at scale 10, 1 of whic h was a false p ositiv e, and 200 disco veries at scale 100, 10 of whic h w ere false p ositiv e, the ratio of false discov eries for this simulation w ould b e 1 / 10 = 0 . 1 within scale 10, and 10 / 200 = 0 . 05 within scale 100. The ratio of false discov eries across scales w ould b e (1 + 10) / (10 + 200) = 0 . 052. The FDR within-scale and b etw een-scale w ould b e the av erage of these false disco very proportions ov er many replications of such exp erimen ts. A straigh tforward wa y to con trol the FDR across scales w ould b e to apply the FDR-BH pro cedure to the whole set of tests, p ooled across scales. F or a regular grid of scales ranging from 10 to 300, with a step of 10, the largest num b ers of tests within scale is 300 × 301 / 2 = 45150. The total n umber of tests is in that case 475075, an order of magnitude larger. Because the FDR-BH relies on a Bonferroni estimation of the num b er of false p ositiv es, an FDR procedure in suc h a high dimension is b ound to hav e lo w sensitivit y , and would b e a high price to pay to explore multiple scales of a GLM analysis. Ho wev er, we can note that in a multiscale analysis, a detection at any scale mak es the presence of signal at all the other scales v ery lik ely . In the presence of m ultiple families of tests and a substan tial amount of true disco veries, (Efron, 2008) h yp othesized based on simulations that there would b e no need to adjust the FDR across families, when the FDR is controlled within family . The ra- tionale for this h yp othesis is that, in the presence of signal, the FDR con trols for a prop ortion, whic h behav es w ell when multiple families are com bined. By con trast, the FWE lo oks at a maximum statistics and gets mechanically in- flated when mutliple families are combined. In the context of a MSPC analysis, Efron’s hypothesis would mean that controlling for the FDR at each scale inde- p enden tly would also guaran tee that the FDR w ould b e controlled across scales. If supp orted empirically , this h yp othesis would justify to examine the results of a GLM on connectomes at many scales, without introducing the need for any additional correction of multiple comparisons b eyond what is required by a tra- ditional, single-scale analysis. The multiscale exploration would basically come for free, pro vided that enough true disco v eries w ere made ov erall. 2.7. Omnibus test Our h yp othesis is that the con trol of the o verall FDR (across connections and scales) can b e attained through the sole control of FDR within scale, in the presence of a substantial volume of true disco v eries. At a giv en scale s , V s is the p ercen tage of disco v eries, i.e. the num b er of significant tests as iden tified by FDR-BH at a given level α , divided by the total num b er of tests. F or a grid of scales, e.g. those selected by MSTEPS, the o veral volume of discov eries V was defined as the av erage of V s across all scales s . As a minimal requiremen t for 10 the v olume of true discov eries to b e “substan tial”, w e developped an omnibus test to reject the hypothesis that V could b e observed under the global null h yp othesis ( G 0 ), i.e. no non-nul l effe ct at any c onne ction and any sc ale . This test proceeded b y comparing the volume of disco veries V observ ed empirically in the group sample against the v olume of disco veries V ∗ that could be observed under ( G 0 ). T o generate replications of V ∗ under ( G 0 ), the GLM w as first applied with a reduced mo del where the explanatory v ariable of interest (as selected through the contrast) had b een remov ed. Then, a p ermutation of the residuals w as generated as describ ed in (Anderson, 2002), see App endix D. A replication of connectomes w as generated under ( G 0 ) by adding the p erm uted residuals to the estimated mixture of reduced explanatory v ariables. In order to resp ect the dep endencies b et ween connectivit y estimates within and across scales, the same p erm utation of the sub jects w as applied to all of the connections and scales. The detection procedure w as applied on eac h replication of connectomes, under ( G 0 ), and the total volume of disco veries was deriv ed. A Monte-Carlo appro ximation, with t ypically 10000 p erm utation samples on real data, was used to estimate a false-p ositiv e rate p when testing against the global null hypothesis. Note that a single omnibus test was deriv ed, controlling for the FWE of the exp erimen t as a whole. If this test passed significance, each scale was examined with a con trol of the FDR at α = 0 . 05, uncorrected for multiple comparisons across scales. If the omnibus test did not reach significance, then no connection at any scale w as deemed significan t. 3. Ev aluation on sim ulated datasets with independent tests 3.1. Metho ds Data-gener ating pr o c e dur e. W e started by simple simulations of indep enden t tests, to assess to which extent the hypothesis of Efron (2008) was robust to differen t scenarios, and if the omnibus test would systematically ensure that the FDR across scales would b e w ell controlled. A n umber K of test families were generated indep endently , each one comp osed of L k tests, k = 1 , . . . , K . Eac h family included a set prop ortion of true non-n ull hypotheses π 1 , identical for all families. If π 1 L k w as not an in teger, the n um b er of true positives n k w as set to either b π 1 L k c or b π 1 L k c + 1, with probabilities such that on a v erage o v er man y sim ulations E ( n 1 ) = π 1 L k . F or a non-n ull test l , the associated p -v alue w as sim ulated as: y l = θ + z l , z l ∼ N (0 , 1) , (2) p l = Pr ( x ≥ y l | x ∼ N (0 , 1)) , (3) where N (0 , 1) w as a Gaussian distribution with zero mean and unit v ariance, and θ > 0 was a simulation parameter (further called effect size). The null tests w ere generated the same wa y , but with an effect size θ = 0. 11 Simulations sc enarios. F or each exp erimen t, all combinations of effect size in the grid { 2 , 3 , 5 } and π 1 in the grid { 0% , 1% , 2% , 5% , 10% } were considered. W e implemen ted a series of exp erimen ts: • W e first chec k ed how the FDR across scales b eha ved as a function of the num b er of families K , with K in { 2 , 5 , 10 } and L k equals to 1000 (corresp onding approximately to the num b er of tests at scale 45). • W e then chec ked how the FDR across scales b eha v ed as a function of the n umber of tests per family L k with L k iden tical for all k , and in the grid { 100 , 1000 , 10000 } (corresponding roughly to scales 14, 45 and 141), and K = 5 families. • W e chec k ed how the FDR across families b eha v ed for a num b er of families and a num b er of tests p er family that would b e comparable to situations encoun tered on multiscale GLM-connectome analysis. – W e first tested the scales selected by MSTEPS on the SCHIZO dataset (see Section 5), i.e. K = 7 and the ( L k ) k equal to (28, 136, 325, 1540, 6555, 19900, 53956), corresp onding to the n um b er of tests at scales 7, 16, 25, 55, 114, 199, 328. – W e then tested the pro cedure on K = 30 and ( L k ) k ranging from 55 to 45150, which would b e equal to the num b er of tests asso ciated with a regular grid co v ering scales 10 to 300 with a step of 10. – W e finally tested the b eha viour of smaller grids, with a n umber of tests equiv alen t to GLM tests o ver scales ranging from 10 to either 50, 100 or 300 (with a step of 10). Computational envir onment. All the exp erimen ts rep orted in the pap er were p erformed using the NeuroImaging Analysis Kit (NIAK 1 ) v ersion 0.12.18, under Cen tOS v ersion 6.3 with Octa v e 2 v ersion 3.8.1 and the Minc to olkit 3 v ersion 0.3.18. Analyses were executed in parallel on the ”Guillimin” sup ercomputer 4 , using the pip eline system for Octav e and Matlab (Bellec et al., 2012), v ersion 1.0.2. The scripts used for pro cessing can b e found on Github 5 . Statistic al testing pr o c e dur e. F or each simulation scenario, the FDR-BH pro ce- dure was applied to each family independently , with a significance level α in the grid { 0 . 01 , 0 . 05 , 0 . 1 , 0 . 2 } . T o estimate the distribution of the volume of discov- ery under the global null, 1000 samples were generate d with the parameters θ and π 1 set to zero, for each choice of K and ( L k ) k . These replications under the globall n ull w ere used to generate the p -v alues of the omnibus test for all sim ulations with identical K and ( L k ) k . 1 http://www.nitrc.org/projects/niak/ 2 http://gnu.octave.org 3 http://www.bic.mni.mcgill.ca/ServicesSoftware/ServicesSoftwareMincToolKit 4 http://www.calculquebec.ca/en/resources/compute- servers/guillimin 5 https://github.com/SIMEXP/glm_connectome 12 Effe ctive FDR, sensitivity and omnibus test. The effective FDR at eac h scale w as computed as the num b er of false disco v eries divided b y the total num b er of discov eries, a v eraged across 1000 simulation replications for each simulation scenario. The effectiv e sensitivity was computed at eac h scale as the num b er of true discov eries, divided b y the n umber of true non-n ull h yp otheses presen t at this scale, and a veraged across the 1000 replications. T o compute the FDR across scales, the same pro cedure to estimate the effectiv e FDR was applied to the com bination of tests po oled across all families. Finally , we also derived a mo dified FDR and sensitivity , where the BH-FDR pro cedure was com bined with the omnibus p erm utation test, at a significance level of p < 0 . 05. 3.2. R esults Figure 3: Nominal vs effectiv e FDR on sim ulations with indep enden t tests ( K = 7 , L k in (28 , 136 , 325 , 1540 , 6555 , 19900 , 53956) , corresp onding to the n umber of tests asso ciated with the scales selected by MSTEPS on the SCHIZO dataset. The effective FDR is plotted against the nominal FDR within each family (blue plots), across all families (green plots) and across all families, combined with an omnibus test for rejection of the global null hypothesis (red plot). The expected (nominal) v alues are represented in blac k plots, corresponding to the four tested FDR levels: 0 . 01 , 0 . 05 , 0 . 1 , 0 . 2. Each column corresp onds to a certain prop ortion of non-null h yp othesis per family π 1 (0% , 1% , 2% , 5% , 10%), and eac h row corresp onds to a different effect size θ (2 , 3 , 5), see text for details. Please note that in the presence of strong signal (large θ and/or π 1 ), the omnibus test is alwa ys rejected, and the green plot matches p erfectly the red plot, which b ecomes invisible. 13 The intr a-family FDR. Some of the conclusions in that example were observed consisten tly across all our exp erimen ts, see for instance Figure 3. In particular, the effective FDR within eac h family is follo wing closely (1 − π 1 ) α . This is a replication of a w ell-established result: the BH-FDR procedure is conserv ative b y a factor (1 − π 1 ) for independent tests. F or example, for α = 0 . 2 and a π 1 of 10%, the effective FDR is of approximately 0.18 for all effect sizes θ , see the righ t-most v alues in the last column in Figure 3. The FDR acr oss families. The FDR across families follo wed a smo oth transition b et ween tw o regimes. The first regime, called “liberal” was clearly seen under the global null hypothesis (first column in Figure 3). In this regime, the FDR matc hed with the FWE, i.e. the probability to hav e one or more false p ositiv e. As exp ected, controling the FWE within family did not con trol for the FWE across families, i.e. the effective FDR across families was largely sup erior to the prescrib ed level α . The second regime, called “exact” was seen best in the last column of Figure 3. In the presence of a large π 1 (in this example 10%), the FDR across scales precisely follow ed the FDR within scales. The transition b et ween these tw o regimes (lib eral and exact) was smooth, and in situations that ressembled the global null h yp othesis (i.e. at lo w π 1 or effect size), the FDR across scales w as more lib eral than the nominal α , sometimes by a wide margin, e.g. L k = 1000, π 1 = 1% and θ = 2 in Figure S13. Note that b oth increasing the effect size, or increasing π 1 b oth pushed the FDR across families to wards the “exact” regime. The FDR acr oss families, with omnibus test. The effect of the omnibus test on the FDR across families was particularly apparent under the global null h yp othesis in all sim ulations: the FDR across scales matc hed the FWE, whic h w as less than, or equal to the p v alue of the omnibus test, as exp ected, see the first column in Figure 3. More generally , for simulation scenarios that represen ted a transition b etw een the liberal and exact regimes of the FDR across families, the application of the omnibus test tended to mak e the FDR across families more conserv ativ e. There w as still no guarantee that the FDR across families conformed to the sp ecified α level, as can b e seen for L k = 1000, π 1 = 1% and θ = 2 in Supplementary Figure S13, where the effective FDR was larger than 0 . 1 for a nominal FDR of 0 . 05. This behaviour was how ever found to b e very muc h dep endent on the num b er of tests per family and the n umber of families, whic h w as further studied b elo w. Influenc e of the numb er of families K . By v arying K in { 2 , 5 , 10 } for a fixed n umber of tests p er family ( L k = 1000 for all k ), w e found that the transition b et ween the lib eral and exact regime of the FDR across scales to ok longer when the num b er of families increased. F or π 1 = 2% and θ = 2, and a nominal FDR α = 0 . 05, the effective FDR was ab out 0 . 07 with K = 2, while it increased to almost 0 . 1 for K = 10 (Supplementary Figure S13). 14 Influenc e of the numb er of tests p er family L . By v arying L k in { 100 , 1000 , 10000 } (with L k iden tical for all k ) for a fixed num b er of families K = 5, we found that the transition b et ween the liberal and exact regime of the FDR w as quic ker when the num b er of tests p er family increased. In other w ords, the exact regime ap- p ears as an asymptotic behaviour of the FDR across scales, when the num b er of tests per family b ecomes large. F or example, for π 1 = 2% and θ = 2, and a nom- inal FDR α = 0 . 05, the effectiv e FDR across scales w ent from ab o ve 0 . 1 with 100 tests p er family to b elo w 0 . 06 with 10000 tests p er family (Supplemen tary Figure S14). Figure 4: Sensitivit y on simulations with indep enden t tests, K = 7 , L k in (28 , 136 , 325 , 1540 , 6555 , 19900 , 53956) , corresp onding to the n umber of connections as- so ciated with the scales selected by MSTEPS on the SCHIZO dataset. The sensitiv- ity is plotted as a function of scales at four tested (within-scale) FDR levels: 0 . 01 , 0 . 05 , 0 . 1 , 0 . 2. A test is only considered as significant if in addition an omnibus test against the global null hypothesis across scales as b een rejected at p < 0 . 05. Each column corresp onds to a cer- tain prop ortion of non-n ull hypothesis p er family π 1 (0% , 1% , 2% , 5% , 10%), and each row corresponds to a different effect size θ (2 , 3 , 5), see text for details. Sc enarios b ase d on multisc ale c onne ctome testing. Figure 3 shows the effectiv e FDR for K = 7 families including a num b er of tests similar to the ones asso ciated with the scales selected b y MSTEPS on the SCHIZO dataset. In this setting, and despite the high num b er of families, the transition from the lib eral to the 15 exact regime w as v ery quic k, which likely reflected the high num b er of tests found in most families. In particular, the FDR was found to b e appropriately con trolled across scales as so on as π 1 > 5%. In situations were the FDR across scales was lib eral, the correction by the omnibus tests made the test very close to nominal levels, or conserv ativ e. Regarding the sensitivity of the tests, as exp ected, increasing either π 1 or θ increased the o verall sensitivity of the tests. W e observed a general trend in all scenarios: the sensitivity p eaked at very lo w scales, and decreased exponentially to reach a plateau around scale 10 to 50. After this initial loss in sensitivity , the sensitivity was uniform across scales (Figure 4). Iden tical conclusions were reached with families akin to connectome testing on a regular grid of scales ranging from 10 to either 50, 100, or 300 parcels (with a step of 10). See Supplemen tary Figure S15 for the effective FDR, and Supplemen tary Figure S16 for sensitivit y results. 4. Ev aluation on sim ulated datasets with dependent tests 4.1. Metho ds Data-gener ating pr o c e dur e. W e designed a simulation framew ork for multiscale GLM-connectome analysis in the presence of dep encies b et ween tests, b oth within scale and across scales. T o ensure that these dep encies w ould be as re- alistic as p ossible, semi-synthetic datasets were generated starting from a large real sample (Cambridge) released as part of the 1000 functional connectome pro ject 6 (Bisw al et al., 2010). This sample (Liu et al., 2009) included resting- state fMRI time series (eyes op ened, TR of 3 seconds, 119 volumes p er sub ject) collected with a 3T scanner on 198 healthy sub jects (75 males), with an age ranging from 18 to 30 years. All the datasets w ere prepro cessed and resampled in stereotaxic space, as described in Section 5.1. A region gro wing algorithm w as used to extract 483 regions, common to all sub jects, as describ ed in Bellec et al. (2010). F or eac h sub ject, the a verage functional time series and associated connectomes were generated using these regions 7 (see Section 2.2). The av erage connectome across all sub jects was derived, and a hierarchical clustering pro ce- dure (with W ard’s criterion) w as applied to derive a hierarch y of brain parcels at all p ossible scales, ranging from 1 to 483. The simulation pro cedure relied on the manual selection of a critical scale K and a particular cluster k at this scale. F or each simulation, tw o non-ov erlapping subgroups of sub ject ( N sub jects p er group) w ere randomly selected. A circular blo c k b o otstrap (CBB) procedure w as applied to resample the individual time series, using identical time blo c ks within each cluster, and indep endent time blocks in differen t clusters. This re- sampling scheme ensured that within-cluster correlations were preserved, while b et ween-cluster correlations had a v alue of zero on av erage. Finally , for the sub jects selected to be in the first group, a single realization of a indep enden t 6 http://fcon_1000.projects.nitrc.org/fcpClassic/FcpTable.html 7 The average time series hav e b een publicly released at http://figshare.com/articles/ Cambridge_resting_state_fMRI_time_series_preprocessed_with_NIAK_0_12_4/1159331 . 16 and identically distributed Gaussian v ariable, where each time p oin t had a zero mean and a v ariance of a 2 , w as added to the time series of the regions inside cluster k , after the time series w ere corrected to a zero temporal mean and a v ariance of (1 − a 2 ). The addition of this signal increased the intra-parcel con- nectivit y of the cluster including cluster k for all scales smaller or equal to K , and increased the within- as well as b etw een-parcel connectivity for all clusters included in cluster k for scales strictly larger than K . Because of the absence of correlations b etw een parcels at scale K (due to the CBB resampling), all other connections within- or betw een clusters at every scale were left unchanged b y this procedure. It w as th us possible to know exactly whic h connections were true or false null hypothesis in the group difference at ev ery scale. Supplementary Figures S17 and S18 outline the procedure of multiscale connectome sim ulation. Effe ct size and pr op ortion of non-nul l hyp othesis. A n umber of clusters of ref- erence w ere handpick ed such that the proportion of non-null h yp othesis π 1 ( k ) w ould be ab out 1%, 2%, 5% and 10% at all scales k . Note that these reference clusters w ere used to set true non-n ull hypotheses at all the scales of analysis, y et the sub divisions (or merging) asso ciated with these clusters represen ted a v arying proportion of the num b er of clusters at any giv en scale. As a conse- quence, and unlike simulations of independent tests, π 1 ( k ) w as dep enden t on the scale k . Two v alues for a 2 w ere selected: 0 . 1 and 0 . 2. The effect size as- so ciated with a given a 2 actually dep ended on the within-cluster correlations, b et ween-sub ject v ariance in connectivity as w ell as the scale of analysis. Two sample sizes were in vestigated: N = 40 (20 sub ject per group), and N = 100 (50 sub jects p er group). See Supplementary Material Figure S19 for plots of the effect size and p ercen tage of true non-null hypotheses as a function of scale. F or eac h simulation scenarios, 1000 Monte-Carlo samples were generated and sub jected to the MSPC analysis, with FDR lev els of 0 . 01, 0 . 05, 0 . 1 and 0 . 2, as w ell as an omnibus test at p < 0 . 05. The same scales w ere tested here as in the simulations for independent tests: the scales selected by MSTEPS on the SCHIZO exp eriment, and a regular grid from 10 to 300 clusters (with a step of 10). Simulations under the glob al nul l. T o assess the b ehaviour of the testing pro ce- dures in the absence of an y signal, w e also ran experiments under the global n ull. In that case real connectomes were generated for randomly selected and non- o verlapping groups of sub jects, and then a testing procedure w as implemented to assess the significance of group differences. In these exp erimen ts, no bo ot- strap was performed on individual time series nor any signal w as added. The exp erimen ts simply consisted in comparing real connectomes b et ween random groups of sub jects sampled from identical p opulations, using real dep endencies b et ween tests. R obustness to the choic e of clusters. Finally , we also inv estigated how the pro- cedure b eha ved when the clusters used in the testing pro cedures did not match exactly with the clusters that were used to generate the simulations. F or this 17 purp ose, for each sim ulation, no signal was actually generated in 30% of the regions in the cluster of reference, but rather in an equiv alent n umber of ar- bitrarily selected regions from other clusters. The same regions were selected across all simulations to simulate a systematic departure of the test clusters from the ground truth clusters. The m ultiscale clusters without perturbations w ere used in the statistical testing pro cedures. In this setting, man y connec- tions outside of the cluster of reference ended up with very small effects, and we did not in vestigate the sp ecificity given the v ery large n um b er of true non-n ull h yp otheses and large v ariations in effect size. Ho wev er, we did inv estigate the sensitivit y of the FDR-BH pro cedure, using the same definition of true non-n ull h yp othesis as with the simulations without p erturbation. 4.2. R esults Effe ctive FDR within sc ale. Figure 5 represen ts the empirical FDR as a function of scale for the MSPC procedure, in the case of a regular grid of scales cov ering 10 to 300 brain parcels and a p erfect matc h b et ween the true and test clusters. The effectiv e FDR was conserv ativ e within scale on the simulations with dep enden t tests, e.g. the effective FDR w as about 0 . 15 for a nominal FDR of 0 . 2. This is in contrast with the indep endent tests, where the control of the FDR within scale w as exact under the global null hypothesis. Our interpretation w as that the large p ositive correlations present in fMRI time series caused the FDR-BH pro cedure to b ecome conserv ative. In the presence of signal, the FDR within scale w as still w ell con trolled, with the same (1 − π 1 ) factor on the effectiv e FDR as w as observ ed with indep enden t tests. Effe ctive FDR acr oss sc ales. As was observ ed on independent tests, the FDR across scales transitioned b et ween a “lib eral” regime, in simulation scenarios close to the global n ull hypothesis, to an exact regime, where the FDR across scales matched the FDR within scales. The transition b et ween regimes hap- p ened quite fast, with either a 2 = 0 . 2 or N = 100, as so on as π 1 w as larger than 5%. When combined with the omnibus test at p < 0 . 05, the FWE under the global null hypothesis b ecame exact or conserv ative for a FDR level ab o ve 0 . 05. Imp ortan tly , the omnibus test also made the pro cedure either conserv ative (for α ≥ 0 . 1) or only slightly lib eral in the scenarios were the FDR across scales transitioned b et ween the “lib eral” and “exact” regimes, with the effective FDR in the range 0 . 06 to 0 . 09 for a nominal level of 0 . 05 in the w orst cases (i.e. N = 40, a 2 = 0 . 1 and π 1 = 1%). The conclusions w ere iden tical when using a regular grid of K = 30 scales ranging from 10 to 300 parcels (with a step of 10), or K = 7 scales iden tical to those selected by MSTEPS on the SCHIZO dataset, see Supplemen tary Figure S20. Sensitivity. When the true and test clusters perfectly matc hed, the sensitivity across scales follo wed a similar patterns in all scenarios: a decrease in sen- sitivit y with increasing scales, although not as sharp as what w as observ ed on sim ulations with independent tests, see Figure 6. This closely mirrored the large increase in effect size at lo w scales, due to av eraging on clusters that p erfectly 18 Figure 5: Nominal vs effective FDR on simulations with dependent tests ( K = 30 , L k ranging from 55 to 45150 , corresp onding to the n umber of connections asso ciated with a regular grid of scales cov ering 10 to 300 with a step of 10). The effective FDR is plotted against the nominal FDR within each family (blue plots), across all families (green plots) and across all families, combined with an omnibus test for rejection of the global null hypothesis (red plot). The expected (nominal) v alues are represented in blac k plots, corresponding to the four tested FDR levels: 0 . 01 , 0 . 05 , 0 . 1 , 0 . 2. Each column corresp onds to a certain proportion of non-null hypothesis p er family π 1 (0% , 1% , 2% , 5% , 10%), and eac h row corresponds to a differen t com bination of effect and sample size N in { 40 , 100 } , a 2 in { 0 . 1 , 0 . 2 } , see text for details. Please note that in the presence of strong signal (large θ and/or π 1 ), the omnibus test is alwa ys rejected, and the green plot matches perfectly the red plot, which becomes invisible. matc hed the sim ulated signal, see Supplementary Figure S19. W e noted that the simulation settings where departure from nominal levels w ere observed w ere also c haracterized by very low rate of discov eries, notably at high scale, with sensitivit y b elo w 0.1 for scales higher than 50 and falling to zero for scales higher than 150 (Figure 6, first row). By contrast, when introducing a 30% mismatc h b et ween the true and test clusters, increases in sensitivit y w ere observ ed across a wider range of lo w scales, e.g. N = 100, a 2 = 0 . 1 and π 1 = 10%, or ev en at high scales, e.g. N = 100, a 2 = 0 . 2 and π 1 = 2% (Figure 7). This again reflected the more v ariable profiles of effect size as a function of scales across scenarios after the introduction of a mismatch b etw een the true and test clusters. These simu- lations demonstrated the p ossibilit y to ha ve increase in sensitivit y as a function of scale, and that these gains would p otentially b e dep enden t on the effect size, 19 Figure 6: Sensitivit y on simulations with dep enden t tests, when no mismatch is introduced b etw een the true and test clusters ( K = 30 , L k ranging from 55 to 45150 , corresp onding to the num b er of connections associated with a regular grid of scales cov ering 10 to 300 with a step of 10). The sensitivit y is represen ted as a function of scale, for four FDR levels: 0 . 01 , 0 . 05 , 0 . 1 , 0 . 2. In addition to FDR con trol within scale, an omnibus test at p < 0 . 05 w as p erformed. Each column corresponds to a certain proportion of non-null hypothesis p er family π 1 (0% , 1% , 2% , 5% , 10%), and eac h row corresponds to a differen t com bination of effect and sample size N in { 40 , 100 } , a 2 in { 0 . 1 , 0 . 2 } , see text for details. The same clusters were used to simulate the time series and p erform the tests. the mismatch b etw een the true/test clusters, as well as the sample size. These observ ations were made for a regular grid of scales, but were identical using the MSTEPS scales from the SCHIZO dataset (not shown). 5. Application to real datasets 5.1. Metho ds Particip ants. The SCHIZO dataset w as contributed by the Center for Biomed- ical Research Excellence (COBRE) to the 1000 functional connectome pro ject 8 8 http://fcon_1000.projects.nitrc.org/indi/retro/cobre.html 20 Figure 7: Sensitivity on simulations with dep endent tests, when a 30% mismatch is introduced b etw een the true and test clusters ( K = 30 , L k ranging from 55 to 45150 , corresp onding to the num b er of connections associated with a regular grid of scales cov ering 10 to 300 with a step of 10). The sensitivit y is represen ted as a function of scale, for four FDR levels: 0 . 01 , 0 . 05 , 0 . 1 , 0 . 2. In addition to FDR con trol within scale, an omnibus test at p < 0 . 05 w as p erformed. Each column corresponds to a certain proportion of non-null hypothesis p er family π 1 (0% , 1% , 2% , 5% , 10%), and eac h row corresponds to a differen t com bination of effect and sample size N in { 40 , 100 } , a 2 in { 0 . 1 , 0 . 2 } , see text for details. A 30% mismatch w as introduced b etw een the true and the test clusters. The true p ositiv es used to estimate sensitivity were defined by the reference clusters for the simulation, regardless of the p otential p erturbation of these clusters prior to sim ulation to create a mismatch b etw een true and test clusters. (Bisw al et al., 2010). The sample comprised 72 patients diagnosed with schizophre- nia (58 males, age range = 18-65 yrs) and 74 healthy con trols (51 males, age range = 18-65 yrs). The BLIND (Collignon et al., 2011) and MOTOR (Alb ouy et al., 2014) datasets w ere acquired at the F unctional NeuroImaging Unit, at the Institut Univ ersitaire de G ´ eriatrie de Montr ´ eal, Canada. Participan ts gav e their written informed consent to take part in the studies, which were approv ed b y the research ethics board of the Queb ec Bio-Imaging Netw ork (BLIND, MO- TOR), as well as the ethics b oard of the Centre for In terdisciplinary Researc h in Rehabilitation of Greater Mon treal (BLIND). The BLIND dataset was com- p osed of 14 congenitally blind v olunteers recruited through the Nazareth and Louis Braille Institute (10 males, age range = 26-61 yrs) and 17 sighted con trols (8 males, age range = 23-60 yrs). The MOTOR sample included 54 healthy 21 y oung participan ts (33 males, age range = 19-33 yrs). A c quisition. Resting-state fMRI scans were acquired on a 3T Siemens T rioTim for all datasets. One single run was obtained per sub ject for either the SCHIZO or BLIND dataset while t wo runs w ere acquired in eac h sub ject for the MOTOR dataset, one immediately preceding and one following the practice on a motor task. F or the SCHIZO dataset, 150 EPI blo o d-o xygenation level dep endent (BOLD) volumes were obtained in 5 mns (TR = 2 s, TE = 29 ms, F A = 75 ° , 32 slices, v oxel size = 3x3x4 mm 3 , matrix size = 64x64), and a structural image w as acquired using a multi-ec ho MPRAGE sequence (TR = 2.53 s, TE = 1.64/3.5/5.36/7.22/9.08 ms, F A = 7 ° , 176 slices, vo xel size = 1x1x1 mm 3 , matrix size = 256x256). F or the BLIND dataset, 136 EPI BOLD volumes were acquired in 5 mins (TR = 2.2s, TE = 30 ms, F A = 90 ° , 35 slices, vo xel size = 3x3x3.2 mm 3 , gap = 25%, matrix size = 64x64), and a structural image was acquired using a MPRAGE sequence (TR = 2.3 s, TE = 2.91 ms, F A = 9 ° , 160 slices, vo xel size = 1x1x1.2 mm 3 , matrix size = 240x256). F or the MOTOR dataset, 150 EPI v olumes were recorded in 6 mins 40 s (TR = 2.65s, TE = 30ms, F A = 90 ° , 43 slices, vo xel size = 3.4x3.4x3 mm 3 , gap = 10%, matrix size = 64x64), and a structural image w as acquired using a MPRA GE sequence (TR = 2.3 s, TE = 2.98 ms, F A = 9 ° , 176 slices, vo xel size = 1x1x1 mm 3 , matrix size = 256x256). Motor task. Betw een the tw o rest runs of the MOTOR exp erimen t, sub jects w ere scanned while p erforming a motor sequence learning task with their left non-dominan t hand. 14 blo c ks of motor practice were interspersed with 15s rest ep o c hs. Motor blo cks required sub jects to p erform 60 finger mo vemen ts, ideally corresponding to 12 correct five-elemen t finger sequence. The duration of the practice blo c ks decreased as learning progressed. It should b e noted that the effect of motor learning p er se on the subsequent rest run could not b e distinguished from that of a mere motor practice/fatigue effect in the present exp erimen tal setting. Pr epr o c essing. Eac h fMRI dataset was corrected for inter-slice difference in ac- quisition time and the parameters of a rigid-b ody motion were estimated for each time frame. Rigid-b ody motion was estimated within as well as b etw een runs, using the median volume of the first run as a target. The median volume of one selected fMRI run for eac h sub ject w as coregistered with a T1 individual scan using Minctracc (Collins and Ev ans, 1997), which was itself non-linearly trans- formed to the Montreal Neurological Institute (MNI) template (F onov et al., 2011) using the CIVET pip eline (Ad-Dab’bagh et al., 2006). The MNI symmet- ric template w as generated from the ICBM152 sample of 152 y oung adults, after 40 iterations of non-linear coregistration. The rigid-bo dy transform, fMRI-to-T1 transform and T1-to-stereotaxic transform w ere all combined, and the functional v olumes w ere resampled in the MNI space at a 3 mm isotropic resolution. The scrubbing metho d of Po wer et al. (2012), was used to remov e the volumes with excessiv e motion (frame displacement greater than 0.5 mm). A minimum num- b er of 60 unscrubb ed volumes p er run, corresp onding to ∼ 180 s of acquisition, 22 w as then required for further analysis. F or this reason, some sub jects w ere re- jected from the subsequent analyses: 16 controls and 29 schizophrenia patients in the SCHIZO dataset (none in either the BLIND or MOTOR datasets). The follo wing n uisance parameters were regressed out from the time series at each v oxel: slow time drifts (basis of discrete cosines with a 0.01 Hz high-pass cut- off ), av erage signals in conserv ative masks of the white matter and the lateral v entricles as w ell as the first principal comp onen ts (95% energy) of the six rigid- b ody motion parameters and their squares (Giov e et al., 2009). The num b er of confounds regressed from the individual time series ranged from 12 to 18 for the MOTOR sample, from 11 to 15 for the BLIND sample, and from 10 to 17 for the SCHIZO sample. The fMRI volumes w ere finally spatially smo othed with a 6 mm isotropic Gaussian blurring k ernel. Note that the preprocessed fMRI time series for the COBRE exp erimen t hav e b een made publicly av ailable 9 . Multisc ale p ar c el lation. Brain parcellations were derived using BASC separately for eac h dataset, while p ooling the patien t and control groups in the SCHIZO and BLIND datasets, and runs in the MOTOR dataset. The BASC used 100 replications of the clustering of each individual time series, using circular blo c k b ootstrap, and 500 replications of the group clustering, using regular b o otstrap. The functional group clusters were first generated on a fixed regular grid, from 10 to 300 clusters with a step of 10, identical for all three real datasets, and with identical num b ers of individual, group, and final (consensus) clusters. The MSTEPS pro cedure was then implemented to select a data-driven subset of scales approximating the group stability matrices up to 5% residual energy , through linear interpolation ov er selected scales. The num b er of individual clusters were selected in the fixed grid ab o ve, yet the n umber of group and final clusters were searched in an interv al of ± 20% of the individual scales, such that the final scales were not constrained in the range 10 to 300. Note that the n umber of scales itself was selected by the MSTEPS pro cedure in a data-driven fashion, and that the num b er of individual, group and final (consensus) n um b er of clusters w ere not necessarily iden tical. Gener al line ar mo del. F or all GLM analyses, the co v ariates included an in ter- cept, the age and sex of participants as well the av erage frame displacement of the runs inv olved in the analysis (tw o cov ariates of frame displacement were used in the MOTOR dataset, one p er run). The contrast of interest w as on a dumm y co v ariate co ding for the difference in a v erage connectivity b etw een the t wo groups for SCHIZO and BLIND, and on the intercept (a verage of the dif- ference in connectivit y pre- and p ost-training) for the MOTOR dataset. Note that for the motor dataset the difference in connectivit y b et ween the second run and the first run was entered in the group-level GLM, in place of the individual connectome. All cov ariates except the intercept were corrected to a zero mean. 9 http://figshare.com/articles/COBRE_preprocessed_with_NIAK_0_12_4/1160600 23 Mo deling assumptions. The parametric GLM relies on a series of assumptions, most critically the normality of distribution of the residuals of the tests, and the homoscedasticity of residuals, i.e. equal v ariance across sub jects. F or eac h connection and each con trast, the normality of distribution for the residuals of the regression w as tested with a comp osite test 10 : Shapiro-F rancia for plat ykur- tic distributions and Shapiro-Wilk for leptokurtic distributions (Ro yston, 1993). A test for homoscedastic residuals w as also implemented using the procedure of White (1980), where all v ariables as well as their t wo-w ay interactions (in- cluding squared v ariables) were regressed against the square of the residuals, and a F test w as p erformed on the combination of all exploratory v ariables. A p v alue was generated at eac h connection, both for the normalit y and the ho- moscedasticit y tests, for the highest resolution selected b y MSTEPS, and m ul- tiple comparisons across all connections w ere corrected with the FDR-BH pro- cedure ( q < 0 . 05). In addition to the MOTOR, BLIND and SCHIZO datasets, the Cambridge dataset previously used in the sim ulations was also employ ed here. The GLM only included an intercept and an arbitrary group difference, for differen t sample sizes ( N ∈ { 40 , 100 , 180 } ), in order to inv estigate how the testing of assumptions b eha ved for different sample sizes. 5.2. R esults Mo deling assumptions. No tests of departure from normality passed correction for multiple comparison using FDR-BH at q < 0 . 05. Ho wev er, some trends to wards significance were observed in all datasets, in particular with a large sample size. F or a threshold of p < 0 . 05, uncorrected for multiple comparisons, the normality hypothesis was rejected for 9%, 6 . 8% and 11% of connexions, for the MOTOR, BLIND and SCHIZO experiments, resp ectively (Supplemen tary Figure S21). No test for heteroscedasticit y survived a correction for multiple comparisons with FDR-BH at q < 0 . 05, and there was no apparent trend. A t p < 0 . 05, the homoscedasticit y h yp othesis w as rejected for 3 . 4%, 4 . 2% and 7 . 4% in the MOTOR, BLIND and SCHIZO exp erimen ts, resp ectiv ely . The trends observed for heteroscedasticit y testing were similar to those observ ed in the Cambridge dataset, using random subgroups that are th us in fact homoscedastic (Supple- men tary Figure S22). Multisc ale disc overies. The MSTEPS pro cedure selected 6 scales for the MO- TOR and BLIND samples, and 7 on the SCHIZO sample, ranging from 7 to 300+, see T able S2 for multi-lev el scale parameters. The MSPC detection gen- erated maximal p ercen tages of discov eries at low scales for the three datasets (Figure 8). Using a grid from 10 to 300 scales with a step of 10, p eak disco veries w ere detected at scale 10 for the SCHIZO and MOTOR contrasts, and scale 20 10 as implemented in the swtest.m pro cedure http://www.mathworks.com/matlabcentral/ fileexchange/13964- shapiro- wilk- and- shapiro- francia- normality- tests/content/ swtest.m , retrieved on 12/2014. 24 Figure 8: Percen tages of discov ery as a function of scales. Plots show the p ercentage of discov ery for the MOTOR, BLIND and SCHIZO contrasts. The blue curve represent the scales selected on a regular grid, from 10 to 300 with a step of 10, and the red crosses show the scales selected by the MSTEPS pro cedure (see text for details). for the BLIND con trast. Peak percentages of discov eries were 30%, 2.3% and 15%, for the SCHIZO, BLIND and MOTOR con trasts, respectively . The om- nibus test was significan t ( p < 0 . 05) for all three con trasts, whether using a large grid of 30 scales or the 6-7 scales identified with MSTEPS. The ov erall trend w as that the rate of discov eries decreased as the n um b er of parcels increased, with the largest discov ery rate found b elo w scale 50, follow ed by a notable plateau from 50 to 100 clusters. These relationships b et ween discov ery rate and scales shared similarities with the sensitivit y plots observed on simulations (Figures 3, 7). While the absolute p ercen tages of discov eries w ere quite different for the three datasets, the relative changes in discov ery rate as a function of scale were th us rather similar. Sp atial distribution of signific ant disc overies. Disco very p ercen tage maps re- v ealed which parcels w ere asso ciated with the largest proportion of significant connections for any given parcel, see Figure 9 for a representation of the BASC m ultiscale parcels and asso ciated disco very percentage maps for the SCHIZO analysis. F or each contrast, results were shown for all 6-7 scales extracted with the MSTEPS pro cedure. The areas sho wing maximal p ercen tage of disco ver- ies were quite different for the three datasets (Figure 10). Widespread effects w ere observed for the SCHIZO dataset at b oth cortical and sub cortical levels (see also Figure 9, for a v olumetric represen tation). Parcels with the highest disco very rate were found in the temp oral cortex, the medial temp oral lob e, the an terior cingulate cortex and the basal ganglia. The BLIND con trast rev ealed more lo calized effects, in the occipital cortex and to a lesser exten t in the tem- p oral and fron tal cortices. Finally , the MOTOR con trast identified significan t effects within an extended visuomotor cortico-sub cortical parcel. Despite the o v erall higher rate of disco v e ries for lo w scales, b elo w 50, the spatial distributions of disco v eries w ere fairly consistent across scales. It w as also in teresting to note that low scales did not alwa ys pro vide the highest discov ery rate for a given brain parcel. F or instance, the prop ortion of connections showing 25 328 7 16 25 55 1 1 4 199 s c a l e (n u m b er o f b r a i n p a r c el s ) z - c o o r d i n a t es (s ter eo t a x i c s p a c e) - 2 0 4 0 10 di scov e r y m a ps ne t w or ks 0 % > 40 Figure 9: MSTEPS parcels and p ercen tage of discov ery maps in the SCHIZO con trast, in v olumetric space. Netw orks show the functional brain parcellations for the 7 MSTEPS scales. Corresponding percentage discov ery maps show the p ercentage of connections with a significant effect, for eac h brain parcel. MNI coordinates are giv en for representativ e slices sup erimposed onto the MNI 152 non-linear template. a significant effect in the basal ganglia for the SCHIZO con trast b ecame maximal at scale 55, once the thalami were isolated as a single parcel (Figure 9). As another example, the dorsolateral prefrontal cortex only show ed a significant effect in the BLIND contrast for functional brain parcellations abov e scale 40 (Figure 10). Se e d-b ase d maps of t -statistics. The maps of discov ery rate did not c haracter- ize which sp ecific connections were identified as significan t for eac h parcel, nor the direction of the effect (i.e. an increase vs a decrease in connectivity). W e illustrated ho w these questions can b e explored using the SCHIZO dataset, as it show ed widespread changes in functional connectivity . The p ercentage of dis- 26 schizo 7 328 199 1 14 55 25 16 mot or 308 14 35 72 154 7 blind 7 313 165 77 40 16 0 % > 40 0 % > 20 0 % > 5 scale (number of brain parcels) percentage of disc o v er y Figure 10: Percen tage of discov ery maps in the three real datasets for all MSTEPS scales. Surface maps show the p ercen tage of connections with a significant effect, for each brain parcel, in resp ectively the SCHIZO, BLIND and MOTOR contrasts. Maps are pro jected onto the MNI 2009 surface. See Figure 9 for volumetric representations sho wing results at the subcortical level in the SCHIZO contrast. co very maps w ere used to select a n umber of seed parcels of in terest, i.e. showing maximal effects (Figure 11). P arcels selected at the highest scales corresp onded to the hipp o campus, anterior cingulate cortex and thalamus. Corresp onding 27 - 1 < - 4 t > 4 1 t t hal am u s hi pp oca m pu s an t e r io r ci ng ul at e 328 7 16 25 55 1 1 4 199 s c a l e (n u m b er o f b r a i n p a r c el s ) z - c o o r d i n a t es (s ter eo t a x i c s p a c e) - 2 0 4 0 10 Figure 11: Group FDR-corrected t -test maps in the SCHIZO dataset, in volumet- ric space. T -test maps show ed significant alterations ( q < 0 . 05 for FDR-BH) in functional connectivity (decreases and increases) in schizophrenia for the 7 MSTEPS scales and several seeds. The seed that included the hipp ocampus, the anterior cingulate and the thalami were shown as stroke white parcels at all scales. Intra-parcel changes in connectivity were thus not shown for seeds (e.g., decreased connectivit y within the basal ganglia). The z MNI coordinates were given for representativ e slices sup erimposed onto the MNI 152 non-linear template. parcels for low er scales w ere selected based on their maximal o verlap with the parcels c hosen at the highest scales. F or instance, the most distributed parcel encompassing the hipp ocampus at scale 7 cov ered the whole medial temp oral lob e, the temp oral pole and ven tral prefrontal cortex. F or eac h brain parcel, a FDR-corrected t -test map asso ciated with the contrast of interest was gener- ated. These t -test maps rev ealed that the alterations in functional coupling in sc hizophrenia essentially took the form of a decrease in connectivity for the hip- p ocampus and asso ciated regions as w ell as for the an terior cingulate cortex and its asso ciated parcel. By contrast, the thalam us and basal ganglia show ed an 28 increase in functional connectivit y with the o ccipital cortex, b ey ond decreased connectivit y within the basal ganglia. Figure 12: Corresp ondence of effects maps across scales for the three real datasets. Correlation matrices sho w pairwise comparisons b etw een 7 or 6 MSTEPS scales of the effects maps for three selected seeds in the SCHIZO dataset and one a priori seed in each of the BLIND and MOTOR dataset. Imp act of sc ale on statistic al maps. While visual exploration of the t -test maps in the SCHIZO dataset revealed similarities of the effects across scales, it also highligh ted some sp ecificities. High scales indeed prov ed in some cases to b e ad- ditionnally informative compared to low scales, despite decreased ov erall detec- tion rate. F or instance, the parcel cen tered on the hipp ocampus was seen to b e more positively connected with the thalam us and caudate n ucleus in sc hizophre- nia only when the v entral prefrontal cortex was not part of the parcel (Figure 11). As another exemple, the thalamus show ed increased connectivity with a large sensorimotor cortical parcel at scale 25 and abov e only , when it was not part of the same parcel as the putamen. F urthemore, the thalamus only sho wed a significant decrease in connectivit y with the dorsolateral prefron tal cortex at scale 55 and abov e, when isolated as a single parcel rather than smo othed out inside the basal ganglia. W e more formally tested the level of corresp ondence of the effects across scales for the three seeds listed ab ov e in the SCHIZO dataset, as well as for seeds matc hing our a priori in the BLIND and MOTOR datasets, resp ectively 29 lo cated in the righ t primary visual cortex and the left primary motor cortex. P airwise comparisons b et ween spatial effect maps across scales mostly revealed p ositiv e correlation v alues in all three datasets and for all seeds (Figure 12). Correlations for the three seeds in v estigated in the SCHIZO contrast were as follo ws: hipp o campus (mean, standard deviation, minimum, maximum = 0.86, 0.06, 0.76, 0.97), anterior cingulate (0.41, 0.39, -0.20, 0.93), and thalam us (0.78, 0.09, 0.64, 0.94). High correlations w ere alw ays observed when comparing high scales (abov e scale 55) betw een them. Comparisons betw een low and high scales remained asso ciated with high correlations v alues for tw o out of the three seeds, namely the hippo campus and thalam us. How ever, results for the an terior cingu- late demonstrated that a low corresp ondence b etw een lo w and high scales w as p ossible. Results for the seeds in the BLIND (0.71, 0.15, 0.46, 0.93) and MO- TOR (0.80, 0.08, 0.70, 0.95) datasets further supp orted the general conclusions dra wn from the SCHIZO dataset. 6. Discussion 6.1. F alse-disc overy r ate within and acr oss sc ales This work inv estigated empirically ho w the scale impacted the results of a GLM analysis on connectomes. W e first assessed the v alidity of a GLM analysis at a single scale. On the three real datasets, there was no sign of substantial departure from the assumptions of a basic parametric GLM. Imp ortan tly , the con trol of the effective FDR within scale on simulations w as exact or conser- v ativ e, including the Cambridge “global null” exp erimen t where real random subgroups were compared. Our empirical ev aluation thus supp orts the v alidity of parametric GLM analysis of connectomes at a single scale. W e also inv estigated the sp ecificit y of MSPC analysis across scales. In most sim ulation exp erimen ts, the con trol of the FDR within eac h scale also implied a tight control of the FDR across scales. Under the global null hypothesis, the omnibus test precisely controlled the FDR (or, equiv alently , the FWE). The omnibus test had little to no impact in scenarios with man y true non-null h yp othesis, where the FDR across scales was conserv atively controlled. The only sim ulations where a deviation of the FDR accross scales from nominal lev els was observ ed (up to 0.09 for a nominal level at 0.05) typically resulted in very few findings, esp ecially at high scales (abov e 50). Considering that the FDR w as alw ays appropriately controlled within scale, our ov erall conclusion was that, for scales matching those used in our simulation exp eriments, the inflation of FDR across scales was not a concern as long as the omnibus test was rejected at an app opriate FWE level. 6.2. Sensitivity acr oss sc ales W e found some conv ergent evidence re garding the sensitivit y of MSPC in our sim ulation and real data experiments. First, on simulations with independent tests, the sensitivity decreased sharply with scale, to reac h a plateau around scale 50. This behaviour appeared to be a consequence of m ultiple testing in the 30 FDR-BH procedure, as the prop ortion of true non-n ull hypothesis and the effect size w ere strictly main tained at a constan t level across scales. In our sim ulations of dep endent tests, the scale directly impacted the effect size, as some test clusters matched b etter the underlying sim ulated signals than others. In this setting, mark ed increase (up to 0.3) in sensitivit y w ere observ ed at certain scales, sometimes quite high (200+). In summary , scale-dep enden t gains in sensitivity w ere observ ed and app eared to b e simultaneously driven by the match b etw een the test clusters and the underlying signal as well as a mechanic effect of multiple comparisons in the FDR-BH pro cedure. On real data, w e in vestigated the disco v ery rate, i.e. the prop ortion of sig- nifican t connections in a connectome. The same b eha viour was observed on the three datasets: highest disco v ery rate at low scale (b elo w 50 parcels), a plateau from 50 to 100 and a low asymptote ab o ve 100-200 parcels. This profile resem- bled most closely the sensitivit y results from sim ulations with indep endent tests, and may reflect some intrinsic prop ert y of the FDR-BH pro cedure. In particular, scales larger than 100, routinely used with the AAL template (Tzourio-Mazoy er et al., 2002), was systematically associated with a m uch smaller disco very rate than lo wer scales (b elow 50). In our three exp erimen ts, we did not iden tify strong discrepancies betw een statistical maps generated at differen t scales, consisten t with the observ ations of Shehzad et al. (2014). This supp orts the idea that, in man y cases a GLM analysis at a single scale may b e enough to summarize the results of a GLM on connectomes. W e observed that effects in some brain parcels were better captured at particular scales. F or example, the difference in thalamic connec- tivit y in the SCHIZO analysis was b etter seen at scale 55 and ab o ve, where the thalami were clustered in one parcel rather than agregated with the putamen and caudate n uclei. 6.3. Sele ction of an “optimal” sc ale The con trol of the FDR across scales, which is cen tral to the proposed MSPC approac h, is only relev ant if the results of a GLM-connectome analysis are in- v estigated and reported at mutiple scales. It would not be advisable to run a MSPC and then simply report results at the scale with the highest disco v ery rate. There w ould be no guarantee that the FDR w ould b e con trolled for a scale that w as selected precisely b ecause of a high asso ciated disco v ery rate, a classic case of circular analysis. If a single scale were considered in an analysis, the selection of this scale should b e either set a priori or selected through MSPC on an indep endent dataset. How ever, as we noted previously , our findings on three exp erimen ts follo w an o verall trend that suggests that a single scale b elow 50 w ould likely b e a better default c hoice than a template at scale 100+, s uc h as AAL (Tzourio-Mazo y er et al., 2002), in terms of discov ery rate. 6.4. Findings on r e al datasets The effects found on the real datasets w ere consisten t with the existing lit- erature. First, schizophrenia has been defined as a dysconnectivity syndrome, 31 with ab erran t functional in teractions b et ween brain regions b eing a core feature of this men tal illness (for reviews, see Calhoun et al., 2009; Pettersson-Y eo et al., 2011; F ornito et al., 2012). As sho wn here for tw o out of three parcels, and observ ed for other unreported brain parcels, widespread decrease in connec- tivit y was observed in patients, with the addition of more lo calized increases in connectivit y . The prominence of decreases in connectivity in the temp oral lob e, hipp ocampus and anterior cingulate cortex, amongst other regions, is well sup- p orted b y previous studies (Williamson and Allman, 2012). Similarly , increased connectivit y b etw een the thalamus and sensorimotor cortex but decreased con- nectivit y with striatal and prefrontal regions has b een reported before (An ticevic et al., 2014). Second, resting-state fMRI studies ha ve previously sho wn that con- genital blindness is ass ociated with a reorganization of the in teractions b etw een the o cciptial cortex and other parts of the brain, in particular the auditory and premotor cortices (Liu et al., 2007; Qin et al., 2013, 2014), consisten t with our findings. Finally , our results are in agreemen t with the observ ation that brain activit y at rest is mo dulated by previous in tensive motor practice (Alb ert et al., 2009; V ahdat et al., 2011; Sami et al., 2014). Even in the absence of a definite ground truth on these real life applications, our findings thus had go od face v alidit y , and suggested that MSPC could b e successfully applied to a v ariet y of clinical or exp erimen tal conditions. 6.5. Comp arison with other metho ds In this w ork, w e only con trolled for multiple comparisons within eac h scale using the FDR-BH metho d, yet sev eral alternative metho ds ha ve recently b een prop osed. Shehzad et al. (2014) dev elopp ed a m ultiv ariate test that applies on a region-to-brain connectivit y map, called multiv ariate distance matrix regression (MDMR). This pro cedure would b e used to screen for promising seed-based connectivit y maps w orthy to explore in a subsequen t, indep enden t analysis. The MDMR approac h effectively p erforms one test per parcel, instead of one test p er connection, and thus greatly alleviates the multiple comparison problem. It do es not ho wev er provide a control of statistical risk at the lev el of single connections. Zalesky et al. (2010a) prop osed to use uncorrected threshold on the individual p -v alues, but then to identify to whic h exten t the connections that surviv e the test are interconnected. This extent measure is compared against what could b e observed under a null hypothesis of no asso ciation, implemented through p erm utation testing. This appro c h, called Netw ork-Based Statistics (NBS), is the connectome equiv alent to the “cluster-level statistics” used in SPMs. The NBS only offers a lo ose con trol of false-p ositive rate at the level of a single connection, but can b e used to reject the p ossibility that a group of significan t findings could be observ ed b y c hance in the FWE sense. Both the MDMR and NBS do not offer control of the FDR within scale, and th us cannot b e used with the MSPC approach based on the argument that the FDR control extends across scales. Some of these methods hav e been compared in a v ariety of scenarios, e.g. FDR-BH and NBS (Zalesky et al., 2012), but at a fixed scale. Based on the observ ation of imp ortan t v ariations in sensitivity across scales for the FDR-BH, an imp ortant a ven ue of future w ork would b e to in vestigate 32 ho w MDMR, NBS and FDR-BH compare at different scales. Of note is the recen t w ork of Mesk aldji et al. (2014), which combines tw o scales to p eform connectome-wide testing: the low scale is used to screen for promising groups of intra- or inter-parcel connections, and the tests at high scale are re-weigh ted based on that screening. The weigh ts can b e adjusted to ensure control of the FDR across the connectome. This alternative approach to multiscale testing is limited to t wo scales, but may provide additional statistical p o wer compared to MSPC as the t w o scales are analyzed in co om bination rather than separately . 6.6. Beyond sc ale sele ction: choic e of the br ain p ar c el lation Although the impact of the n umber of parcels on CW AS sensitivity has been extensiv ely inv estigated in this w ork, we only briefly examined ho w the c hoice of parcels, and not just their n um b er, could impact sensitivit y . W e could, for exam- ple, hav e used random parcellations, lik e (Zalesky et al., 2010b), a parcellation based on anatomical landmarks such as the AAL atlas (Tzourio-Mazoy er et al., 2002), or a functional parcellation with spatial connexit y constraints (Craddock et al., 2012). F rom our results on simulations, it seems clear that dramatic dif- ferences in statistical pow er can b e ac hieved at a given spatial scale, if a set of parcels is best adapted to the spatial distribution of an effect. The work of Crad- do c k et al. (2012) suggested that functional brain parcels are more homogeneous than anatomical parcels. W e b eliev e that imp ortant improv ement in sensitivity could be gained from the optimization of the parcellation scheme, rather than scale, and this represen ts an important a ven ue for future research. F ollowing an idea initially explored in (Thirion et al., 2006), it ma y ev en be possible to relax the constrain t of identical parcels across sub jects, b y matching different individual-sp ecific parcels and use this correspondence to run group-lev el CW AS analysis. 7. Conclusion Our ov erall conclusion is that the MSPC metho d is statistically v alid (spe- cific) and has the p oten tial to iden tify biologically plausible asso ciations in a v ariet y of exp erimen tal conditions. An analysis at a single scale with less than 50 parcels appears as a reasonable default option, likely to ha ve a sensitivity sup erior to the common approach using 100+ brain parcels in many settings. Multiscale analysis still ha ve the potential to iden tify sp ecific effects in small parcels. The MSPC method is av ailable in the NIAK pack age 11 (Bellec et al., 2011), a free and open-source softw are that runs in matlab and GNU o cta ve, and w e also released a set of m ultiscale functional brain parcellations 12 . 11 nitrc.org/projects/niak 12 http://figshare.com/articles/Group_multiscale_functional_template_generated_ with_BASC_on_the_Cambridge_sample/1285615 33 8. Ac knowledgmen ts P arts of this w ork w ere presen ted at the 2012 and 2013 ann ual meetings of the organization for human brain mapping, as well as the International Confer- ence on Resting-State Connectivity 2012 (Magdeburg). The authors are grateful to the members of the 1000 functional connectome consortium for publicly re- leasing the “Cam bridge” and “COBRE” data samples, as well as Dr Shehzad for v aluable feedback. The computational resources used to p erform the data analysis w ere provided b y Compute Canada 13 and CLUMEQ 14 , whic h is funded in part b y NSERC (MRS), F QRNT, and McGill Universit y . This pro ject was funded by NSERC grant num b er RN000028, a salary aw ard from “F onds de rec herche du Qu´ ebec – Sant ´ e” to PB as well as a salary aw ard b y the Canadian Institute of Health Researc h to PO. References Ab ou Elseoud, A., Littow, H., Remes, J., Starc k, T., Nikkinen, J., Nissil¨ a, J., Timonen, M., T ervonen, O., Kiviniemi, V., 2011. Group-ICA Mo del Order Highligh ts Patterns of F unctional Brain Connectivity . F ron tiers in systems neuroscience 5. URL http://dx.doi.org/10.3389/fnsys.2011.00037 Ad-Dab’bagh, Y., Einarson, D., Lyttelton, O., Muehlb oeck, J. S., Mok, K., Iv ano v, O., Vincen t, R. D., Lepage, C., Lerc h, J., F om b onne, E., Ev ans, A. C., 2006. The CIVET Image-Pro cessing Environmen t: A F ully Automated Com- prehensiv e Pip eline for Anatomical Neuroimaging Researc h. In: Corb etta, M. (Ed.), Pro ceedings of the 12th Ann ual Meeting of the Human Brain Mapping Organization. Neuroimage, Florence, Italy . Alb ert, N. B., Robertson, E. M., Miall, R. C., Jun. 2009. The resting h uman brain and motor learning. Curren t biology : CB 19 (12), 1023–1027. URL http://dx.doi.org/10.1016/j.cub.2009.04.028 Alb ouy , G., F ogel, S., King, B. R., Lav en ture, S., Benali, H., Karni, A., Carrier, J., Rob ertson, E. M., Doy on, J., Dec. 2014. Maintaining vs. enhancing motor sequence memories: Resp ectiv e roles of striatal and hipp o campal systems. NeuroImage. URL http://view.ncbi.nlm.nih.gov/pubmed/25542533 Anderson, C. W., Mar. 2002. Quantitativ e Metho ds for Current Environmen tal Issues. Springer. URL http://www.worldcat.org/isbn/1852332948 13 https://computecanada.org/ 14 http://www.clumeq.mcgill.ca/ 34 Anderson, T. W., 1958. An introduction to multiv ariate statistical analysis. Wiley Publications in Statistics. John Wiley and Sons, New Y ork. An ticevic, A., Cole, M. W., Rep o vs, G., Murra y , J. D., Brumbaugh, M. S., Winkler, A. M., Savic, A., Krystal, J. H., Pearlson, G. D., Glahn, D. C., Dec. 2014. Characterizing thalamo-cortical disturbances in schizophrenia and bip olar illness. Cerebral cortex (New Y ork, N.Y. : 1991) 24 (12), 3116–3130. URL http://dx.doi.org/10.1093/cercor/bht165 Barkhof, F., Haller, S., Rom b outs, S. A., Jul. 2014. Resting-state functional MR imaging: a new windo w to the brain. Radiology 272 (1), 29–49. URL http://view.ncbi.nlm.nih.gov/pubmed/24956047 Bellec, P ., Jun. 2013. Mining the Hierarch y of Resting-State Brain Netw orks: Selection of Represe n tative Clusters in a Multiscale Structure. In: P attern Recognition in Neuroimaging (PRNI), 2013 In ternational W orkshop on. pp. 54–57. Bellec, P ., Carb onell, F. M., Perlbarg, V., Lepage, C., Lyttelton, O., F onov, V., Janke, A., T ohk a, J., Ev ans, A. C., 2011. A neuroimaging analysis kit for Matlab and Octav e. In: Pro ceedings of the 17th In ternational Conference on F unctional Mapping of the Human Brain. pp. In Press+. Bellec, P ., La voie-Courc hesne, S., Dic kinson, P ., Lerch, J. P ., Zijdenbos, A. P ., Ev ans, A. C., 2012. The pip eline system for Octa ve and Matlab (PSOM): a ligh tw eight scripting framework and execution engine for scien tific workflo ws. F ron tiers in neuroinformatics 6. URL http://dx.doi.org/10.3389/fninf.2012.00007 Bellec, P ., P erlbarg, V., Jbab di, S., P ´ el´ egrini-Issac, M., An ton, J., Doy on, J., Benali, H., F eb. 2006. Iden tification of large-scale netw orks in the brain using fMRI. NeuroImage 29 (4), 1231–1243. URL http://dx.doi.org/10.1016/j.neuroimage.2005.08.044 Bellec, P ., Rosa-Neto, P ., Lyttelton, O. C., Benali, H., Ev ans, A. C., Jul. 2010. Multi-lev el b ootstrap analysis of stable clusters in resting-state fMRI. Neu- roImage 51 (3), 1126–1139. URL http://dx.doi.org/10.1016/j.neuroimage.2010.02.082 Benjamini, Y., Ho c hberg, Y., 1995. Controlling the false-discov ery rate: a prac- tical and p o werful approac h to multiple testing. J. Ro y . Statist. So c. Ser. B 57, 289–300. Benjamini, Y., Y ekutieli, D., 2001. The Control of the F alse Discov ery Rate in Multiple T esting under Dependency. The Annals of Statistics 29 (4), 1165– 1188. URL http://dx.doi.org/10.2307/2674075 35 Bisw al, B. B., Mennes, M., Zuo, X.-N. N., Gohel, S., Kelly , C., Smith, S. M., Bec kmann, C. F., Adelstein, J. S., Buc kner, R. L., Colcom b e, S., Dogonowski, A.-M. M., Ernst, M., F air, D., Hampson, M., Hoptman, M. J., Hyde, J. S., Kiviniemi, V. J., K¨ otter, R., Li, S.-J. J., Lin, C.-P . P ., Lo we, M. J., Mac k ay , C., Madden, D. J., Madsen, K. H., Margulies, D. S., Mayberg, H. S., McMa- hon, K., Monk, C. S., Mostofsky , S. H., Nagel, B. J., P ek ar, J. J., Peltier, S. J., P etersen, S. E., Riedl, V., Rom b outs, S. A., Rypma, B., Sc hlaggar, B. L., Sc hmidt, S., Seidler, R. D., Siegle, G. J., Sorg, C., T eng, G.-J. J., V eijola, J., Villringer, A., W alter, M., W ang, L., W eng, X.-C. C., Whitfield-Gabrieli, S., Williamson, P ., Windisch b erger, C., Zang, Y.-F. F., Zhang, H.-Y. Y., Castel- lanos, F. X., Milham, M. P ., Mar. 2010. T ow ard disco very science of h uman brain function. Pro ceedings of the National Academy of Sciences of the United States of America 107 (10), 4734–4739. URL http://dx.doi.org/10.1073/pnas.0911855107 Blumensath, T., Jbab di, S., Glasser, M. F., V an Essen, D. C., Ugurbil, K., Behrens, T. E. J., Smith, S. M., Aug. 2013. Spatially constrained hierarchical parcellation of the brain with resting-state fMRI. NeuroImage 76, 313–324. URL http://dx.doi.org/10.1016/j.neuroimage.2013.03.024 Calhoun, V. D., Eichele, T., P earlson, G., 2009. F unctional brain netw orks in sc hizophrenia: a review. F ron tiers in h uman neuroscience 3. URL http://dx.doi.org/10.3389/neuro.09.017.2009 Castellanos, F. X., Di Martino, A., Craddo c k, R. C., Mehta, A. D., Milham, M. P ., Oct. 2013. Clinical applications of the functional connectome. Neu- roImage 80, 527–540. URL http://dx.doi.org/10.1016/j.neuroimage.2013.04.083 Collignon, O., V andewalle, G., V oss, P ., Alb ouy , G., Charb onneau, G., Las- sonde, M., Lep ore, F., Mar. 2011. F unctional sp ecialization for auditory- spatial processing in the occipital cortex of congenitally blind humans. Pro- ceedings of the National Academ y of Sciences of the United States of America 108 (11), 4435–4440. URL http://dx.doi.org/10.1073/pnas.1013928108 Collins, D. L., Ev ans, A. C., 1997. Animal: v alidation and applications of nonlin- ear registration-based segmentation. International Journal of Pattern Recog- nition and Artificial In telligence 11, 1271–1294. Craddo c k, R. C., James, G. A., Holtzheimer, P . E., Hu, X. P ., Ma yb erg, H. S., Aug. 2012. A whole brain fMRI atlas generated via spatially constrained sp ectral clustering. Human brain mapping 33 (8), 1914–1928. URL http://dx.doi.org/10.1002/hbm.21333 Damoiseaux, J. S., Rombouts, S. A. R. B., Barkhof, F., Scheltens, P ., Stam, C. J., Smith, S. M., Beckmann, C. F., Sep. 2006. Consisten t resting-state net works across healthy sub jects. Pro ceedings of the National Academy of 36 Sciences 103 (37), 13848–13853. URL http://dx.doi.org/10.1073/pnas.0601417103 De Luca, M., Beckmann, C. F., De Stefano, N., Matthews, P . M., Smith, S. M., F eb. 2006. fMRI resting state netw orks define distinct mo des of long-distance in teractions in the human brain. NeuroImage 29 (4), 1359–1367. URL http://dx.doi.org/10.1016/j.neuroimage.2005.08.035 Efron, B., Mar. 2008. Simultaneous inference: When should hypothesis testing problems b e combined? Annals of Applied Statistics 2 (1), 197–223. URL http://dx.doi.org/10.1214/07- aoas141 F ono v, V., Ev ans, A. C., Botteron, K., Almli, C. R., McKinstry , R. C., Collins, D. L., Jan. 2011. Unbiased a verage age-appropriate atlases for p ediatric stud- ies. NeuroImage 54 (1), 313–327. URL http://dx.doi.org/10.1016/j.neuroimage.2010.07.033 F ornito, A., Zalesky , A., Pan telis, C., Bullmore, E. T., Oct. 2012. Schizophrenia, neuroimaging and connectomics. NeuroImage 62 (4), 2296–2314. URL http://view.ncbi.nlm.nih.gov/pubmed/22387165 F o x, M. D., Greicius, M., 2010. Clinical applications of resting state functional connectivit y . F rontiers in systems neuroscience 4. URL http://dx.doi.org/10.3389/fnsys.2010.00019 Gio ve, F., Gili, T., Iacov ella, V., Macaluso, E., Maraviglia, B., Oct. 2009. Images-based suppression of unw anted global signals in resting-state func- tional connectivit y studies. Magnetic resonance imaging 27 (8), 1058–1064. URL http://dx.doi.org/10.1016/j.mri.2009.06.004 Gordon, E. M., Laumann, T. O., Adeyemo, B., Huc kins, J. F., Kelley , W. M., P etersen, S. E., Oct. 2014. Generation and Ev aluation of a Cortical Area P ar- cellation from Resting-State Correlations. Cerebral cortex (New Y ork, N.Y. : 1991), bh u239+. URL http://dx.doi.org/10.1093/cercor/bhu239 Jafri, M. J., Pearlson, G. D., Stev ens, M., Calhoun, V. D., F eb. 2008. A metho d for functional net work connectivit y among spatially independent resting-state comp onen ts in schizophrenia. NeuroImage 39 (4), 1666–1681. URL http://dx.doi.org/10.1016/j.neuroimage.2007.11.001 Liu, H., Stuffleb eam, S. M., Sepulcre, J., Hedden, T., Buckner, R. L., Dec. 2009. Evidence from intrinsic activit y that asymmetry of the human brain is controlled by multiple factors. Pro ceedings of the National Academy of Sciences 106 (48), 20499–20503. URL http://dx.doi.org/10.1073/pnas.0908073106 Liu, Y., Y u, C., Liang, M., Li, J., Tian, L., Zhou, Y., Qin, W., Li, K., Jiang, T., Aug. 2007. Whole brain functional connectivity in the early blind. Brain 37 130 (8), 2085–2096. URL http://dx.doi.org/10.1093/brain/awm121 Lu, Y., Jiang, T., Zang, Y., Sep. 2003. Region growing metho d for the analysis of functional MRI data. NeuroImage 20 (1), 455–465. URL http://dx.doi.org/10.1016/s1053- 8119(03)00352- 5 Marrelec, G., Bellec, P ., Krainik, A., Duffau, H., P´ el´ egrini-Issac, M., Leh´ ericy , S., Benali, H., Doy on, J., F eb. 2008. Regions, systems, and the brain: Hier- arc hical measures of functional integration in fMRI. Medical image analysis. URL http://dx.doi.org/10.1016/j.media.2008.02.002 Marrelec, G., Krainik, A., Duffau, H., P ´ el´ egrini-Issac, M., Leh´ ericy , S., Doy on, J., Benali, H., 2006. P artial correlation for functional brain interactivit y in- v estigation in functional MRI. NeuroImage 32 (1), 228–237. URL http://dx.doi.org/10.1016/j.neuroimage.2005.12.057 Mesk aldji, D. E., Fischi-Gomez, E., Griffa, A., Hagmann, P ., Morgen thaler, S., Thiran, J.-P ., Oct. 2013. Co mparing connectomes across sub jects and p opulations at different scales. NeuroImage 80, 416–425. URL http://dx.doi.org/10.1016/j.neuroimage.2013.04.084 Mesk aldji, D.-E., V asung, L., Romascano, D., Thiran, J.-P ., Hagmann, P ., Mor- gen thaler, S., V an De Ville, D., Dec. 2014. Improv ed statistical ev aluation of group differences in connectomes b y screeningfiltering strategy with ap- plication to study maturation of brain connections b etw een childhoo d and adolescence. NeuroImage. URL http://dx.doi.org/10.1016/j.neuroimage.2014.11.059 P ettersson-Y eo, W., Allen, P ., Benetti, S., McGuire, P ., Mec helli, A., Apr. 2011. Dysconnectivity in schizophrenia: where are we now? Neuroscience and biob eha vioral reviews 35 (5), 1110–1124. URL http://view.ncbi.nlm.nih.gov/pubmed/21115039 P ow er, J. D., Barnes, K. A., Snyder, A. Z., Sc hlaggar, B. L., Petersen, S. E., F eb. 2012. Spurious but systematic correlations in functional connectivity MRI net w orks arise from sub ject motion. NeuroImage 59 (3), 2142–2154. URL http://dx.doi.org/10.1016/j.neuroimage.2011.10.018 Qin, W., Liu, Y., Jiang, T., Y u, C., 2013. The dev elopment of visual areas dep ends differently on visual exp erience. PloS one 8 (1). URL http://view.ncbi.nlm.nih.gov/pubmed/23308283 Qin, W., Xuan, Y., Liu, Y., Jiang, T., Y u, C., Mar. 2014. F unctional Connec- tivit y Density in Congenitally and Late Blind Sub jec ts. Cerebral cortex (New Y ork, N.Y. : 1991). URL http://view.ncbi.nlm.nih.gov/pubmed/24642421 38 Ro yston, P ., 1993. A T o olkit for T esting for Non-Normalit y in Complete and Censored Samples. Journal of the Roy al Statistical So ciet y . Series D (The Statistician) 42 (1), 37–43. Sami, S., Rob ertson, E. M., Miall, R. C., Mar. 2014. The time course of task- sp ecific memory consolidation effects in resting state net works. The Journal of neuroscience : the official journal of the Society for Neuroscience 34 (11), 3982–3992. URL http://dx.doi.org/10.1523/jneurosci.4341- 13.2014 Shehzad, Z., Kelly , C., Reiss, P . T., Cameron Craddo c k, R., Emerson, J. W., McMahon, K., Copland, D. A., Xa vier Castellanos, F., Milham, M. P ., Jun. 2014. A m ultiv ariate distance-based analytic framework for connectome-wide asso ciation studies. NeuroImage 93, 74–94. URL http://dx.doi.org/10.1016/j.neuroimage.2014.02.024 Smith, S. M., Miller, K. L., Salimi-Khorshidi, G., W ebster, M., Beckmann, C. F., Nic hols, T. E., Ramsey , J. D., W o olric h, M. W., Jan. 2011. Netw ork mo delling metho ds for FMRI. NeuroImage 54 (2), 875–891. URL http://dx.doi.org/10.1016/j.neuroimage.2010.08.063 Thirion, B., Flandin, G., Pinel, P ., Ro c he, A., Ciuciu, P ., Poline, J.-B. B., Aug. 2006. Dealing with the shortcomings of spatial normalization: multi-sub ject parcellation of fMRI datasets. Human brain mapping 27 (8), 678–693. URL http://dx.doi.org/10.1002/hbm.20210 Thirion, B., V aro quaux, G., Dohmatob, E., Poline, J.-B. B., 2014. Which fMRI clustering giv e s go o d brain parcellations? F rontiers in neuroscience 8. URL http://view.ncbi.nlm.nih.gov/pubmed/25071425 Tzourio-Mazo yer, N., Landeau, B., P apathanassiou, D., Crivello, F., Etard, O., Delcroix, N., Mazo yer, B., Joliot, M., Jan. 2002. Automated anatomical lab eling of activ ations in SPM using a macroscopic anatomical parcellation of the MNI MRI single-sub ject brain. NeuroImage 15 (1), 273–289. URL http://dx.doi.org/10.1006/nimg.2001.0978 V ahdat, S., Darain y , M., Milner, T. E., Ostry , D. J., No v. 2011. F unctionally sp ecific changes in resting-state sensorimotor netw orks after motor learning. The Journal of neuroscience : the official journal of the So ciety for Neuro- science 31 (47), 16907–16915. URL http://view.ncbi.nlm.nih.gov/pubmed/22114261 W ang, K., Liang, M., W ang, L., Tian, L., Zhang, X., Li, K., Jiang, T., Oct. 2007. Altered functional connectivity in early Alzheimer’s disease: A resting- state fMRI study. Hum. Brain Mapp. 28 (10), 967–978. URL http://dx.doi.org/10.1002/hbm.20324 White, H., 1980. A heteroskedasticit y-consistent cov ariance matrix estimator and a direct test for heterosk edasticity . Econometrica: Journal of the Econo- metric So ciet y , 817–838. 39 Williamson, P . C., Allman, J. M., 2012. A framework for in terpreting functional net works in schizophrenia. F rontiers in human neuroscience 6. URL http://dx.doi.org/10.3389/fnhum.2012.00184 W orsley , K. J., Cao, J., Paus, T., Petrides, M., Ev ans, A. C., 1998. Applications of random field theory to functional connectivit y . Hum Brain Mapp 6 (5-6), 364–367. URL http://view.ncbi.nlm.nih.gov/pubmed/9788073 W orsley , K. J., F riston, K. J., Sep. 1995. Analysis of fMRI Time-Series Revis- itedAgain. NeuroImage 2 (3), 173–181. URL http://dx.doi.org/10.1006/nimg.1995.1023 Zalesky , A., Cocchi, L., F ornito, A., Murray , M. M., Bullmore, E., Apr. 2012. Connectivit y diffe rences in brain netw orks. NeuroImage 60 (2), 1055–1062. URL http://dx.doi.org/10.1016/j.neuroimage.2012.01.068 Zalesky , A., F ornito, A., Bullmore, E. T., Dec. 2010a. Net work-based statistic: Iden tifying differences in brain netw orks. NeuroImage 53 (4), 1197–1207. URL http://dx.doi.org/10.1016/j.neuroimage.2010.06.041 Zalesky , A., F ornito, A., Harding, I. H., Co cchi, L., Y ¨ ucel, M., Pan telis, C., Bullmore, E. T., Apr. 2010b. Whole-brain anatomical netw orks: Do es the c hoice of no des matter? NeuroImage 50 (3), 970–983. URL http://dx.doi.org/10.1016/j.neuroimage.2009.12.027 40 App endix A. F unctional connectomes Let {P i , i = 1 . . . R } b e a partition of the brain, i.e. R parcels suc h that any v oxel in the grey matter belongs to one and only one a parcel. The n umber of parcels R is the (spatial) scale of the partition. F or an fMRI dataset with T time samples, the a verage time series w i (v ector of length T ) is generated for eac h parcel P . These av erage time series are then used to generate a R × R matrix of functional connectivit y Y = ( y i,j ) R i,j =1 : y ij = F (corr( w i , w j )) , with F ( r ) = 1 2 log 1 − r 1 + r , (A.1) where corr is P earson’s linear correlation co efficien t and F is the Fisher’s trans- form. The Fisher’s transform is used to stabilize the v ariance of the estimated correlation co efficient (Anderson, 1958). This measure of b et ween-parcel con- nectivit y was used for i 6 = j , but we also included a measure of within-cluster a verage functional connectivity , which uses the vo xel-level time series w v : y ii = F 1 # P i (# P i − 1) X v ,v 0 ∈P i ,v 6 = v 0 corr( w v , w v 0 ) . (A.2) App endix B. Ordinary least square GLM estimation The indep enden t and homoscedastic assumption means that the co efficients of E are indep endent from eac h other and that for eac h connection l , the ( e n,l ) N n =1 co efficien ts are identically distributed with a zero mean and v ariance σ 2 l . In this context, the maximum likelihoo d (ordinary least-squares) estimator of B is: ˆ B = ( X 0 X ) − 1 X 0 Y , (B.1) and the estimation of the v ariance of the noise is: ˆ σ 2 l = 1 N − C X n =1 ,...,N ˆ e 2 n,l , with ˆ E = Y − X ˆ B . (B.2) F or eac h co v ariate c , the v ector ( ˆ β c,l ) L l =1 is a v ectorized connectome of statistical parameters, quan tifying the mo dulation of each connection l b y the cov ariate c . This is a direct generalization of the concept of a SPM that has b een widely used in task-based fMRI analysis. Eac h column of the statistical parametric connectome is a actually a SPM at the parcel level (instead of the more standard v oxel lev el), testing the mo dulation of the functional conn ectivit y of a giv en seed region with the rest of the brain by the cov ariate of interest. It is possible to test the signficance of eac h elemen t of the statistical parametric connectome ˆ β c,l against the null hypothesis ( H 0 ) of no asso ciation (i.e. β c,l = 0), using a t -test: t l = ( δ 0 c ˆ B l ) ˆ σ l p δ 0 c ( X 0 X ) − 1 δ c − 1 , (B.3) 41 where δ c is a con trast (column) vector, with δ d equals 1 for ( d = c ) and 0 otherwise. Under ( H 0 ), the quantit y t l follo ws a Studen t’s t distribution with N − C degrees of freedom. By comparing t l with the cumulativ e distribution function g N − C of the Student’s distribution, it is p ossible to deriv e the bilateral probabilit y of observing t l under ( H 0 ): p l = 2 (1 − g N − C ( | t l | )) . (B.4) App endix C. Benjamini-Ho c hberg and group false-disco very rate F or a given metho d of selection of significant discov eries, let D F b e the n umber of false p ositiv e and D T the num b er of true p ositive. The FDR q is the mathematical expectation of the ratio betw een the n um b er of false discov eries and the total num b er of discov eries D F / ( D F + D T ) (with the usual conv ention that 0 / 0 = 0). The classic BH pro cedure was used to control the FDR. Let’s first assume that the p v alues hav e been sorted in ascending order, suc h that p l ≤ p l +1 . The BH pro cedure is built on an estimate ˆ q ( p l ) of the false-p ositiv e rate, equal to Lp l /l . The p l v alues are screened to find the largest m such that ˆ q ( p l ) ≤ α . If such an integer does not exist, there are no disco v eries. Otherwise, all connections l ≤ m are considered as significant. App endix D. Generation of statistical parametric connectomes under the global null h yp othesis Let Y ( s ) b e the (sub jects x connections) matrix of individual connectomes at scale s . A replication of the connectome matrix under the global n ull h yp othesis ( G 0 ) is generated by recomposing the linear mixture while excluding the c -th co v ariate of interest, tested by the model. F ormally , let X ¯ c b e the reduced mo del where the c th co v ariate has b een remov ed from the (sub jects x cov ariates) matrix X . Let ˆ B ( s ) ¯ c b e the ordinary least square estimate of the regression co efficients using the reduced mo del. Each p erm utation sample of the dataset is generated as describ ed in (Anderson, 2002): Y ( s, ∗ ) = X ¯ c ˆ B ( s ) ¯ c + ˆ E ( s, ∗ ) . (D.1) where ˆ E ( s, ∗ ) is a replication of the residuals of the regression of the reduced mo del, with p erm uted ro ws (sub jects). The GLM pro cedure is then imple- men ted with the Y ( s, ∗ ) and the full mo del X to generate a replication V ( ∗ ) s of the v olume of disco veries at scale s under ( G 0 ). Because the same dataset at vo xel resolution is used to generate all the connectome datasets ( Y ( s ) ) s , the samples V ( ∗ ) s are not indep endent. In order to resp ect these dep endencies, for an y given replication, the same p ermutation of the sub jects is used to generate to all of the ( ˆ E ( s, ∗ ) ) s . The replication of the total v olume of discov eries V ( ∗ ) is then simply the sum of V ( ∗ ) s for all s . This pro cedure is rep eated B times in order to generate B replications ( V ( ∗ b ) ) B b =1 of 42 the total v olume of disco veries under ( G 0 ). The Mon te-Carlo estimation of the probabilit y to observe a greater total volume of discov eries under ( G 0 ) than the actual total volume of disco veries V generated on the original (non-p ermuted) dataset is then: Pr( V ( ∗ ) ≥ V |G 0 ) . = # n b = 1 , . . . , B | V ( ∗ b ) ≥ V o /B . (D.2) where . = means that the tw o terms are asymptotically equal as B tends tow ard infinit y . 43 Supplementary Material – Multisc ale statistic al testing for c onne ctome-wide asso ciation studies in fMRI Submitted to Neuroimage. P . Bellec 1 , 2 , Y. Benha jali 1 , 3 , F. Carb onell 4 , C. Dansereau 1 , 2 , G. Alb ouy 1 , 5 , M. P elland 5 , C. Craddo c k 6 , 7 , O. Collignon 5 , J. Do y on 1 , 5 , E. Stip 8 , 9 , P . Orban 1 , 8 1 F unctional Neuroimaging Unit, Centre de Rec herche de l’Institut Universitaire de G ´ eriatrie de Mon tr ´ eal 2 Departmen t of Computer Science and Operations Researc h, Universit y of Mon- treal, Mon trea l, Queb ec, Canada 3 Departmen t of Anthropology , Univ ersity of Montreal, Montreal, Quebec, Canada 4 Biosp ectiv e Incorp orated, Montreal, Queb ec, Canada 5 Departmen t of Psychology , Universit y of Montreal, Montreal, Queb ec, Canada 6 Nathan Kline Institute for Psychiatric Research, Orangeburg, NY, United States of America 7 Cen ter for the Developing Brain, Child Mind Institute, New Y ork, NY, United States of America 8 Departmen t of Psychiatry , Universit y of Montreal, Montreal, Queb ec, Canada 9 Cen tre Hospitalier de l’Universit ´ e de Montr ´ eal, Montreal, Queb ec, Canada F or all questions regarding the pap er, please address corresp ondence to Pierre Bellec, CRIUGM, 4545 Queen Mary , Montreal, QC, H3W 1W5, Canada. Email: pierre.b ellec (at) criugm.qc.ca. 44 Figure S13: Nominal vs effectiv e FDR on simulations with independent tests and v ariable K ( L k = 1000 for all k ). The effective FDR is plotted against the nominal FDR within eac h family (blue plots), across all families (green plots) and across all families, combined with an omnibus test for rejection of the global null hypothesis (red plot). The exp ected (nominal) v alues are represented in black plots, corresp onding to the four tested FDR levels: 0 . 01 , 0 . 05 , 0 . 1 , 0 . 2. A v ariable n umber of families of tests were inv estigated, K ∈ { 2 , 5 , 10 } for panels a , b and c , resp ectiv ely . Each column corresponds to a certain prop ortion of non-null hypothesis p er family π 1 (0% , 1% , 2% , 5% , 10%), and each row corresponds to a different effect size θ (2 , 3 , 5), see text for details. Please note that in the presence of strong signal (large θ and/or π 1 ), the omnibus test is always rejected, and the green plot matches p erfectly the red plot, which b ecomes invisible. 45 Figure S14: Nominal vs effective FDR on simulations with indep enden t tests and v ariable ( L k ) k ( K = 5 ). The effective FDR is plotted against the nominal FDR within each family (blue plots), across all families (green plots) and across all families, combined with an omnibus test for rejection of the global null hypothesis (red plot). The expected (nominal) v alues are represented in black plots, corresp onding to the four tested FDR levels: 0 . 01 , 0 . 05 , 0 . 1 , 0 . 2. A variable num b er of tests p er family were inv estigated, L k ∈ { 100 , 1000 , 10000 } for panels a , b and c , resp ectiv ely . Each column corresponds to a certain prop ortion of non-null hypothesis p er family π 1 (0% , 1% , 2% , 5% , 10%), and each row corresponds to a different effect size θ (2 , 3 , 5), see text for details. Please note that in the presence of strong signal (large θ and/or π 1 ), the omnibus test is always rejected, and the green plot matches p erfectly the red plot, which b ecomes invisible. 46 Figure S15: Nominal vs effective FDR on simulations with indep enden t tests, ( L k ) k corresp onding to the n umber of connections asso ciated with a regular grid of scales cov ering 10 to either 50 (a), 100 (b) or 300 (c) with a step of 10). The effective FDR is plotted against the nominal FDR within each family (blue plots), across all families (green plots) and across all families, combined with an omnibus test for rejection of the global null hypothesis (red plot). The exp ected (nominal) v alues are represented in black plots, corresp onding to the four tested FDR levels: 0 . 01 , 0 . 05 , 0 . 1 , 0 . 2. Eac h column corresp onds to a certain prop ortion of non-null hypothesis p er family π 1 (0% , 1% , 2% , 5% , 10%), and each row corresp onds to a different effect size θ (2 , 3 , 5), see text for details. Please note that in the presence of strong signal (large θ and/or π 1 ), the omnibus test is alwa ys rejected, and the green plot matches p erfectly the red plot, which b ecomes invisible. 47 Figure S16: Sensitivity on simulations with indep enden t tests ( K = 30 , L k ranging from 55 to 45150 , corresponding to the num b er of connections asso ciated with a regular grid of scales cov ering 10 to 300 with a step of 10). The sensitivity is plotted as a function of scales at four tested (within-scale) FDR levels: 0 . 01 , 0 . 05 , 0 . 1 , 0 . 2. A test is only considered as significant if in addition an omnibus test against the global null hypothesis across scales as b een rejected at p < 0 . 05. Each column corresp onds to a certain prop ortion of non-null hypothesis p er family π 1 (0% , 1% , 2% , 5% , 10%), and each row corresp onds to a different effect size θ (2 , 3 , 5), see text for details. 48 ab sol ute cor r e la t i on m a t r i x for on e sub je ct at m a xim a l r eso lu t i on ( ~4 50 r e gio ns) r eg io ns r eg io ns r eg io ns r eg io ns or i gi na l t i m e ser i es tim e ser i es aft e r b oo t str ap tim e ser i es aft e r b oo t str ap a nd sim u la t e d ef fect i n on e ne t w or k 0 100 200 300 400 0 1 00 20 0 3 00 4 00 0 100 200 300 400 0 1 00 20 0 3 00 4 00 0 100 200 300 400 0 1 00 20 0 3 00 4 00 0 1 0 1 0 1 Figure S17: Data generation pro cedure for simulations. A hierarc hical clustering applied on a group av erage connectome ( n = 198) was used to define partitions at multiple scales. A 7-cluster solution is presented as white squares outlining intra-clusters connections, superimp osed on an individual connectome with rows/columns reordered based on the group hierarch y (left panel). A circular blo c k b o otstrap sc heme is used to resample the original time series. Identical time blocks are used within each cluster, thus preserving intra-cluster connectivity . Indep endent time blocks are used b et ween clusters, th us setting in ter-parcel connectivity to zero (middle panel). A single simulated time series is added to all the regions belonging to one selected cluster, thus increasing the intra-parcel connectivity (right panel). MOTOR K 10 20 40 90 170 270 L 7 16 36 72 153 297 M 7 14 35 72 154 308 BLIND K 10 20 50 90 180 280 L 7 18 40 81 162 308 M 7 16 40 77 165 313 SCHIZO K 10 20 30 60 120 210 270 L 7 14 27 54 108 189 324 M 7 16 25 55 114 199 328 T able S2: Summary of the scales selected by MSTEPS on the real data samples. Three pa- rameters were selected by MSTEPS at each scale: K was the num b er of individual clusters, identical for all sub jects; L was the num ber of group clusters, used to compute the group stability matrix in BASC; M was the num b er of final clusters for the group consensus cluster analysis. The effective number of clusters in the group template is M . The t wo other param- eters ( K and L ) are used in intermediate computation of the m ulti-level BASC. See details of the parameters of the MSTEPS pro cedure in the main text. 49 Figure S18: Impact of sim ulated changes on multiscale connectomes. The left column presents an individual connectome, after circular blo c k resampling, at m ultiple scales (4, 7, 30, 100). The middle column shows the same connectome after a signal was injected in all regions b elonging to one of the clusters at scale 7. The right column is the difference between the middle and the left column. Note how the main and only significant differences are concentrated in the connections that linked clusters that are either sub clusters of the cluster of reference, or include the cluster of reference, as outlined by a white square. 50 Figure S19: P ercentage of true p ositiv e and effect size as a function of scale in the v arious simulation scenarios. Panel a shows the p ercen tage of true p ositives in the simulation as a function of scale, for different choices of scale and cluster of reference. P anel b sho ws the av erage effect size over all true positives, for tw o choices of the parameter a 2 and the same choices of scale and cluster of references as in panel a . The effect size is plotted for simulations where the test and ground truth clusters exactly matched (blue curve) as well as for simulations where a p erturbation of the reference cluster was applied (red curve). 51 Figure S20: Nominal vs effectiv e FDR on sim ulations with dep enden t tests ( K = 7 , L k in (28 , 136 , 325 , 1540 , 6555 , 19900 , 53956) , corresponding to the num b er of connections asso ciated with the scales selected by MSTEPS on the SCHIZO dataset). The effective FDR is plotted against the nominal FDR within each family (blue plots), across all families (green plots) and across all families, combined with an omnibus test for rejection of the global null hypothesis (red plot). The exp ected (nominal) v alues are represented in blac k plots, corresponding to the four tested FDR levels: 0 . 01 , 0 . 05 , 0 . 1 , 0 . 2. Each column corresp onds to a certain prop ortion of non-null hypothesis per family π 1 (about 0% , 1% , 2% , 5% , 10%), and eac h ro w corresponds to a com bination of a different effect size, a 2 in { 0 . 1 , 0 . 2 } , and num b er of sub jects, N in { 20 , 50 } , see text for details. Please note that in the presence of strong signal (large a 2 , N and/or π 1 ), the omnibus test is alwa ys rejected, and the green plot matches p erfectly the red plot, which b ecomes invisible. 52 Figure S21: T est on the normality of the distribution of residuals in a GLM- connectome analysis. Distribution (normalized histogram) of p -v alues derived using the Shapiro-Wilk parametric hypothesis test of composite normality across all connections in v arious GLM-connectome analyses, at the highest scale (300+) selected b y MSTEPS. Note that for Cambridge, random groups of equal size were compared, for different sample sizes. In the absence of a deviation of Gaussian resiudals, the histogram would b e flat (equal to 1). Although some trend to wards a departure can clearly be seen, with an excess of small p -v alues in the distribution, no p -v alue reaches significance after correction of multiple comparisong using the FDR-BH pro cedure at q < 0 . 05. 53 Figure S22: T est on the homoscedasticit y of residuals in a GLM-connectome analy- sis. Distribution (normalized histogram) of p -v alues deriv ed using White’s test of homoscedas- tic residuals across all connections in v arious GLM-connectome analyses, at the highest scale (300+) selected b y MSTEPS. Note that for Cambridge, random groups of equal size were compared, for different sample sizes. Due to the random nature of grouping, the residuals in the Cambridge contrasts are homoscedastic, and the exp ected histogram is flat (equal to 1). The analysis on the BLIND, MOTOR and SCHIZO datasets resulted in histograms similar to those observ ed on the Cambridge sample, for different sample sizes. No p -v alue reaches significance after correction of multiple comparisong using the FDR-BH pro cedure at q < 0 . 05. 54
Original Paper
Loading high-quality paper...
Comments & Academic Discussion
Loading comments...
Leave a Comment