Geological interpretation of Mount Ciremai geothermal system from remote sensing and magneto-teluric analysis
The exploration of geothermal system at Mount Ciremai has been started since the early 1980s and has just been studied carefully since the early 2000s. Previous studies have detected the potential of geothermal system and also the groundwater mechanism feeding the system. This paper will discuss the geothermal exploration based on regional scale surface temperature analysis with Landsat image to have a more detail interpretation of the geological setting and magneto-telluric or MT survey at prospect zones, which identified by the previous method, to have a more exact and in depth local scale structural interpretation. Both methods are directed to pin point appropriate locations for geothermal pilot hole drilling and testing. We used four scenes of Landsat Enhanced Thematic Mapper or ETM+ data to estimate the surface manifestation of a geothermal system. Temporal analysis of Land Surface Temperature or LST was applied and coupled with field temperature measurement at seven locations. By combining the TTM with NDVI threshold, the authors can identify six zones with surface temperature anomaly. Among these six zones, three zones were interpreted to have a relation with geothermal system and the other three zones were related to human activities. Then, MT survey was performed at the three geothermal prospects identified from previous remote sensing analysis, at the east flank of the volcano, to estimate the detail subsurface structures. The MT survey successfully identified four buried normal faults in the area, which positively are a part of the conduits in the geothermal system east of Mount Ciremai. From MT analysis, the author also found the locations of volcanic zone, bedrock zone, and the prospect zone. The combination of Landsat analysis on regional scale and MT measurement on a more detail scale has proven to be the reliable method to map geothermal prospect area.
💡 Research Summary
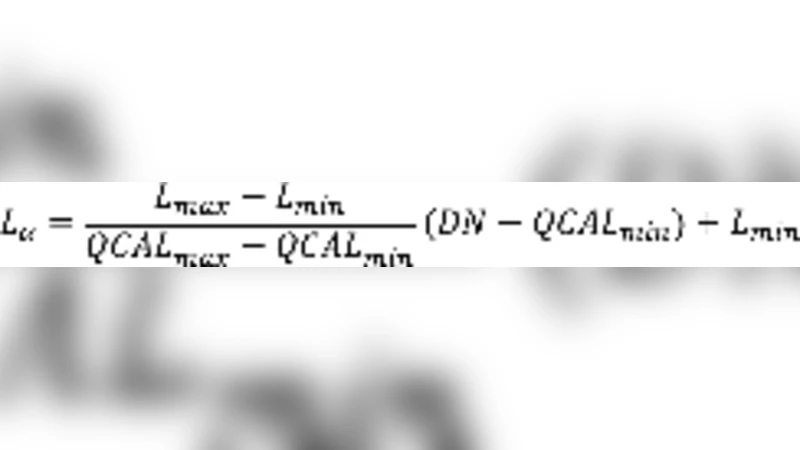
The paper presents an integrated geothermal exploration workflow for Mount Ciremai, Indonesia, combining regional‑scale remote sensing with local‑scale magnetotelluric (MT) surveying to pinpoint optimal drilling sites. The authors begin by processing four Landsat 7 Enhanced Thematic Mapper Plus (ETM+) scenes (1999‑2002) to derive land‑surface temperature (LST) maps. Atmospheric correction, emissivity adjustment, and radiative transfer calculations convert raw thermal bands into absolute temperature values. Simultaneously, Normalized Difference Vegetation Index (NDVI) is computed for each scene; a threshold of NDVI ≤ 0.3 isolates sparsely vegetated or non‑vegetated surfaces, reducing false positives caused by vegetation cooling. Temperature anomalies are defined as pixels exceeding the regional mean LST by at least 2 °C. This dual‑criteria approach yields six anomalous zones. Ground‑based temperature measurements at seven field points validate the satellite results, confirming that three of the six zones are linked to geothermal activity, while the remaining three correspond to anthropogenic heat sources such as industrial facilities, roads, or irrigation systems.
Guided by the remote‑sensing results, the authors conduct MT surveys over the three geothermal prospects located on the east flank of the volcano. MT data are collected across a broad frequency band (0.01 Hz–10 kHz), providing both resistivity and phase information. The data are inverted using a combination of Occam’s regularized inversion and a structurally constrained three‑dimensional inversion, allowing the reconstruction of a high‑resolution conductivity model. The MT interpretation reveals four buried normal faults dipping eastward at depths of 1.2–2.5 km. These faults are interpreted as conduits that channel deep, hot fluids toward the surface, thereby explaining the surface temperature anomalies identified from satellite imagery. The conductivity model also delineates three distinct geological domains: a high‑conductivity volcanic zone (indicative of fractured basaltic units), a low‑conductivity bedrock zone (likely intrusive or metamorphic rocks), and an intermediate‑conductivity prospect zone (10–30 mS/m) where geothermal fluids are concentrated.
The discussion emphasizes the complementary nature of the two techniques. Satellite LST‑NDVI analysis offers rapid, cost‑effective screening over large areas but is susceptible to atmospheric variability, soil moisture, and seasonal effects; therefore, long‑term temporal datasets and field temperature checks are essential for reliable anomaly detection. MT provides detailed subsurface structural information, yet its results depend on inversion parameters and initial model assumptions, necessitating geological priors and multi‑constraint inversion strategies. By integrating both methods, the study achieves a robust, multi‑scale characterization of the Ciremai geothermal system, reducing uncertainty in drill‑site selection.
In conclusion, the combined remote‑sensing and MT approach successfully identified geothermal‑related surface anomalies, mapped the underlying fault network, and defined conductive zones suitable for pilot drilling. The methodology demonstrates a scalable, cost‑effective template for geothermal exploration in volcanic terrains worldwide, offering a scientifically grounded pathway to accelerate the development of renewable geothermal resources.
Comments & Academic Discussion
Loading comments...
Leave a Comment