Research on the visitor flow pattern of Expo 2010
Expo 2010 Shanghai China was a successful, splendid and unforgettable event, remaining us with valuable experiences. The visitor flow pattern of Expo is investigated in this paper. The Hurst exponent, mean value and standard deviation of visitor volu…
Authors: Chao Fan, Jin-Li Guo
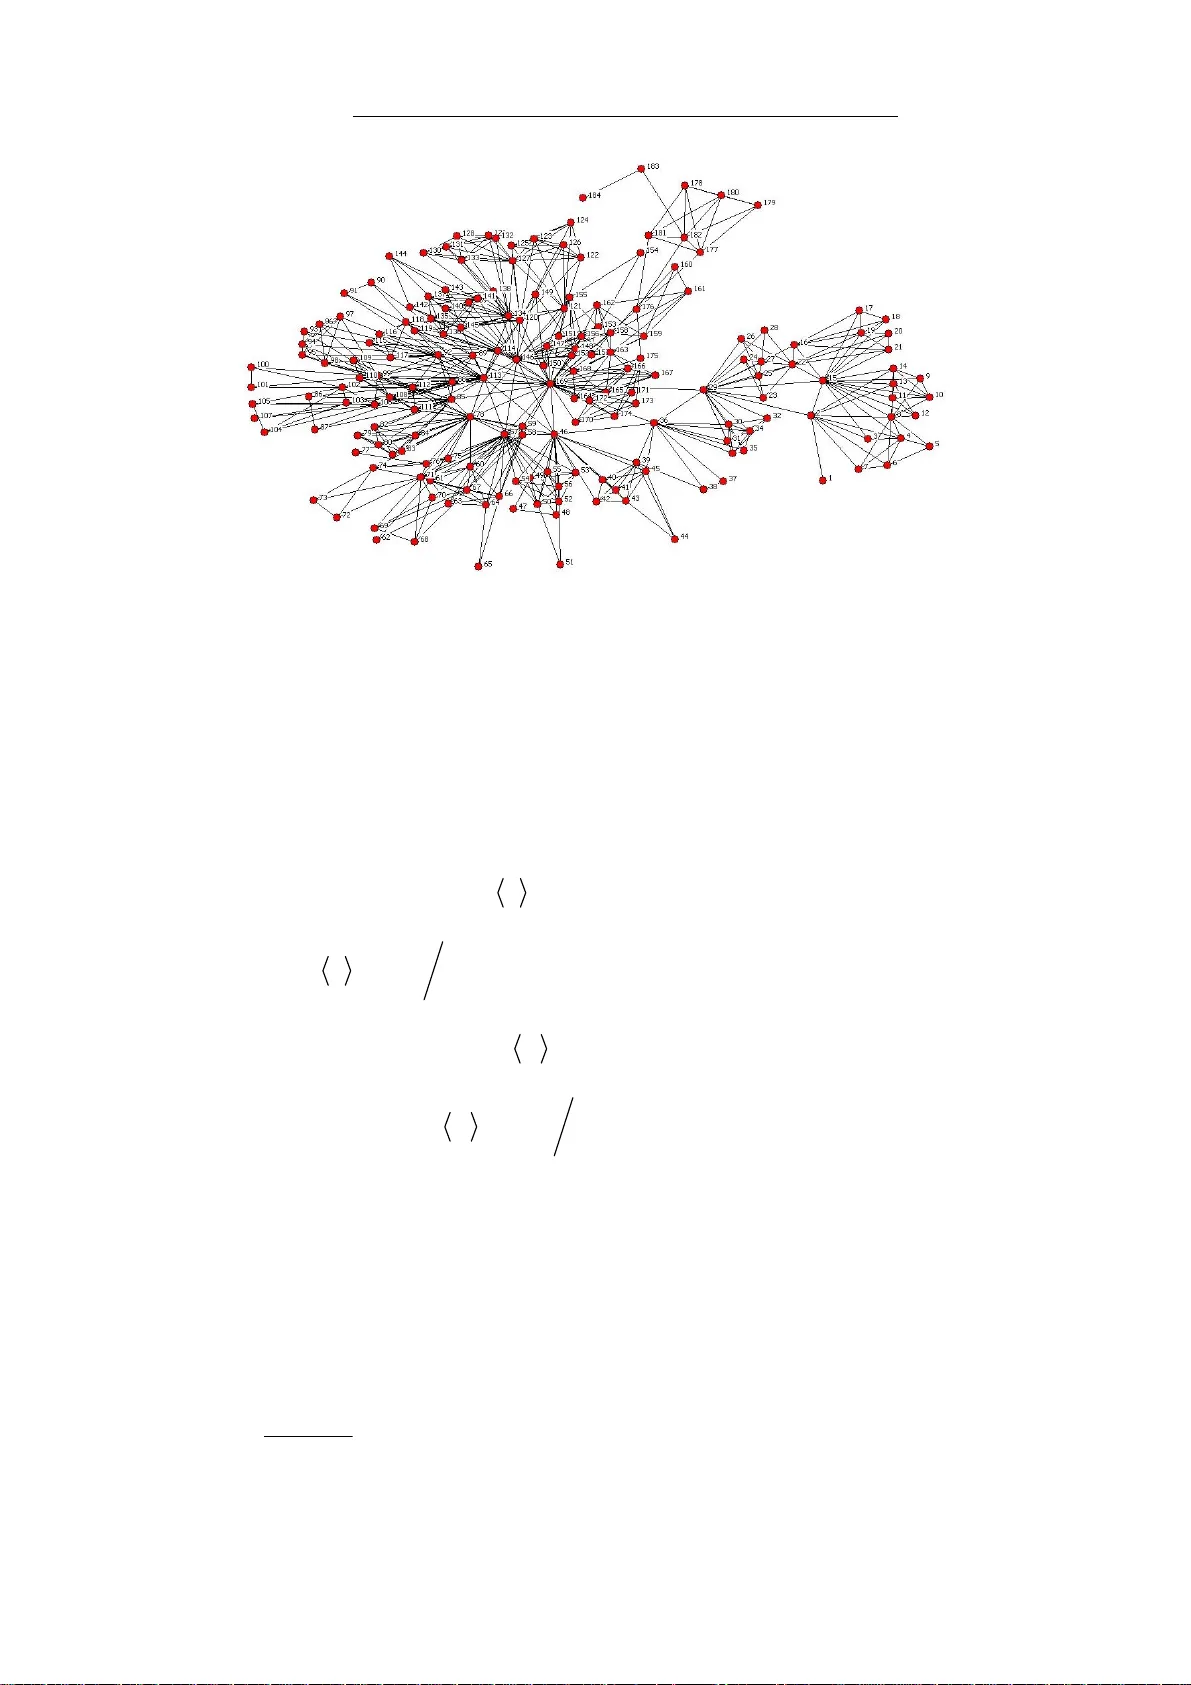
arXiv1 106.0599v2 [physics.soc-ph] Jun 201 1 1 Resear ch on the visitor flow pattern of Expo 2010 Chao Fan 1 , Jin Li Guo 2,3,* 1. College of Arts and Sciences, Sha nxi Agricu ltural Univ ersity , Shanxi, T aigu, 030801 , PRC 2. Business School, U niversity of Shanghai for Scie nce and T echnology , Shanghai, 20009 3, PRC 3. Quantitativ e Economic Research Center of Shaa nxi Province , Xi'an, 710127, PR C Abstract: Expo 2010 Shanghai China was a successful , splendid and unfor gettable event, remaining us with valuable experiences. The visitor flow pa ttern of Expo is investigated in this paper . The Hurst exponent, mean va lue and standard deviation of visitor volume prove that the visitor flow is fractal with long-term stability and correlation as well as obvious fluctuation in short period. Then the time series of visitor volume is converted to complex ne twork by visibility algorithm. It can be inferred from the topological properties of the visibility graph that the network is scale-free, small-world and hierarchically constructed, conforming that the time series are fractal and close relationship exit between the visitor volum e on different days. Furthermore, it is inevitable to show so me extrem e visitor volume in the original visitor flow , and these extreme points ma y appear in group to a great extent. Key words: V isitor flow , visibility graph, complex network, time series, Expo * Corresponding author: phd5816@163.com . arXiv1 106.0599v2 [physics.soc-ph] Jun 201 1 2 1. Introduction From May 1st to October 31st, Expo 2010 was successfully held in S hanghai China. Given its theme “Be tter City , Better L ife”, Expo 2010 was expected to be a “successful, splendid and unfor gettable” event and a platform for every exhibitor to explore sustainable models of urban deve lopment and better city life. During the 6 months of exhibition, 246 nati ons or organizations particip ated in this event which brought over 73 millions of visitors. Both the exhibition scale and total visitor volume hit the world record. How to manage so ma ny visitors in s uch a small area and long period is a problem worth consideration. Besides Expo, various kinds of fairs, e xpositions, sports meetings and lar ge conferences are held all over the world ev ery year . The successful experiences of Expo 2010 may provide references for the vi sitor management of such lar ge-scale activities. Unfortunately , we hardly find any work about this worth concern. T o summarize the valuable experience of E xpo 2010, we investigated the visitor flow pattern through statisti c analysis and complex network analysis. Complex network theory [1-3] is a new br anch in statistical physics to describe complex systems with networks, in which the n odes and edges represent the entities and the relationships be tween them respectiv ely . It can be used to describe m any networks in the real world such as soci al network, transporta tion network, protein interaction network, and so on. Recently , seve ral efforts have been made to bridge time series and complex networks [4-6 ]. Among all the methods, the so-called visibility graph algorithm [6] proposed by Lacasa et al., at tracted much attention for its simplicity and high ef ficiency , and a set of achievements have been obtained through it [7-10]. In our research, the Expo vi sitor flow pattern is studied mainly by network analysis and the network is obt ained through the visibility algorithm. This paper is organized as follows: Firstl y , data source and overview are given in section 2. In section 3, the general statistical properti es of Expo daily visitor volume are studied to find the stability and fluctua tion feature of the visitor flow . After that, the time series of visitor volume are convert ed to complex network by visibility graph algorithm in section 4, and then some topological param eters are calculated to arXiv1 106.0599v2 [physics.soc-ph] Jun 201 1 3 investigate the correlation between each data point of visitor volum e. Finally , some conclusions and discussions are given in section 5. 2. Data specification The data used in this paper are collecte d from the of ficial W ebsite of Expo 2010 Shanghai China (http://www .expo2010.cn). W e ta ke the amount of daily visitors as the observation of time series to study the visitor flow pattern of Expo 2010. During the exhibition period of 184 da ys, there are approximately 73,091,000 visitors in total and 397,234 visitors on average. Figure 1 below exhibits the general fluctuation pattern within which th e horizontal axis re presents the time (day) and the left and right vertical axes represent daily and accumulative visitor volume of Expo 2010 respectively . Fig.1: (Color on line) Daily and accumulative vis itor volume ( 5 10 × ) of Expo 2010 3. The general featur e of Expo visitor flow The Hurst exponent, namely , long-range co rrelation exponent is used as a measure of the long term memory of time se ries, i.e. the autoco rrelation of the time series, and it has been extens ively used in m any fields su ch as the stock market. The closer H gets to 0.5, the more noise and fluctuat ion there will be in the time series. Meanwhile, when H deviates more from 0.5 and tends towards 1, the tim e series will be more regular and persis tent. Conversely , the time series are deemed to be anti-persistent when H clines to 0. arXiv1 106.0599v2 [physics.soc-ph] Jun 201 1 4 In this section, we use the method of Re scaled Range Analysis [1 1, 12] to obtain the Hurst exponent of time series. The resu lt is that the Hurs t exponent of whole period daily visitor flow is 0.856 with 2 0.985 R = . It can be conclude d that the visitor flow of Expo don’t obey random walk but e xhibit long-term stability and correlation due to that the Hurst exponent surpasses 0.5. The deviations of the visitor flow in the future tend to keep the same sign like the past. T able 1 Mean value and standard deviation ( 3 10 × ) of visitor volume of Expo 2010 Period May . Jun. Jul. Aug. Sept. Oct. T otal Mean value 259.2 436.9 444.8 401.9 333.6 506.3 397.2 S tandard deviation 96.0 55.1 40.3 73.4 89.2 194.7 132.0 As shown in T able 1, we also calculate the mean value and standard deviation (with thousand visitors ) of the monthly and whole visitor volum e. From the results we can see the general fluc tuati on pattern of monthl y visitor flow . Firstly , much fewer people come to Expo in May owing to that people think they have enough time to visit, thus there is no need to hurry . Beside s, the operation of Expo is not in the best condition which makes people hesitate to visit. Secondly , the visitor fl ow in July is the most stationary and the second greatest whic h are the results of steady flow of tour groups and students who are in their summer vocation. Thirdly , during the six months of exhibition, October has the greatest visitor volume and standard deviation. The outbreak of visitor volume at the end of exhibition is not surprising. Meanwhile, the obvious fluctuation in visitor flow is th e result of interweaving of small visitor volume on the 14 designated days and extr emely great visitor volum e on several standard days such as 1,032,700 on 16th, 859,900 on 22nd and 837,400 on 23rd. In a word, the general law of Expo visitor flow exhi bits dual features of both fluctuation and stability . The daily volumes are correl ated from the long-term perspective, nevertheless show obvi ous fluctuation in short period. 4. S tatistical properties of visibili ty graph of Expo visitor volume According to the algorithm [6 ], a visibility graph is obtained from the mapping arXiv1 106.0599v2 [physics.soc-ph] Jun 201 1 5 of a time series into a network according to the following visibility criterion: two arbitrary data ( , ) aa ty and ( , ) bb ty in the time series have v isibility and consequently become two connected nodes in the associated graph, if any other data (, ) cc ty such that ac b tt t << fulfills: () ca ca b a ca tt yy y y tt − <+ − − ( 4 ) Figure 2 shows a typical example of this algorithm . In the upper panel, the data are displayed as vertical bars with heights indicating the values and the visibilities between data points are expressed as dashed lines. The converted network is shown in the lower panel, where the nodes correspond to series data in the same order and an edge connects two nodes if th ere is visibility between th em. The visibility graphs inherit several propertie s of time series in its structure. More specifically , periodic series convert into regular graphs, ra ndom series do so into exponential random graphs, and fractal se ries convert into scale-free networks. Fig.2: (Color on line) A typical exam ple of visibility graph algorithm. arXiv1 106.0599v2 [physics.soc-ph] Jun 201 1 6 Fig.3: (Color on line) The network mapped from t ime series of daily visitor volume of Expo 2010. As shown in Fig.3, the time series of daily visitor volume of Expo have been converted to visibility graphs using th e algorithm introduced above. In order to investigate the feature of orig inal tim e series of visitor flow , some characteristics o f the visibility graph with 184 nodes and 676 e dges were calcu lated as follows [2]: 1) A verage degree of network k : the mean value of degrees of all the nodes in network, 1 7.348 N i i kk N = == ∑ . 2) A verage clustering coefficien t C : the mean value of clus tering coef ficients of all the nodes in network, 1 0.789 N i i CC N = == ∑ . 3) Diameter of network D : the maximal distance between any pair of nodes, , max 8 ij ij Dd == , where ij d refers to the number of edges on the shortest path connecting node i and j . 4) A verage path length L : the mean value of the dist ance of any pair of nodes, 2 3.447 (1 ) ij ij Ld NN ≥ == + ∑ . 5) Degree distribution () Pk : the probability of a certa in node to have degree k . It is arXiv1 106.0599v2 [physics.soc-ph] Jun 201 1 7 called scale-free network when degree distribution obeys a right-skewed power-law ( ) ~ Pk k γ − . For the sake of decreas ing the noise, we study the accumulative degree d istribution which behaves power-law as 2.37 ( ) 44.25 Pk k − = with 2 0.991 R = . Therefore, the vis ibili ty graph is scale-free. 6) The small-world ef fect: calculating the average path length step by step while increasing the total number of nodes N in network. If L increases logarithmically along with N , namely , ( ) ~ l n LN N , or more slower , while the network keeping a high clusteri ng coef ficient, then the network is regarded with the feature of small world. As show n in Fig.4, it can be observed that L increases along with N slower than logarithmical pattern. Consequently , the visibility graph is a small-world network. 7) Hierarchical structure: wei ghted average values of cl u stering coef ficients of nodes with degree k were calculated as 1 () | n i i Ck C k C n = == ∑ , where n refers to the number of dif ferent clus tering coef ficients a node with degree k has. The network is considered to be hierarchically constructed if () ~ Ck k α − . In our case, 0.97 ( ) 5.597 Ck k − = . 8) Pearson correlation coef ficient r [13]: there are many hub- nodes in scale-free network who own much great er degree than other nodes. Whether the interaction among the hubs of the network is attracti on or repulsion can be determ ined from the correlation betw een the degrees of dif ferent node s. The degree correlation can be quantified by Pearson correla tion coef ficient defined as: () () () 2 11 12 1 2 2 12 2 1 12 1 2 1 2 11 22 ii ii Nk k N k k r Nk k Nk k −− −− ⎡⎤ −+ ⎢⎥ ⎣⎦ = ⎡ ⎤ +− + ⎢ ⎥ ⎣ ⎦ ∑∑ ∑∑ , where 1 k and 2 k are the degrees of the nodes at the two ends of edge i . It can be deduced from the result 0.115 r = that the network is positively correlated arXiv1 106.0599v2 [physics.soc-ph] Jun 201 1 8 with hub-nodes being attracted to each other . 9) Nearest neighbors average connectivity [ 14]: the relation of degree between one node and its nearest neighbors can be measured by the quantity () | nn k Kk P k k ′ ′′ = ∑ , where the conditional probability () | Pk k ′ denotes that a node with degree k is connected to a node with degree k ′ . Therefore, nn K is used to investigate the relation between the degree of a certain node and the average degree of its nearest neighbors. From Fig.4 we can see clearly that nn K and k are positively correlated. Fig.4 (Color online) The topological feature of th e visitor flow network (a. The accumulative de gree distribution behave s power-law with exp onent -2.37. b. The average path length grows with the tota l number of nodes in ne twork slower than logarithmical pattern. c. The weighted av erag e value of clustering coefficients decreases with degree as pow er -law with exponent near to 1. d. The plot of ~ nn Kk shows the relation of degree between a node and its neighbors is positively correlated.) arXiv1 106.0599v2 [physics.soc-ph] Jun 201 1 9 From the topological parameters calcul ated above, some conclusions may be obtained as follows: Firstly , the visibility graph being scale-free networks ve rifies that the tim e series of Expo visitor flow to be with fractal characteristics, enhanc ing the fact that power-law degree distributions are related to fractality , something highly discussed recently [6-10, 15-18]. More accurately , the total degree of the top 29 of 184 nodes with degree no less than 10 accounts for up to 36. 1% of the sum degree of the whole network, and the average degree of the remaining 155 nodes is only 5.574. Secondly , the facts that the network ow ns high clustering coef ficient and low average path length which grow slowly with the total number of nodes verified the small-world phenomenon which m eans there are tight connections between nodes even they are located far aw ay from each other for there are visibility lines between the corresponding data points in time series. Consequently , it can be deduced that some certain relations e xist between the am ounts of visitor flow in diff erent time of whole exhibition. In another wo rds, it is not random or unco nnected between the past and the future in time series of human behaviours. Thirdly , it can be inferred from the result 0.97 ( ) 5.597 Ck k − = that the visibility graph is hierarchically c onstructed which means if a node in network has greater degree, its neighbors are not tended to be c onnected with each other . The nodes with greater degrees are the ones own relatively much greater observations in tim e series than their directly connected and even unconnected neighbors. These extreme points correspond to the hub-nodes in scale-free networks. For example, node 15 has comparatively high degree 18 k = and low clustering coef ficient 0.261 C = , and there are 335,300 visitors on May 15th, much greater than its neighbors (There are 163,000, 180,400, 180,100, 215,500, 240,300 visitors on the 5 days before the 15th respectively and 241,500, 236,400, 261,900, 290,600, 296,400 visitors after the 15th. Obviously , it is much lower and m ore uniform before and after the 15th.). Correspondingly , node 15 has many neighbors in the network who are separated into two parts and connected with each other with sm all probability . Thus, it can be arXiv1 106.0599v2 [physics.soc-ph] Jun 201 1 10 concluded that it is inevitab le to show som e extreme visitor volume in hom ogeneous flow on such pattern, Finally , the result 0.115 r = m e ans the network is assortative mixing, within which the nodes with high degrees tend to link to the nodes also have high degrees. Moreover , the fact nn K and r are positively correlated implies that th e greater degree of a certain node, the greater aver age degree of its neighbors. T o make the problem more clearly , we studied the rela tion between the node degree in network and the average visitor volume in time series. As shown in Fig.5, generally , the nodes with greater degree correspond to th e data point with higher visi tor volume. T o sum up, the clustering phenomenon of hub-nodes in networ k means extrem e points in time series appear in the form of group, in another word, lar ge visitor flow always accompany with other large vis itor flows. Consequen tly , there are som e consecutive periods of extreme visitor vo lumes in the whole exhi bition, for instance, from Oct.14th to Oct.24th with 726,255 visitors on average a nd from Jul.10th to Jul.28th with 466,942 daily visitors. Fig.5 (Color online) The relation betw een node degree and visitor volume ( 5 10 × ) In conclusion, the vis ibility graphs c onverted from time series are scale-free, small-world and hierarchically construc ted. Thus the original time series are deem ed to be with fractal feature and there are cl ose relationships betw een the data points, especially those extreme points. Furtherm ore, the existence of extreme visitor volum e is unavoidable and consecutive. arXiv1 106.0599v2 [physics.soc-ph] Jun 201 1 11 5. Summary and discussion Expo 2010 Shanghai China is a wonderful event which has grand scale, long exhibition period and huge vi sitor amount, remaining us wi th the best memories and valuable experiences. In our research, the visitor flow is investigated from two dif ferent viewpoints: On one hand, we discuss the general feat ure of the daily visitor volume from the perspective of statistics and tim e series an alysis. The results of Hurst exponent, mean value and standard deviation verify th at the Expo visitor flow shows mixing properties of stability in long-term a nd fluctuation in short-term period. On the other hand, the complex networ k converted fro m time series with visibility algorithm exhibits scale-free prop erty , small-world effect and hierarch ical structure, which confir m that the original time series are fractal within which d a ta points are intensively connected with each other . Furthermore, the relations between degree of one node and its neighbors, degr ee and clustering coefficient as well a s degree and visitor vo lum e prove that the existence of extreme visitor volume is inevitable and appear in group. The method and conclusion of our work m ay be helpful to manage and forecast the visitor flow of such large-scale exhi bitions and spots m ee ting or other human repetitious behaviours on collect ive level, as well as enrich the res earches of the correlation between time seri es and com plex networks. Acknowledgement This paper is supported by the National Natu ral Science Foundation of China (Grant No.70871082) and the Foundation of Shanghai Leading Academ ic Discipline Project (Grant No.S30504). arXiv1 106.0599v2 [physics.soc-ph] Jun 201 1 12 REFERENCES [1] W A TTS D. J . and STROGA TZ S. H., Natur e 393 (1998) 440. [2] ALBE R T R. and BARABASI A. L., Rev . Mod. Phys. , 74 (1) (2002) 47. [3] NE WMAN M. E. J., SIAM Rev . , 45 (2) (2003) 167. [4] ZHANG J. and SMALL M., Phys. Rev . Lett. , 96 (2006) 238701. [5] Y ANG Y . and Y ANG H. J., Physica A , 387 (2008) 1381. [6] LACASA L., LUQUE B., BALLESTEROS F ., LUQUE J., and NUNO J. C., Pr oc. Natl. Acad. Sci. U.S.A. , 105 (2008) 4972. [7] LACASA L., LUQUE B., LU QUE J., and NUNO J. C., Eur ophys. Lett., 86 (2009) 30001. [8] LUQUE B., LACASA L., BALLE STEROS F ., and LUQUE J., Phys. Rev . E , 80 (2009) 046103. [9] ELSNE R J. B., JAGGER T . H., and FOGAR TY E. A., Geophysical Resear ch Letters , 36 (2009) L16702. [10] LIU C., ZHOU W . X., a nd YUAN W . K., Physica A , 389 (2010) 2675. [11] HURST H. E., T ransaction of American Soc iety Civil Engine ers , 11 6 (1951) 770. [12] YOON S. M. and KANG S. H., The Journal of the Kor ean Economy , 9 (3) (2008) 403. [13] NEWMAN M. E. J., Phys. Rev . Lett., 89 (2002) 208701. [14] P AST OR-SA T ORRAS R., V AZQU EZ A., and VESPIGNANI A., Phys. Rev . Lett. , 87 (2001) 258701. [15] SONG C.M., HA VLIN S., and MAKSE H. A., Natur e , 433 (2005) 392. [16] GOH K.-I., SAL VI G ., KAHNG B., and KI M D., Phys. Rev . Lett. , 96 (2006) 018701. [17] KIM J. S., GOH K.-I., KAHNG B., and KIM D., New J. Physics , 9 (2007) 177. [18] GALLOS L. K., SONG C. M., and MAKSE H. A., Physica A , 386 (2007) 686.
Original Paper
Loading high-quality paper...
Comments & Academic Discussion
Loading comments...
Leave a Comment