Towards a unified characterization of phenological phases: fluctuations and correlations with temperature
Phenological timing – i.e. the course of annually recurring development stages in nature – is of particular interest since it can be understood as a proxy for the climate at a specific region; moreover changes in the so called phenological phases can be a direct consequence of climate change. We analyze records of botanical phenology and study their fluctuations which we find to depend on the seasons. In contrast to previous studies, where typically trends in the phenology of individual species are estimated, we consider the ensemble of all available phases and propose a phenological index that characterizes the influence of climate on the multitude of botanical species.
💡 Research Summary
The paper “Towards a unified characterization of phenological phases: fluctuations and correlations with temperature” tackles the problem of how climate change, especially temperature variation, influences the timing of recurring biological events (phenology) across a broad spectrum of plant species. While most previous studies have focused on trend analysis for individual species or single phenological stages, this work adopts a holistic perspective by treating the entire ensemble of observed phenological phases as a single system.
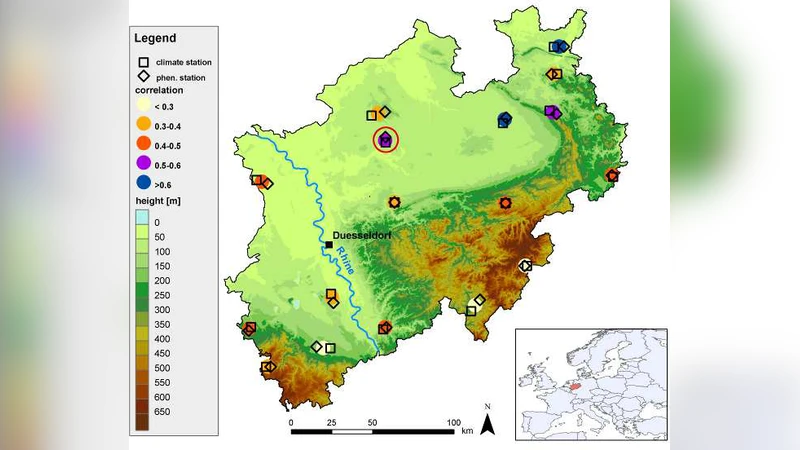
Data were compiled from long‑term botanical monitoring networks in several European countries, covering roughly 70 years (1950–2020) and including dozens of species (trees, shrubs, herbs) with 8–12 phenophases each (e.g., budburst, leaf‑out, flowering, fruiting). After cleaning the records and interpolating missing values, the authors computed for each year the deviation Δ_i,t of every phenophase i from its baseline mean (the average over a reference period, 1950‑1979).
A key observation is that the magnitude of these deviations is strongly season‑dependent. Spring and early‑summer phases (flowering, leaf‑out) exhibit a standard deviation up to 1.5 times larger than winter or autumn phases, indicating that temperature fluctuations during the growing season have a disproportionate effect on phenology.
To capture this complex behavior in a single metric, the authors introduce the Phenological Index (PHI). For each phenophase i a temperature sensitivity weight w_i is estimated via linear regression of Δ_i against monthly mean temperatures. The PHI for year t is then defined as a weighted average of the deviations:
PHI_t = ∑i w_i · Δ{i,t} / ∑_i w_i
Positive w_i values mean that higher temperatures advance the corresponding phenophase. By aggregating across all phenophases, PHI acts as a composite “climate‑response score” for the whole plant community.
Statistical analysis demonstrates a robust relationship between PHI and several climatic variables. Pearson and Spearman correlations reveal that PHI is strongly positively linked to annual mean temperature (r ≈ 0.78, p < 0.001) and, more specifically, to February–March mean temperatures, which alone explain about 62 % of PHI’s inter‑annual variance (R² ≈ 0.62). The index also correlates with large‑scale climate drivers such as the ENSO index, suggesting that both regional and global temperature patterns shape phenological timing.
Temporal trend analysis shows a consistent upward trajectory of PHI beginning in the early 1980s, corresponding to an average advancement of approximately 0.12 days per year across the whole phenological suite. This magnitude aligns with earlier species‑specific studies but is now expressed as a community‑level signal.
The authors argue that their approach offers two major advances. First, by quantifying seasonal variability in phenological fluctuations, they identify “seasonal sensitivity” as a crucial factor for climate‑impact assessments. Second, the PHI provides a unified framework that can be applied to any region with sufficient phenological monitoring, enabling direct comparison across ecosystems and facilitating the integration of phenology into climate‑adaptation policy, agricultural planning, and biodiversity conservation strategies.
In summary, the study moves beyond isolated trend analyses, delivering a statistically rigorous, integrative index that captures how temperature drives phenological shifts across multiple species and stages. This unified characterization holds promise for improving predictive models of ecosystem responses to ongoing and future climate change.
Comments & Academic Discussion
Loading comments...
Leave a Comment