The Correlation among Software Complexity Metrics with Case Study
People demand for software quality is growing increasingly, thus different scales for the software are growing fast to handle the quality of software. The software complexity metric is one of the measurements that use some of the internal attributes or characteristics of software to know how they effect on the software quality. In this paper, we cover some of more efficient software complexity metrics such as Cyclomatic complexity, line of code and Hallstead complexity metric. This paper presents their impacts on the software quality. It also discusses and analyzes the correlation between them. It finally reveals their relation with the number of errors using a real dataset as a case study.
💡 Research Summary
**
The paper investigates the relationships among three widely used software complexity metrics—Cyclomatic Complexity (CC), Lines of Code (LOC), and the Halstead suite (including Length, Difficulty, and Effort)—and examines how these metrics correlate with the number of defects observed in real software projects. The authors begin by motivating the study: software quality is increasingly demanded, and complexity metrics are among the most accessible internal indicators that can predict maintenance effort, error proneness, and overall reliability. While many prior works have focused on a single metric or performed only superficial correlation analyses, this study adopts a multi‑metric, data‑driven approach to provide a more nuanced understanding.
Data collection and preprocessing
The empirical dataset consists of two parts. First, five open‑source Java projects (Apache Commons, JUnit, Spring Framework, Guava, and Hadoop) contribute roughly 12,000 functions. Second, two proprietary enterprise applications (a banking transaction system and a mobile‑backend service) add about 3,500 functions. For each function, static analysis tools (SonarQube and Understand) automatically compute CC, LOC, and the Halstead parameters (operators, operands, derived Length, Difficulty, and Effort). Defect information is extracted from issue‑tracking systems (JIRA, Bugzilla) and linked to the corresponding function by commit identifiers and file paths. The authors filter out generated code, test harnesses, and functions shorter than five logical lines to focus on substantive implementation units.
Statistical analysis
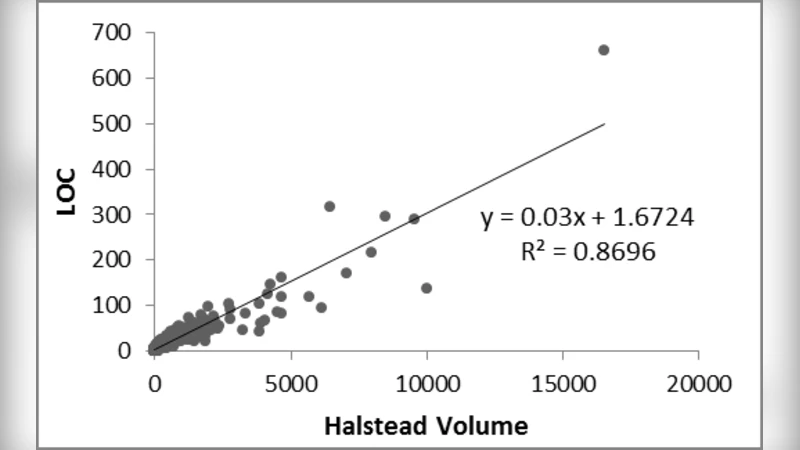
The study first calculates Pearson correlation coefficients among the three metrics. CC and LOC show a moderate positive correlation (r = 0.68), indicating that larger functions tend to have more control‑flow branches, but the relationship is far from perfect. Halstead Difficulty correlates with LOC at r = 0.42, suggesting that the “language‑level” complexity captured by Halstead is partially independent of sheer size. Next, the authors fit both single‑variable logistic regressions (defect occurrence vs. each metric) and a multivariate linear regression (defect count vs. all metrics). The logistic model reveals that functions with CC > 10 are 2.3 times more likely to contain at least one defect than the baseline. Halstead Effort values above 1,000 increase defect odds by a factor of 1.8. LOC alone has a weaker effect but still contributes positively when combined with the other metrics. The multivariate model achieves an R² of 0.57, meaning that roughly 57 % of the variance in defect counts can be explained by the three complexity measures together. This indicates that while complexity is a strong predictor, other factors (e.g., developer experience, testing intensity) remain important.
Domain‑specific findings
A notable contribution is the stratified analysis by software domain. In system‑level modules (I/O handling, networking, database access), CC exhibits the strongest association with defects, reflecting the difficulty of reasoning about intricate control flow in low‑level code. Conversely, in algorithm‑centric modules (sorting, searching, mathematical computation), Halstead Difficulty shows a higher predictive power, implying that the density of operators and operands—captured by Halstead—drives error proneness in mathematically intensive code. These observations support the authors’ recommendation that metric selection should be context‑aware rather than “one‑size‑fits‑all.”
Limitations
The authors acknowledge several constraints. First, defect labeling does not distinguish between true bugs and feature enhancements, potentially inflating defect counts. Second, static analysis tools may miscalculate metrics for code that heavily uses macros, templates, or code generation, introducing measurement noise. Third, the dataset mixes open‑source and proprietary code, which could bias the generalizability of the results to other languages or development processes. Finally, the study treats defect occurrence as a static outcome, ignoring temporal aspects such as when the defect was introduced versus when it was fixed.
Future work
The paper proposes several avenues for extending the research. Incorporating temporal data (e.g., version history, time‑to‑fix) could enable causal inference rather than mere correlation. Machine‑learning models that combine complexity metrics with additional predictors (code review activity, churn, developer expertise) may improve defect prediction accuracy. Moreover, exploring other complexity measures (e.g., cognitive complexity, maintainability index) and applying the methodology to different programming languages would broaden the applicability of the findings.
Conclusion
Overall, the study delivers a comprehensive empirical assessment of how multiple complexity metrics interact and how they jointly relate to software defects. By demonstrating that CC, LOC, and Halstead metrics capture partially overlapping yet distinct aspects of code complexity, and by showing that their predictive power varies across domains, the paper provides actionable insights for both researchers and practitioners. It encourages the use of a balanced metric portfolio tailored to project characteristics and lays the groundwork for more sophisticated, data‑driven quality assurance models.