MONEYBaRL: Exploiting pitcher decision-making using Reinforcement Learning
This manuscript uses machine learning techniques to exploit baseball pitchers' decision making, so-called "Baseball IQ," by modeling the at-bat information, pitch selection and counts, as a Markov Decision Process (MDP). Each state of the MDP models …
Authors: Gagan Sidhu, Brian Caffo
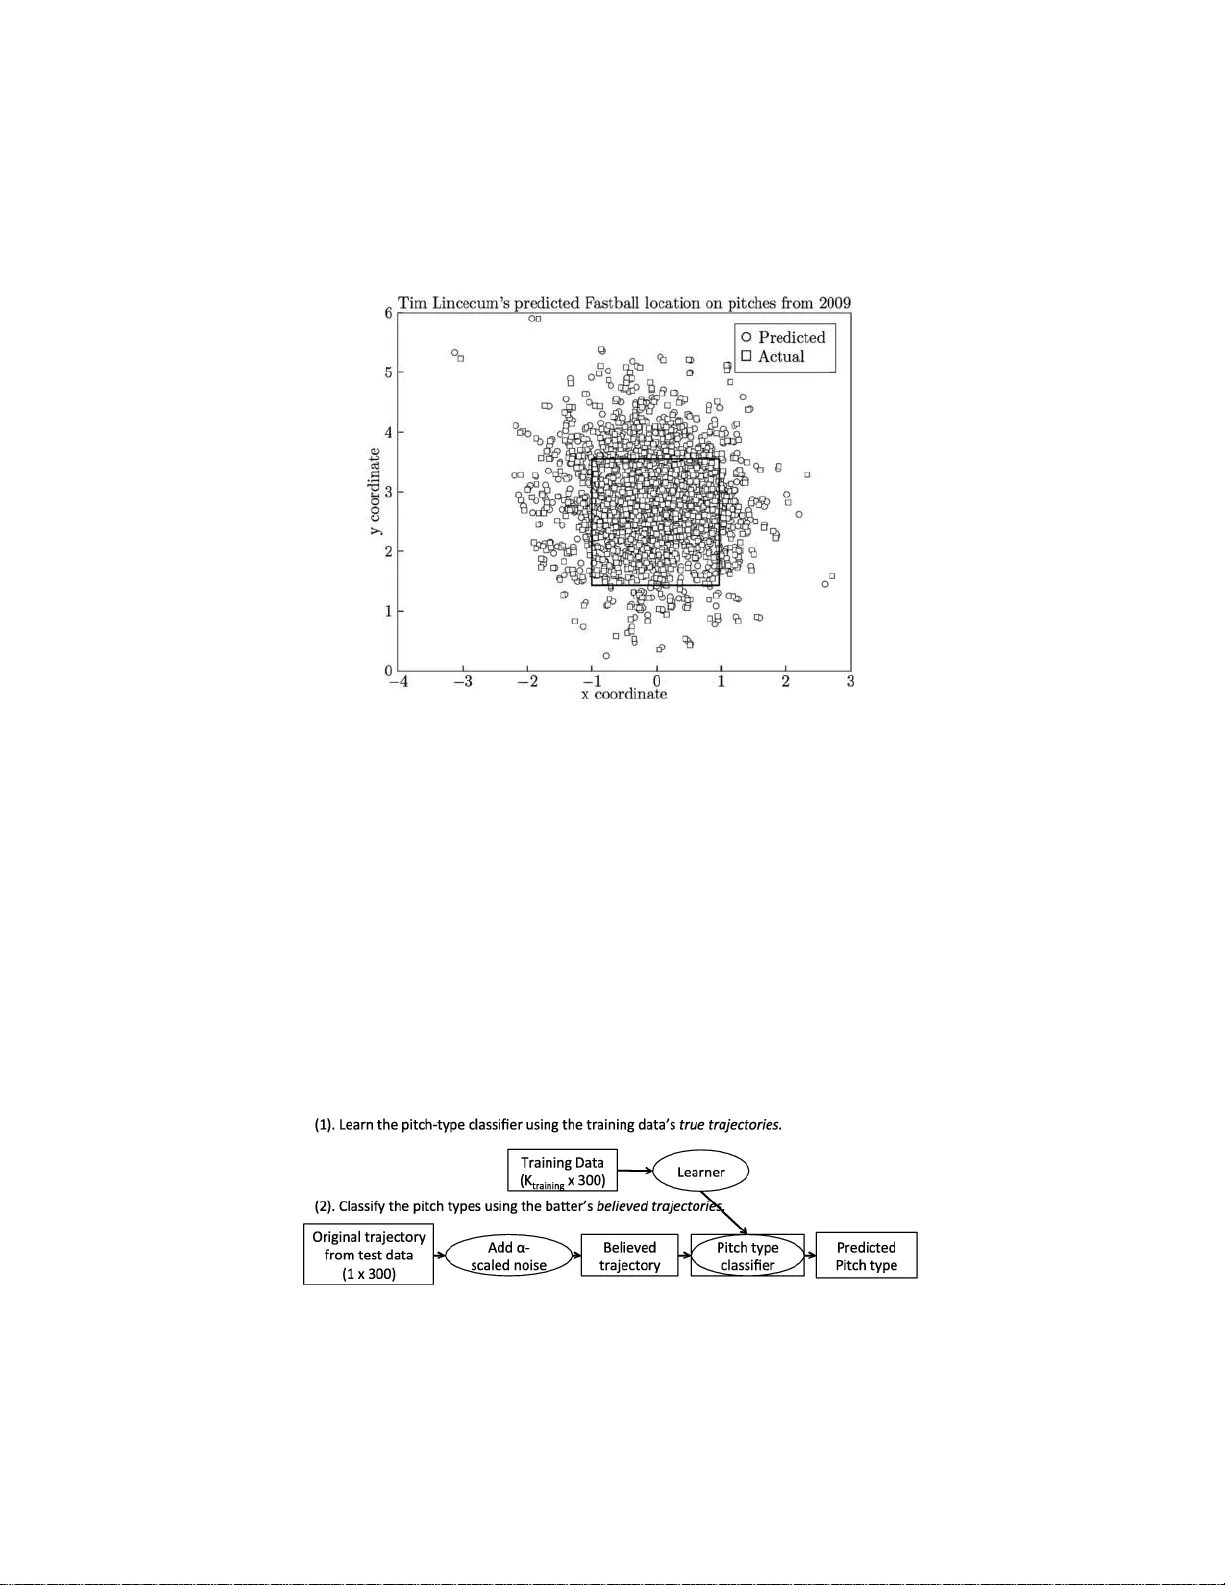
The Annals of Applie d Statistics 2014, V ol. 8, No. 2, 926–955 DOI: 10.1214 /13-A OAS712 c Institute of Mathematical Statistics , 2 014 MONEYBaRL: EXPL OITING PITCHER DECISION-MAKING USING REINF OR CEMENT LEARNING By Ga gan Sidhu ∗ , † and Brian Caffo ‡ Gener al A nalytics ∗ 1 , University of Alb erta † and Johns Hopkins Univ e rsity ‡ This ma nuscri pt uses mac hine learning techniques to exploit base- ball pitchers’ decisi on making, so-called “Baseball IQ,” by modeling the at-bat in formation, pitch selection and counts, as a Marko v D e- cision Process (MDP). Each state of th e MDP mod els the pitcher’s current pitch selection in a Mark ovian fashion, conditional on the information immediately prior to making the current pitc h. This in- cludes the count prior to the previous pitch, his ensuing pitch selec- tion, the batter’s ensuing action and the result of the p itch. The n ecessary Marko vian probabilities can b e estimated by the rel- ev ant observed conditional p rop ortions in MLB pitch-by-pitch game data. These probabilities could b e pitcher-sp ecific, using only the data from one pitcher, or general, using the data from a collection of pitchers. Optimal batting strategies against th ese estimated cond itional d is- tributions of pitch selection can b e ascertained by V alue Iteration. Optimal batting strategies against a pitcher-specific conditional dis- tribution can b e contras ted to th ose calculated from th e general con- ditional distributions asso ciated with a collection of pitchers. In this manuscript, a single season of MLB data is used to cal- culate th e conditional d istributions to find op t imal p itc her-sp ecific and general ( against a collection of p itc hers) b atting strategies. These strategies are subsequently ev aluated by conditional distributions cal- culated from a d ifferent season for the same pitchers. Thus, t he bat- ting strategi es are conceptually tested via a collectio n of sim u lated games, a “mo ck season,” gov erned by distributions not used to cre- ate th e strategies. (S im ulation is not needed, as exact calculations are av ailable.) Instances where the p itcher-specific batting strategy outp erforms the general b atting strategy suggests t hat the p itcher is exploitable — knowl edge of the conditional distributions of th eir pitch-making de- cision p rocess in a different seaso n y ielded a strategy that work ed b etter in a new season than a general batting strategy built on a Received Sep tember 2012; revised December 2013. 1 http://www .g- a.ca . Key wor ds and phr ases. Marko v , baseball, sp orts, simula tion, algorithmic statistics. This is an electro nic reprint of the original ar ticle published b y the Institute of Mathematical Statistics in The Annals of Applie d Statistics , 2014, V ol. 8 , No. 2, 92 6 –955 . This re pr int differs fro m the o riginal in pagination and typogr aphic detail. 1 2 G. SIDHU AND B. CAFFO p opulation of pitchers. A p erm utation-b ased test of exp loitabilit y of the collection of pitchers is given and eval uated under tw o sets of assumptions. T o sho w the practical utility of the approac h, we introduce a spatial comp onent that classifies each pitcher’s pitc h - types using a batter-parameterized spatial tra jectory for each pitch. W e found that heuristically lab eled “nonelite” batters b enefit from using the ex- ploited pitchers’ p itc her-sp ecific strategies, whereas (also h eu ristically labeled) “elite” play ers do n ot. 1. In tro d uction. “Go o d pitching wil l always stop go o d hitting and vic e-versa.” —Casey Sten gel Getting a hit off of a ma jor league pitcher is one of the hardest tasks in all of sp orts. Consid er the fact that a b atter in p ossession of detailed kno w ledge of a pitc h er’s p r o cesses for determining pitches to thr o w would h a ve a large adv antag e for exploiting that p itc her to get on base [Stallings, Bennett and American Baseball Coac h es Asso ciation ( 2003 )]. Pitc hers apparen tly rev eal an enormous amoun t of information regardin g their b eha viour thr ough th eir historical game data [Bic k el ( 2009 )]. Ho w ev er, making effectiv e use of this data is c hallenging. This manuscript u ses statistical and m ac hine learnin g tec h niques to: (i) represent sp ecific pitc her and general p itching b eha v iour b y Mark o v pro- cesses whose tr ansition probabilities are estimat ed, (ii) generate optimal batting strategies against these pro cesses, b oth in the general and p itc her- sp ecific sense, (iii) ev aluate th ose strategies on data not u sed in their cre- ation, (iv) inv estigate the implication of the strategies on pitc h er exp loitabil- it y , and (v) establish the viabilit y of the use of alg orithmically/empirical ly- deriv ed batting strategies in real-w orld settings. These goals are acco m - plished by a detailed analysis of t w o seasons of US Ma jor League Baseball pitc h-by-pitc h data. P arsimony assumptions are necessary to ap p ropriately represent a pitc her’s b ehavi our. F or eac h pitc her, it is assu med that their pitc h b eha viour is sto c hastic and go v erned b y one-step Mark o vian assumptions on the pitc h coun t. Sp ecifical ly , eac h of the t w elve unique nonterminal states of the pitch coun t are mo deled as a Mark o v pr o cess. I t is fu rther assumed that th e rel- ev ant transition probabilities can b e estimate d by data of ob s erv ed p itc h selections at the t welv e u nique pitc h coun ts. It should b e noted that the transition could b e estimated for a p articular pitc h er based on their his- torical data, or historical data for a rep r esen tativ e collectio n of pitc h ers to in vestig ate general p itc hing b ehavio ur. It is herein d emonstrated that a pitc h er’s decisions can b e exploited by a data-informed batting strategy that tak es adv an tage of their mistakes at MONEYBaRL: EX PLOITING BASEBALL PITCHER D ECISION-MAK ING 3 Fig. 1. A schematic of the R einfor c ement L e arning V alue Iter ation and Policy Evaluation analysis of two se asons of MLB data. eac h p itc h coun t in the at-bat. T o elab orate, if indeed a p itc her’s b eha viour is w ell mo deled b y a Mark o v pro cess on the pitc h coun t, a batter informed of th e r elev ant transition probabilities is p resen ted with a Marko v Decision Pro cess (MDP) to swing or sta y at a give n pitc h count. Optimal batting strategies for MDPs can b e found b y a Reinforcemen t Learning (RL) algo- rithm. RL is a subset of artificial intellig en ce for finding (V alue Iteration) and ev aluating (P olicy Ev aluation) optimal s tr ategie s in stochastic settings go v erned b y Mark o v p ro cesses. It has b een us ed successfully in sp orts games- manship, via the stud y of offensive p la y calling in American football [Pa tek and Bertsek as ( 1996 )]; s ee S ection 5.3.3 for fur ther discus sion. T h e RL V alue Iteration algorithm applied to the pitcher-specific Marko v transition p roba- bilities yields a pitc her-sp ecific batting strategy . In th e eve nt th at the Mark ov transition probabilities we re estimated from a represen tativ e collection of pitc hers, a general optimal batting s tr ategy w ould r esult f rom RL V alue Iteration. An imp ortan t comp onent of th e dev elopment of optimal batting strategy is their ev aluation. T o th is end, RL Po licy Ev aluation is used to inv estigate the p erf ormance of batting strategies on pitc her-sp ecific and general Marko v transition probabilities estimated fr om data not u sed in th e RL V alue Itera- tion algorithm to dev elop the strategies. A schemat ic of the analysis p ip eline is giv en in Figure 1 . In addition to ev aluating the b atting strategies on new data, comparison of the p erformance of th e p itc her-sp ecific and general batting strategie s yields imp ortant in f ormation on th e utilit y of an optimal, data-informed batting 4 G. SIDHU AND B. CAFFO strategy against a sp ecific pitc her. T o this p oint, a pitc her has b een exploite d if Polic y Ev aluation su ggests that the pitc h er-sp ecific optimal batting strat- egy against them is sup erior to the general optimal b atting strategy , w ith their difference or ratio estimating the degree of exploitabilit y . The term “ex- ploited” is u sed in the sense that an op p osing b atter wo uld b e w ell s erv ed in carefully studying that pitc her’s h istorical data, rather th an executing a general strateg y . Giv en this framew ork, it is p ossible to in v estigate hyp otheses on general pitc her exploitabilit y using p erm utation tests. Ho we v er, the nature of the tests requires assu mptions on the direction of the alternativ e. Und er the assumption that all pitc hers are n ot equally exploitable, the hyp othesis that pitc hers can b e exploited more than 50% of the time can b e in v estigated. This h yp othesis w as not rejected at a 5% error rate. Und er the assumption that all pitc hers are equally exploitable, the h yp othesis was rejected. It is our opinion th at the assump tion of unequ al exp loitabilit y is b etter suited for baseball’s at-bat setting (see Section 2.4 ). Thus, this man uscript is the first to provi de statistical evidence in supp ort of str ategizing against s p ecific pitc hers instead of a group of p itc hers. T o highligh t the utilit y of an optimal pitc her-sp ecific batting strategy for an exp loitable pitc h er, a data-driven v alidation w as conceiv ed. This v alidation asso ciates spatial tra jecto ries with the pitc h-t yp e that w as em- plo yed. The sp atial comp onent is a classifier that estimates the pitc h-typ e of a b atter-parameterize d spatial tra jectory after training o v er the resp ec- tiv e pitc her’s actual pitc h tra jectorie s. The estimated p itc h-t yp e selects the batting actio n from the exploited p itc her’s pitcher-sp ecific batting strategy (Section 4.2 ; the schemat ic diagram outlining this pr o cess is p ro vided in Fig- ure 4 ). The sim ulation therefore uses the spatial and strategic comp onen t to realistically sim ulate a batter’s p erformance when facing an exploited pitc her. The batter’s actual and sim ulated statistics when facing the resp ec- tiv e pitc h er are then compared using t ypical baseball statistics. It wa s found that heur istically-la b eled “elite” batters’ simulat ed s tatis- tics are worse than their actual s tatistics. Ho wev er, it w as also found that the (also h euristically-labeled) “nonelite” 2 batters’ sim u lated statistics were greatly impr o ve d from their actual statistics. The simulation results suggest that an exploited pitc h er’s pitc h er-sp ecific strategies are us efu l for nonelite batters. The man uscr ip t is laid out as follo ws: The section immediately follo w- ing this p aragraph pr o vides a v ery b rief demonstration of Reinforcement Learning algorithms to help stim ulate un derstanding, Section 2 discusses the 2 In our study , nonelite batters are excellent play ers, some h a ving participated in the MLB All-Star game. MONEYBaRL: EX PLOITING BASEBALL PITCHER D ECISION-MAK ING 5 Fig. 2. GridWorld. The values in the right grid ar e determine d using Pol icy Evaluation with a p olicy that r andomly sele cts one of the four actions at e ach state. R eprinte d wi th p ermission fr om Richar d S. Sutton and Andr ew G. Barto, R einfor c ement L e arning: An Intr o duction, publishe d by The M IT Pr ess. strategic comp on ent, whic h applies Reinforcement Learning algorithms to Mark o v pro cesses to compute and ev aluate the r esp ectiv e b atting str ategie s, and S ection 3 discusses the spatial comp onen t, whic h sim ulates a sp ecific batter’s p erform an ce using an exp loited p itc her’s p itc her-sp ecific batting strategy . S ection 4 p r o vides the metho dology used to p ro duce the results giv en in Section 5 . R einfor c ement L e arning tutorial. Reinforcemen t Learning fo cuses on the problem of de cision-making facing unc ertainty , whic h are settings where the decision-mak er (agen t) interact s with a n ew, or unfamiliar, en v ir onmen t. T h e agen t con tin ually in teracts with the en vironm en t by selecting actions, where the environmen t then resp onds to these act ions an d presents new scenar- ios to th e agen t [S u tton and Barto ( 199 8 )]. This en vironment also provides r ewar ds , which are n um er ical v alues that act as feedbac k for the action se- lected by the agen t in the en vironmen t. A t time-un it t , the agen t is giv en the en viron m en t’s state s t ∈ S , and selects action a t ∈ A ( s t ), w here A ( s t ) is the set of all p ossible actions that can b e tak en at state s t . Selecting this action incremen ts the time-unit, giving the agen t a rewa rd of r t +1 and also causing it to transition to state s t +1 . Reinforcement Learning metho ds fo cus on h o w the agen t c hanges its decision-making as a consequence of its exp erimen t in the r esp ectiv e environmen t. Th e agen t’s goa l is to u se its knowledge of the environmen t to m aximize its reward o ve r the long ru n. Sp ecifying the en viron m en t therefore defines an instance of the Reinforcemen t Learning problem [S utton and Barto ( 1998 )] th at can b e stud ied further. GridWorld (Figure 2 ) is a canonical example that illustrates ho w Rein- forcemen t Learning algorithms can b e applied to v arious settings. In this ex- ample, there are four equip robable actions th at can b e tak en at eac h square (state): left, right, up and do w n, where eac h action is selected at r andom An y action tak en at either square A or B yields a r ew ard of +10 and +5, resp ectiv ely , and transp orts the user to s q u are A ′ or B ′ , resp ectiv ely . F or all 6 G. SIDHU AND B. CAFFO other squares, a reward of 0 is giv en for actions that do not resu lt in falling off the grid, w here the latte r outcome results in a rewa r d of − 1. The negativ e v alues in the lo wer parts of the grid d emonstrate that the exp ected rewa rd of square A is b elo w its immediate rewa rd b ecause after we are transp orted to s quare A ′ , we are lik ely to fall off the grid. Conv ers ely , the exp ected rew ard of square B is h igher th an its immediate rew ard b ecause after we are transp orted to square B ′ , the p ossibilit y of runn ing off the grid is comp en s ated f or by the p ossibilit y of runn ing in to squ are A or B [Sutton and Barto ( 1998 )]. Emplo yin g Reinforcemen t Learning algorithms in v arious real-wo r ld set- tings allo ws us to “bala nce” the immediate and future rew ards afforded b y the outcomes at eac h state with their resp ectiv e probabilities. Th is appr oac h enables the computation of a sequence of actions, or p olicy , that m aximize the immediate rew ard wh ile considerin g the consequences of these actions. 2. Strategic comp onen t—Reinforcemen t L earning in baseball (RL IB). 2.1. Markov pr o c esses. Let { X ( t ) } b e a Marko v p ro cess w ith finite state space S = { E 1 , . . . , E n } w h ere the states r epresen t pitc h coun ts. W e assume stationary transition probabilities. That is, p E k → E j = P ( X ( t ) = E j | X ( t − 1) = E k ) for E j , E k ∈ S is the same for all t [F eller ( 1968 )]. Figure 3 d ispla ys the Mark ov transition diagram omitting the absorbing states (hit, out and w alk). W e define optimal p olicies as a set of actions that maximize the exp ected rew ard at every state in a Mark ov p ro cess. Cond itioning on a batter’s action at a state yields the probability d istribution for the immediate and futur e state. Since the at-bat alw ays starts f rom the s 0 = { 0 , 0 } state, the long-term rew ard is defined as J ∗ ( s 0 ) = max π = { u 0 ,...,u T } E ( T X t =0 g ( s t , u t , s t +1 ) s 0 = { 0 , 0 } , π ) , (1) where: • { s t } is the sequence of states, or pitch counts, in the state space S vis- ited b y the batter for the resp ectiv e at-bat. W e defin e the set of termi- nal states —that is, states that conclude the at-bat—as E = { O , S , D , T , HR , W } ⊂ S , where O , S, D, T , HR, W are abbr eviations for O ut, Single, Double, T riple, Home Run and W alk, resp ectiv ely . • π = { u 0 , . . . , u T } is the b est batting str ategy that conta ins the b atting actions th at maximize th e exp ected rew ard of ev ery state. Since the batter can S wing or Stand at eac h state, it follo ws that u = Sw in g or u = Stand for eac h non terminal state. MONEYBaRL: EX PLOITING BASEBALL PITCHER D ECISION-MAK ING 7 Fig. 3. Our view of an at-b at as a Markov pr o c ess, wher e e ach oval denotes the state { B , S } i n the at-b at, wher e B and S ar e the numb er of b al ls and strikes, r esp e ctively, arr ows r epr esent tr ansitions, and t is the time unit that is the numb er of pitches thr own in the r esp e ctive at-b at. Asterisks denote that some states at the r esp e ctive time-unit ar e stil l valid tr ansitions at higher time-units—that is, if a b atter fouls off a pi tch at t = 3 in the { 1 , 2 } pi tch c ount, they wil l stil l b e in this state at t = 4 . We omit the terminal (absorbing) states for ne atness. • g ( s t , u t , s t +1 ) is the rewa rd fu nction whose outp ut reflects the batter’s preference of transitioning to state s t +1 when selecting the b est batting action u t from state s t . T he reward fun ction used in our study is g ( i, u, j ) = 0 , if j = { O } or j ∈ S ∩ E c , 1 , if j = { W } and u = S tand , 2 , if j = { S } an d u = Swing , 3 , if j = { D } and u = S wing , 4 , if j = { T } and u = Swing , 5 , if j = { HR } and u = Swing ∀ i / ∈ E . F urth er in formation on our formulat ion of the reward fun ction can b e found in Section 5.3.1 . Equation ( 1 ) can b e view ed as the maximized exp ected rewa r d of state { 0 , 0 } when follo wing batting strategy π , w hic h is compr ised of actions that maximize the exp ected rew ard ov er all of the at-bats { s t } giv en as input [Bertsek as and Tsitsiklis ( 1996 )]. 8 G. SIDHU AND B. CAFFO Fig. 4. Il l ustr ation of the two-stage pr o c ess of c omputing and evaluating the b atting str at- e gy that i s c om pute d over the input tr aining data. Thi s str ate gy is then given as input, along wi th the test data’s tr ansition pr ob ability m atrix P Test , to the Policy Evaluation algorithm, whi ch outputs the exp e cte d r ewar ds for e ach state when fol lowing b atting str at- e gy π . T o fin d the b atting actions that comprise th e b est batting strategy , w e find the batting action u that satisfies the optimal exp ected rew ard fun ction for state i [Bertsek as and T sitsiklis ( 1996 )]: J ∗ ( i ) = max u ∈ U X j ∈S P Training u ( i, j )( g ( i, u, j ) + J ∗ ( j )) ∀ i ∈ S ∩ E c , (2) where P Training u ( i, j ) is an estimated pr obabilit y of transitioning f rom state i to j when selecting batting actio n u on the pitc h-by-pitc h data and J ∗ ( i ) is the maximized exp ected reward of state i when selecting the action u that ac hiev es this m axim um. The V alue Iteration algorithm, sho wn in Figure 5 , solv es for the batting actions that satisfy equation ( 2 ). Intuitiv ely , the algorithm kee ps iterating unt il the state’ s rewa rd function is close to its optimal rew ard fun ction J ∗ , where in the limit J ∗ = lim k →∞ J k ( i ) ∀ i ∈ S [Patek and Bertsek as ( 1996 )]. The algorithm terminates u p on satisfying the conv ergence criterion ∆ < ε , where ε = 2 . 22 × 10 − 16 is the mac hine-epsilon p redefined in the MA TLAB programming language; this eps ilon ensu res that the reward functions of eac h state ha ve appro xim ately 15–16 digits of precision. The Poli cy Ev aluation algorithm, shown in Figure 6 , uses the b est batting strategy π on a differen t season of the r esp ectiv e pitc her’s p itc h-by-pitc h data to calculate the exp ected reward of eac h state in the at-bat, giv en b y J π ( i ) = X j ∈S P Test π ( i ) ( i, j )[ g ( i, π ( i ) , j ) + J π ( j )] ∀ i ∈ S ∩ E c , (3) where J π ( i ) is the exp ected rew ard of state i when follo w ing the b atting strategy π . MONEYBaRL: EX PLOITING BASEBALL PITCHER D ECISION-MAK ING 9 Algorithm 2.1: V alue It era tion ( P Training , g , S , U ) rep eat ∆ = 0 for eac h i ∈ S ∩ E c do v ← J ( i ) J ( i ) ← max u P j P Training u ( i, j )[ g ( i, u, j ) + J ( j )] ∆ ← max(∆ , | v − J ( i ) | ) unt il (∆ < ε ) output (deterministic p olicy π = { u 0 , . . . , u n − 1 } ) Fig. 5. T he V alue Iter ation algorithm outputs the b atting str ate gy π that maximizes the exp e ctation at e ach stat e over the input data . R eprinte d with p ermission fr om Richar d S. Sutton and Andr ew G. Barto, R einf or c ement L e arning: An Intr o duction, publishe d by The MIT Pr ess. The transition probabilit y matrices estimated via th e training and test data, r epresen ted by P Training u ( i, j ) and P Test u ( i, j ) in equations ( 2 ) and ( 3 ), resp ectiv ely , are the transition probabilities used by V alue Iteration and P olicy Ev aluation to compu te and ev aluate, resp ectiv ely , the b est batting strategy , π . The batting s tr ategie s are estimated ag ainst p robabilit y transi- tions matrices computed from either a p opu lation of at-bats for one season of a single pitc h er’s data (p itc her-sp ecific batting str ategy) or one season of a p opulation of pitc hers’ data (general batting strateg y; see Section 4.1 ). Algorithm 2.2: Policy Ev al ua tion ( P Test , g , S , π ) rep eat ∆ = 0 for eac h i ∈ S ∩ E c do v ← J ( i ) J ( i ) ← P j P Test π ( i ) ( i, j )[ g ( i, π ( i ) , j ) + J ( j )] ∆ ← max(∆ , | v − J ( i ) | ) unt il (∆ < ε ) output (J π ) Fig. 6. The Policy Evaluation algorithm, that c alculates the exp e cte d r ewar ds of every state when using the b atting str ate gy π , given by J π ∈ R n , on the input data. R eprinte d with p ermission fr om Richar d S. Sutt on and And r ew G. Barto, Re infor c ement L e arning: An I ntr o duction, publi she d by The MIT Pr ess. 10 G. SIDHU AND B. CAFFO P olicy Ev aluation therefore allo ws a quant itativ e comparison of the pitc h er - sp ecific and general batting s trategies, π p and π g , on th e same transition probabilities representing the pitc h er ’s decision-making. E quation ( 3 ) s h o ws that the { 0 , 0 } state’s exp ecte d rew ard, denoted by J ( { 0 , 0 } ), requires the exp ected r ew ard of ev ery other state to b e calculated fir st. It follo ws that J ( { 0 , 0 } ) is the exp ected rew ard of the en tire at-bat. Thus, a pitcher is ex- ploited if and on ly if J π p ( { 0 , 0 } ) ≥ J π g ( { 0 , 0 } ) [S utton and Barto ( 1998 )] (see Sectio n 2.4 ). 2.2. Mo dels. The generalit y of the Marko v p ro cess allo w s u s to prop ose mo dels with v arious degrees of resolution, which dep end s on the num b er of p h enomena consid ered at eac h state . Belo w we outline t wo mo dels of information resolution as useful starting p oin ts. 2.2.1. Simple RLIB (SRLIB). Initially , w e rep r esen ted a p itc her’s de- cisions b y conditioning the pitch outcome (reflected b y the fu ture pitc h coun t) on th e batter’s action at the previous p itc h coun t. SRLIB therefore has n = |S S ∩ E c | = 12 nont erminal state s S S = {{ 0 , 0 } , { 1 , 0 } , { 2 , 0 } , { 3 , 0 } , { 0 , 1 } , { 0 , 2 } , { 1 , 1 } , { 1 , 2 } , { 2 , 1 } , { 2 , 2 } , { 3 , 1 } , { 3 , 2 } , O , S , D , T , HR , W } . 2.2.2. Complex RLIB (CRLIB). CRLIB conditions the pitcher’s selected pitc h-type at the curren t pitc h count on b oth the pitch-t yp e and batting actions at the previous pitc h count . W e observ ed th at the MLB GameDa y system ga ve as many as 8 pitc h- t yp es for one pitc h er . W e th er efore generalized pitc h-types to four catego ries: fastball-t yp e, curveball/ c hangeup, sink in g/sliding, and k nuc kleball/unknown pitc hes. Assum in g the set of pitch-t yp es is T , our abstraction admits at most four p itc h-types for every pitc her—that is, |T | ≤ 4. The inclusion of p itc h-t yp es results in state space S C = {S S ∩ E c } × T ∪ E , where ev ery non termin al s tate incorp orates the four pitc h-types at eac h pitch coun t, giving n = |{S S ∩ E c } × T | = 48 nont erminal state s, S C = {{ 0 , 0 } , { 1 , 0 } , { 2 , 0 } , { 3 , 0 } , { 0 , 1 } , { 0 , 2 } , { 1 , 1 } , { 1 , 2 } , { 2 , 1 } , { 2 , 2 } , { 3 , 1 } , { 3 , 2 }} × T ∪ E . W e represent the exp ected r ew ard of the { 0 , 0 } state as the weigh ted a ve rage o v er the exp ected rewa rds of the four pitch types asso ciated with the { 0 , 0 } state : J π ( { 0 , 0 } ) = 1 K X t i ∈T K t i J π ( { 0 , 0 } × t i ) , MONEYBaRL: EX PLOITING BASEBALL PITCHER D ECISION-MAK ING 11 π p SRLIB = { 0 , 0 } { 1 , 0 } { 2 , 0 } { 3 , 0 } { 0 , 1 } { 0 , 2 } { 1 , 1 } { 1 , 2 } { 2 , 1 } { 2 , 2 } { 3 , 1 } { 3 , 2 } = 0 1 0 0 0 0 0 0 1 0 0 0 π p CRLIB = [ 0 1 0 0 0 1 0 0 0 1 0 0 ] ⊤ [null] ⊤ [ 0 0 1 1 1 0 0 0 1 0 1 0 ] ⊤ [null] ⊤ π g SRLIB = { 0 , 0 } { 1 , 0 } { 2 , 0 } { 3 , 0 } { 0 , 1 } { 0 , 2 } { 1 , 1 } { 1 , 2 } { 2 , 1 } { 2 , 2 } { 3 , 1 } { 3 , 2 } = 0 0 1 1 0 0 0 0 0 0 0 0 π g CRLIB = [ 0 0 1 0 1 0 1 0 1 0 1 1 ] ⊤ [ 0 0 0 1 0 0 1 1 1 0 1 1 ] ⊤ [ 0 0 0 0 0 0 1 0 1 1 1 1 ] ⊤ [null] ⊤ Fig. 7. The pitcher-sp e ci fic and gener al str ate gies, denote d by π p and π g , r esp e ctively, c ompute d on SRLIB and CRLI B for the 2009 se ason. CRLIB ’ s pi tcher-sp e cific b atting str ate gy for R oy Hal laday had an empty se c ond and f ourth r ow b e c ause the MLB GameDay system r ep orte d he di d not thr ow any Sinking/sliding or Knuckleb al l/unknown typ e pi tches in the tr ai ning data; a simil ar ar gument holds for the gener al b atting str ate gy’s fourth r ow. where K t i is the num b er of times pitc h -t yp e t i w as thro wn in the test data and K is the total num b er of pitc hes in the test data. 2.3. Il lustr ation of b atting str ate gies. W e no w illustrate the batting strate- gies th at are p r o duced by either SRL I B or CRLIB, resp ectiv ely . As shown in Figure 7 , SRLIB and CRL IB ha ve n -d imensional and ( n × 4)-dimensional batting strategies, resp ectiv ely . The action at eac h state is r epresen ted b y a binary v alue corresp onding to Stand (0) and Swin g (1). F or the strategies giv en in Figure 7 , CRLIB/SRLIB’s pitc her-sp ecific bat- ting strategy exploited Ro y Hallada y on the 2010 test data. Ho wev er, only CRLIB exploits Hallada y on the 2008 test d ata, p resumably b ecause it incor- 12 G. SIDHU AND B. CAFFO p orates inf ormation ab out h is pitc h selection, as it is b eliev ed that pitc hers often rely on their “b est pitc hes” in sp ecific p itch counts. F or example: If Hallada y thro w s a fastball in the { 2 , 2 } pitc h count, π p SRLIB selects the bat- ting actio n u = S tand , whereas π p CRLIB selects u = Swing. In comparison to the SRLIB mod el, w e see that the inclusion of pitc h type giv es the CRLIB mo del an enric h ed repr esen tation that can impro ve a batter’s opp ortun it y of r eac hing base. 2.4. Comp aring an “intui tive” and gener al b atting str ate gy. W e sho w that the general batting strategy is a more comp etitiv e b aseline p erfor- mance measure than an intuitiv e batting strategy . This int uitiv e batting strategy selects the action Swing at states { 1 , 0 } , { 2 , 0 } , { 3 , 0 } , { 2 , 1 } , { 3 , 1 } , and Stand in states { 0 , 0 } , { 1 , 1 } , { 1 , 2 } , { 2 , 2 } , { 3 , 2 } , { 0 , 1 } , { 0 , 2 } . In other w ord s, the in tuitive batting strategy reflects the in tu ition that the batter should only swing in a batter’s coun t; 3 w e sho w that these t yp es of batting strategies are in f erior to statistically computed ones, suc h as the general batting strategy . After p er f orming P olicy Ev aluation for b oth batting strategies, we ob- serv ed that the general batting s trategy outp erformed the in tuitive batting strategy 146 out of 150 times. The general batting strategy’s dominant p er- formance ju stifies its selection as the comp etiti v e b aseline p erformance mea- sure. Th us, we cannot assume that the pitc h er-sp ecific batting strategy will p erform b etter than, or ev en equal to, the general batting strategy when p erformin g Policy Ev aluation on the resp ectiv e pitc h er’s test data. Since eac h pitcher’s “b est pitc h(es)” can v ary , it follo ws that the pr obabil- it y distribu tions o ver futur e states fr om the cur ren t state will also v ary , esp e- cially in states with a b atter’s count. This is a consequence of the un iqu eness of eac h pitc her ’s b eh aviour, wh ic h is reflected th rough their pitc h selection at eac h state in the at-bat, and thereby quantified in their resp ectiv e transition probabilities. Th is is p ersonified by R. A. Dic key , as he only has one “b est pitc h” (knuc kleball) and th r o ws other pitc h t yp es to make his b eha viour less predictable. Thus, wh en Dick ey’s kn uc kleball is ineffectiv e, an optimal p olicy will r ecommend sw in ging at ev ery nonkn u c kle pitc h, as it is computed o v er data that sho ws an imp ro ved outcome for the batter. In con tr ast, pitc h er s that consisten tly thr o w more than one pitc h type for strik es, suc h as R oy Hallada y , are more difficult to exploit via the pitc h er-sp ecific batting strat- egy b ecause the impro ved outcome in swinging at their “w eak er” pitches is marginal in comparison to pitc hers that consisten tly throw fewer pitc h t yp es for strike s. Give n th at the pitc her-sp ecific and general batting str ategie s are computed o ver differen t p opulations, 4 and eac h at-bat contai ns in formation 3 Please see App endix for baseball terminology . 4 Section 1 , second last paragraph of p age 2. MONEYBaRL: EX PLOITING BASEBALL PITCHER D ECISION-MAK ING 13 ab out the resp ectiv e pitc her’s b eha viour, it follo w s th at pitc hers are not equally su sceptible to b eing exploit ed in an empirical setting. If the pitc h er-sp ecific b atting strategy p erf orms equ al to the general b at- ting strategy , the comp etitiv eness/domin ance of the latter o v er intuitiv ely- constructed batting strateg ies ensures that the r esp ectiv e pitc her is still ex- ploite d b ecause the intuitiv e batting strategy can b e viewed as the standard strategy that is employ ed in baseball. Let π i b e the intuitiv e batting strat- egy and assum e th at the pitc her-sp ecific b atting strategy p erf orm s equal to the general batting strateg y . By transitivit y , J π g ( { 0 , 0 } ) ≫ J π i ( { 0 , 0 } ), and J π p ( { 0 , 0 } ) = = J π g ( { 0 , 0 } ), then J π p ( { 0 , 0 } ) ≫ J π i ( { 0 , 0 } ). 3. Spatial comp onen t. A spatial comp onent is in tro d uced to highligh t the utilit y of the exploited pitc hers’ p itc her-sp ecific batting strateg ies. The spatial compon ent asso ciates the p itc h-t yp e based on the resp ectiv e pitch’s spatial tra jectory , where this tra jectory is parameterized sp ecifically to th e batter b eing simulated. Thus, the spatial comp onen t predicts the pitc h-t yp e for th e batter-parameterized spatial tra jectory giv en as inp ut. This allo ws us to sim ulate a batter’s p erformance wh en th ey use the exploited pitcher’s pitc her-sp ecific batting s trategy against the resp ectiv e pitc h er (see Figure 9 ). The s patial inf orm ation for eac h pitc h con tains the three-dimensional ac- celeratio n, v elo cit y , starting and en d ing p ositions. This information is ob- tained f rom the MLB GameDa y sys tem after it fits a quadr atic p olynomial to 27 in s tan taneous images represent ing the pitc h’s spatial tra jectory . These pictures are tak en by cameras on opp osite sides of the field. The MLB Game- Da y system th er efore p erform s a quadratic fit to the tra jectory data. There are t w o problems with this fit. First, accelerat ion is assum ed to b e co nstan t, wh ic h is certainly n ot tru e. Second, there exists a near-p erfect correlation b et w een v ariables obtained from the fit (suc h as v elo cit y and the end lo cation of a pitch) and the indep enden t v ariable (acceleration) us ed to pro du ce th is fit. Figure 8 displa ys pitc h lo cations along with pr edicted v alues from regression with ve lo cit y or accelerat ion as predictors and lo cation as the resp onse. W e see th at the quadratic fi t severely limits the u se of eac h pitch’s spatial tra jectory . T o address th is limitation, we us e th e instant aneous p ositions of ev ery pitc h tra jectory to predict the pitc h t yp e. 3.1. Batter-p ar ameterize d pitch identific ation. W e add α -scaled noise, where α is a batter-sp ecific p arameter, to the original spatial tra jectory of eac h p itc h to repr esent th e resp ectiv e b atter’s b eliev ed tra jectories. Th is is ac hiev ed by first drawing ind ep endent, id en tically distribu ted n oise from the uniform d istribution on the [ − 1 , 1] interv al, w hic h is then m ultiplied by the parameter α , and finally added to th e m ev enly-spaced, th r ee-dimensional, instan taneous p ositions of the original (true) pitc h tra jectory . 14 G. SIDHU AND B. CAFFO Fig. 8. The actual (squar e) and pr e dicte d (cir cle) lo c ations f or Tim Linc e cum’s pitches in the 2009 se ason, when p erforming OLS r e gr ession on br e ak angle, initial velo city, and br e ak length fe atur es to pr e dict the end lo c ation of e ach pitch. The r e ctangle in the c enter of the plot r epr esents the strike zone. F or the batter’s b elieve d tra jectories to accurately r ep resen t their pitc h - iden tifi cation abilit y , α is defined as the num b er of strik eouts divided by the n u m b er of plate app earances on the same ye ar whic h the b atting strategy is computed on. On ly considering strik eouts is ju stified by the fact that any recorded out from putting the ball in p la y implies that a pla yer ident ified the ball accurately enough to ac hiev e con tact. In contrast, a batter that strik es out either f ailed to iden tify the p itc h as a strik e or f ailed to establish conta ct with the b all. Thus, addin g α -scaled noise to original tra jectory repro duces a b atter’s b eliev ed tra jectory . Fig. 9. Il lustr ating our sp atial m o del, wher e α is p ar ameterize d ac c or ding to the b atter, K training denotes the numb er of pi tches in the r esp e ctive pitcher’s tr aining data, and 300 r epr esents the m = 100 thr e e-dimensional p oints that describ e the pitch tr aj e ctory. Her e, the L e arner is a quadr atic kernel Supp ort V e ctor Machine (SVM). MONEYBaRL: EX PLOITING BASEBALL PITCHER D ECISION-MAK ING 15 The training data’s true tra jectories are giv en as inpu t to a S upp ort V ec- tor Mac hine (SVM) [V apnik ( 1998 ), Hastie, Tibsh irani and F riedman ( 2009 )] with a qu ad r atic k ern el, wh ere eac h tra jectory’s m = 100 three-dimensional instan taneous p ositions form a single d ata p oin t that has an asso ciated pitc h - t yp e. The SVM algorithm then computes a sp atial classifier, w hic h is com- p osed of coefficients β = [ β 0 , . . . , β 300 ], that b est separates the training data’s original tra jectories according to pitc h -t yp e, usu ally with high accuracy . 5 The spatial classifier allo ws pitch-t y p e identifica tion to b e standardized across batters, b ecause the r esp ectiv e batter’s b eliev ed tra jectory is only iden tifi ed as the correct pitc h-type if it is similar to the original tra jectory . If the b eliev ed tra jectory d iffers enough from the original tra jectory , it will b e id entified as th e incorrect p itc h-t yp e; this is reflectiv e of pla yers with higher α v alues th at strik e out often. W e can therefore view the sp atial classifier as an oracle. 4. Method s and ev aluation. 4.1. Str ate gic c omp onent. F or our ev aluation, w e use 3 y ears of pitc h- b y -p itc h data for 25 elite 6 pitc hers, as shown in T able 1 . W e ev aluated the batting strategi es p erf ormance f or all six unique com b inations of th e train- ing and test data, w h ic h ga v e a total of 25 × 6 = 150 pitcher-sp ecific batting strategies. The data was obtained from MLB’s GameDa y system, w hic h pro- vided three complete seasons of pitc h ing data, contai ning the pitc h outcome, pitc h-type, num b er of balls and strikes, and the b atter’s actions. Th e tec h ni- cal details of the data co llection and formatting pro cess, which is necessary b efore applyin g the Reinforcement L earn ing algorithms, are pro v id ed in the supplement [S idhu and Caffo ( 2014 )]. Initially the general batting strategy w as trained o ver all p itc hers data for the resp ectiv e season, where it w as observ ed th at the general b atting strat- egy outp erformed th e pitc h er-sp ecific batting str ategies on the r esp ectiv e season by a significan t margin. In other w ord s, training the general batting strategy o ver all of the pitc h ers’ annual data led to in v alidation of the hy- p othesis, regardless of whether p itc hers were equally exploitable. Give n that the general b atting strategy was trained o ver a m u c h larger data set than the pitc her-sp ecific batting strategy , we sough t a w a y to stand ardize the train- ing data used to compute th e general b atting strategy , which is describ ed in the follo wing paragraph. W e ac knowledge th at in real-wo r ld settings, eac h of th e b atting strategies should b e trained o ver al l av ailable information, as th is inform ation impro ve s the resolution and precision of the p robabilit y estimates exp loited b y the batting strategy . 5 T raining accuracies are provided in T able 2 . 6 W e remind readers that our defin ition of elite is heuristically defined. 16 G. SIDHU AND B. CAFFO T able 1 The annual statistics fr om the 2008, 2009 and 2010 se asons for the 25 pi tchers use d in our evaluation ∗ 2008 2009 2010 Play er ERA WHIP W L IP ERA WHIP W L IP ERA WHIP W L IP Roy Hallada y 2 . 78 1 . 053 20 11 246 . 0 2 . 79 1 . 126 17 10 239 . 0 2 . 44 1 . 04 1 21 10 250 . 2 Cliff Lee 2 . 54 1 . 110 22 3 223 . 1 3 . 22 1 . 243 14 13 231 . 2 3 . 18 1 . 003 12 9 212 . 1 Cole Hamels 3 . 09 1 . 082 14 10 227 . 1 4 . 32 1 . 286 10 11 193 . 2 3 . 06 1 . 17 9 12 11 208 . 2 Jon Lester 3 . 21 1 . 274 16 6 210 . 1 3 . 41 1 . 230 15 8 203 . 1 3 . 25 1 . 202 19 9 208 . 0 Zac k Greinke 3 . 47 1 . 275 13 10 202 . 1 2 . 16 1 . 073 16 8 229 . 1 4 . 17 1 . 245 10 14 220 . 0 Tim Lincecum 2 . 62 1 . 172 18 5 227 . 0 2 . 48 1 . 047 15 7 225 . 1 3 . 43 1 . 272 16 10 212 . 1 CC Sabathia 2 . 70 1 . 115 17 10 253 . 0 3 . 37 1 . 148 19 8 230 . 0 3 . 18 1 . 191 21 7 237 . 2 Johan Santana 2 . 53 1 . 148 16 7 234 . 1 3 . 13 1 . 212 13 9 166 . 2 2 . 98 1 . 170 11 9 199 . 0 F elix Hernand ez 3 . 45 1 . 385 9 11 200 . 2 2 . 49 1 . 135 19 5 238 . 8 2 . 27 1 . 057 13 12 249 . 2 Chad Billingsley 3 . 14 1 . 336 16 10 200 . 2 4 . 03 1 . 319 12 11 196 . 1 3 . 57 1 . 27 8 12 11 191 . 2 Jered W ea ver 4 . 33 1 . 285 11 10 176 . 2 3 . 75 1 . 242 16 8 211 . 0 3 . 01 1 . 074 13 12 224 . 1 Cla yt on Kershaw 4 . 26 1 . 495 5 5 107 . 2 2 . 7 9 1 . 229 8 8 171 . 0 2 . 91 1 . 1 79 13 10 204 . 1 Chris Carp enter 1 . 76 1 . 304 0 1 15 . 1 2 . 24 1 . 007 17 4 192 . 2 3 . 22 1 . 179 16 9 235 . 0 Matt Garza 3 . 70 1 . 240 11 9 184 . 2 3 . 95 1 . 261 8 12 203 . 0 3 . 91 1 . 251 15 10 204 . 2 Adam W ain wrigh t 3 . 20 1 . 182 11 3 132 . 0 2 . 63 1 . 210 19 8 233 . 0 2 . 42 1 . 051 20 11 230 . 1 Ubaldo Jimenez 3 . 99 1 . 435 12 12 198 . 2 3 . 47 1 . 229 15 12 218 . 0 2 . 88 1 . 15 5 19 8 221 . 2 Matt Cain 3 . 76 1 . 364 8 14 217 . 2 2 . 89 1 . 181 14 8 217 . 2 3 . 14 1 . 0 84 13 11 223 . 1 Jonathan S an chez 5 . 01 1 . 449 9 12 158 . 0 4 . 24 1 . 365 8 12 163 . 1 3 . 07 1 . 231 13 9 193 . 1 Roy Oswa lt 3 . 54 1 . 179 17 10 208 . 2 4 . 12 1 . 241 8 6 181 . 1 2 . 76 1 . 025 13 13 211 . 2 Justin V erlander 4 . 84 1 . 403 11 17 201 . 0 3 . 45 1 . 175 19 9 240 . 0 3 . 37 1 . 163 18 9 224 . 1 Josh Johnson 3 . 61 1 . 351 7 1 87 . 1 3 . 23 1 . 158 15 5 209 . 0 2 . 30 1 . 105 11 6 183 . 2 John Danks 3 . 32 1 . 226 12 9 195 . 0 3 . 77 1 . 283 13 11 200 . 1 3 . 72 1 . 216 15 11 213 . 0 Edwin Jackson 4 . 42 1 . 505 14 11 183 . 1 3 . 62 1 . 262 13 9 214 . 0 4 . 47 1 . 395 10 12 209 . 1 Max Scherzer 3 . 05 1 . 232 0 4 56 . 0 4 . 1 2 1 . 344 9 11 170 . 1 3 . 50 1 . 24 7 12 11 195 . 2 T ed Lilly 4 . 09 1 . 226 17 9 204 . 2 3 . 10 1 . 056 12 9 177 . 0 3 . 62 1 . 079 10 12 193 . 2 ∗ Please see App endix for baseball terminology . MONEYBaRL: EX PLOITING BASEBALL PITCHER D ECISION-MAK ING 17 The size of the general batting strateg y’s training data is approximat ely equal to the a verag e n um b er of p itc hes thro w n b y the 25 pitc hers in th e resp ectiv e season, where ev ery pitc her’s at-bats in this data set were ran- domly samp led fr om all of their at-bats for the resp ectiv e season. T o ensur e the general batting strategy’s tr ainin g data is representa tive of all p itc hers’ data for the resp ectiv e season, samp ling termin ates after adding an at-bat for which the total num b er of pitc hes exceeds th e prop ortion of pitc hes that should b e con tributed by the pitc her. F or example, Roy Hallada y threw 3319 pitc hes in 2009, and all 25 p itchers thr ew a total of 80,879 pitc hes. Ro y Hal- lada y therefore contributes ⌈ 0 . 04103 × 3235 . 16 ⌉ = 133 pitc h es to th e data set. Rep eating th is pro cess for all 25 pitc h ers 2009 d ata give s a data set comprised of 3276 p itc hes. T o address the p ossibilit y that the aggregate data sample contai ns un- represent ativ e at-bats f or pitc h er(s), whic h w ou ld misrepresent the p erfor- mance of the general batting s tr ategy , the aggregate data sample was in- dep end en tly constru cted 10 times, where the general batting strategy wa s computed against eac h of the 10 (training) data samples. Th us, the gen- eral b atting strategy p er f ormance is the a verage o ve r the 10 general batting strategies’ exp ected rewards on the test data. W e ev aluate the h yp othesis un der t w o different assum ptions: all pitc h er s are equally susceptible to b eing exploited, an d all p itc hers are not equ ally susceptible to b eing exploited, w here w e b eliev e the latter assump tion is more relev ant to the real-w orld setting (see Section 2.4 for our explanation). The n ull hyp othesis is the same un der either assump tion, but th e alternativ e h y p othesis H 1 is sligh tly d ifferen t: H 0 : p = 1 2 . Th e pitc her-sp ecific and general batting strategy are equally lik ely to exp loit the resp ectiv e pitcher. H 1 : p > 1 2 . T he pitc h er-sp ecific batting s trategy will p erform: strictly b etter than the general batting strategy more th an 50% of the time (assum in g that pitc hers are e qual ly exp loitable). b etter than or e q u al to the general b atting strategy more than 50% of the time (assuming th at pitchers are not equally exploitable) . F or b oth hyp otheses, the p -v alue calculatio n is giv en b y P ( X > M ) = 150 X i = M + 1 150 i p i (1 − p ) 150 − i , where M is the num b er of pitc her-sp ecific batting strategies that exploit the resp ectiv e pitc h er (s). Und er the assump tion that the pitc h ers are equally exploitable, H 0 could not b e rejected; w h en assuming that pitc hers are not equally exploitable, H 0 w as rejected only for the C R L IB mo del ( P ( X > M ) = 3 e – 2, M = 87). 18 G. SIDHU AND B. CAFFO When P olicy Ev aluation is p erformed on the p itc her-sp ecific or general batting strategy , the pitch-t yp e thr o wn at the current pitc h count is giv en b efore selecting the batting action. I t follo ws that P olicy E v aluation implic- itly assumes that the pitc h -t yp es are alw a ys iden tified correctly . This w as a d esirable assump tion b ecause it only considers the strategi c asp ect of the at-bat when calculating the exp ected rew ards f or the resp ectiv e strategy . It follo ws that the hypothesis ev aluation is completely indep enden t of th e batters u sed in the ev aluation. 4.2. Simulating b atting str ate gies with the sp atial c omp onent. W e defin e the chance thr eshold as the p r op ortion of the m a jorit y p itc h-t yp e thro w n in the trainin g data, wh ic h serv es as a baseline f or a batter’s pitc h -t yp e identi fi- cation abilit y . W e only simulate batters wh ose b eliev ed tra jectories from the test data are classified with an accuracy ab ov e the chance threshold. T h is stipulation reflects our requirement that a batter must b e able to iden tify pitc h-types b etter than gu essin g the ma jorit y p itch-t y p e. T able 2 pr o vides the cla ssification accuracie s for the batters in cluded in our simulati on. W e u se the spatial comp onent to ev aluate t w ent y prominen t batters. Among these batters, ten are considered elite and ten are considered to b e nonelite. W e s imulate eac h b atter’s p erformance against an exp loited p itc her when u s ing the resp ective pitc her-sp ecific b atting strategy . F or ev ery at-bat that is sim u lated, the spatial comp onent first predicts the pitc h-t yp e u s ing the r esp ectiv e b atter’s b elieve d tra j ectory . Then, this predicted pitc h-t yp e is used with the current state to select the appropr iate action from the pitc her-sp ecific batting strategy; see Figure 10 . After ident ifying the p itc h-t yp e and selecting the batting action, the con- ditional distribution o ver the f uture states in the at-bat b ecomes determined. W e assign the future states “bin” lengths that are equal to th e probabilit y of transitioning to their r esp ectiv e states, wher e eac h bin is a disjoint su bint er- v al on [0,1]. W e then generate a random v alue from the uniform distribution on the [0,1] interv al and select the fu ture state whose sub interv al cont ains this r andom v alue. T o ensure that the p erformance of the b atter versus pitc her is representat iv e of eac h state’s d istribution o ver future states, ev ery at-bat is sim u lated 100 times. 5. Results. 5.1. Str ate gic c omp onent. The num b er of pitc her-sp ecific batting strate- gies th at exploited the resp ectiv e pitc her are giv en in T able 3 . The ra w results for SRLIB/CRLIB are giv en in T ables 4 and 5 , resp ectiv ely . It is apparent that no relationship exists b et w een the p erformance of the pitc her-sp ecific batting strategy and the train/test dataset pair that it was MONEYBaRL: EX PLOITING BASEBALL PITCHER D ECISION-MAK ING 19 T able 2 Evaluating the pitch identific ation abili ty on the 2009 (test) data, after tr aining the sp atial classifier on 2010 data. The ac cur acy is the numb er of c orr e ctly pr e di cte d pi tch-typ es on the r esp e ctive b atter’s b elieve d tr aje ctories fr om the 2009 se ason, af ter only observing the original tr aje ctories fr om 2010. The chanc e thr eshold i s pr ovide d to show “how m uch b etter” the b atter is doing than bl ind l y guessing one class ∗ Accuracy Batter Pitcher α T rainin g T est Chance threshold # of P A (in 2009) Miguel Cabrera Zac k Greinke 0.1466 2776 / 29 03 (95.63%) 3135 / 33 76 (92.86%) 2005 / 3376 (59.39%) 14 Joey V otto Roy Oswalt 0. 1929 3050 / 33 74 (90.4%) 1926 / 31 51 (61.12%) 1787 / 3151 (56.71%) 12 Joe Mauer Justin V erlander 0.0908 3545 / 3 633 (97.58%) 3664 / 3 794 (96.57%) 2553 / 3794 (67.29%) 14 Ichiro Suzuk i CC Sabathia 0.1175 3154 / 3736 (84.42%) 3089 / 3 985 (71.86%) 2405 / 3095 (54.99%) 11 Jose Bautista Jon Lester 0.1698 3047 / 32 63 (93.38%) 2486 / 33 97 (73.18%) 2423 / 3397 (71.33%) 11 Derek Jeter Matt Garza 0 .1434 3201 / 3 331 (96.1%) 3125 / 3 288 (95.04%) 2336 / 3288 (71.05%) 14 Prince Fielder Matt Cain 0.1933 3265 / 378 2 ( 95.85%) 3019 / 317 7 (95.03%) 1986 / 3 177 (62.51%) 9 Matt Holliday Clayton Kershaw 0. 1378 3291/332 8 ( 98.89%) 2872/306 2 (93.79%) 2163/3 062 (70.64%) 8 Ryan How ard Tim Lincecum 0.25 32 3633 / 3870 (93.88%) 3047 / 3338 (91.28%) 1874 / 3338 (56.14%) 7 Mark T eixeira Cliff Lee 0.17 13 3292 / 3427 (96.06%) 3134 / 3965 (79.04%) 2542 / 3965 (64.11%) 14 Nick Mark akis Jon Lester 0.1311 3047 / 326 3 ( 93.38%) 2475 / 339 7 (72.86%) 2423 / 3 397 (71.33%) 13 Carlos Gonzalez Matt Cain 0.2123 3265 / 3782 (95.85%) 3008 / 3177 (94.68%) 1986 / 317 7 ( 62.51%) 7 Ev an Longoria Roy Halladay 0.187 6 3712 / 3782 (98.15%) 3146 / 3319 (94.79%) 2445 / 3319 (73.67%) 23 Brandon Philips Chris Carp enter 0.1208 2884 / 3420 (84.33%) 1438 / 26 23 (54.82%) 1227 / 2623 (46.78%) 11 Manny Ramirez Jonathan Sanchez 0 .1879 3420 / 352 9 ( 96.91%) 2391 / 27 24 (87.78%) 1866 / 2724 (68.50%) 11 Adrian Gonzalez Matt Cain 0.1645 3265 / 3782 (95.85%) 3042 / 3177 (95.75%) 1986 / 3177 (62.51%) 7 Carl Cra wford CC Sabathia 0.1569 3154 / 3736 (84.42%) 3061 / 3 985 (76.81%) 2405 / 3985 (60.35%) 13 T roy T u lowitzki Cla yt on Kershaw 0.14 75 3291 / 3328 (98.89%) 2883 / 3062 (94.15%) 2163 / 3062 (70.64%) 14 Matt Kemp Jonathan Sanchez 0 .2545 3420 / 35 29 (96.91%) 2394 / 27 24 (87.89%) 1866 / 2724 (68.50%) 11 Alex Ro driguez Ro y Hallada y 0.1647 3712 / 37 82 (98.15%) 3147 / 33 19 (94.82%) 2445 / 3319 (73.67%) 18 ∗ Please see App endix for baseball terminology . 20 G. SIDHU AND B. CAFFO Fig. 10. I l lustr ating the simulation for a b atter using an exploite d pitcher’s pitcher-sp e- cific b atting str ate gy. The sp atial classifier’s pr e dicte d pitch-typ e is use d to sele ct the r ow that c ontains the b atting actions for the r esp e ctive pi tch-typ e, and the curr ent pitch c ount is use d to sele ct the b atting action for this pitch-typ e. computed and ev aluated on. This shows that the exploited pitc hers’ pitcher- sp ecific batting str ategie s d o not rely on seasonal statistics from either the training or test d ata. Instead, these batting strategies rely on the pitc her’s decision-making, which is pr esumably refl ected th rough the pitc her’s pitc h selection at eac h pitc h count. It follo ws that these characte r istics are not reflected in the resp ectiv e pitc her’s seasonal stati stics. The inclusion of pitc h-t yp es in the CR L IB mo del resulted in a larger n u m b er of exploited p itchers th an S RLIB. This su ggests the degree to wh ich a pitcher’s pitc h selection is infl uenced b y the p itc h count. W e u se the sp atial comp onent to sim ulate the batter’s p erf ormance against an exploited pitcher when using the pitc her-sp ecific batting strategy , w hic h illustr ates utilit y of these b atting strategies in act ual p la ye rs’ decision-making. T able 3 The numb er of exploite d pitchers using the r esp e ctive tr ain/test data p artitions Y ear of computed batting strategy Mod el 2008 2009 2010 2009 201 0 2008 2 010 2008 2009 SRLIB 1 1 10 5 12 11 14 CRLIB 12 15 11 16 16 16 MONEYBaRL: EX PLOITING BASEBALL PITCHER D ECISION-MAK ING 21 T able 4 V alues obtaine d f r om SRLI B after tr aining on one ye ar of data and testing on another. Sup erscripts π p , π g denote the exp e cte d r ewar d fr om the { 0 , 0 } state when f ol lowing the pitcher-sp e cific or gener al b atting str ate gy. The b olde d pitcher-sp e cific b atting str ate gies ar e b atting str ate gies that exploit the r esp e ctive pitcher on the r esp e ctive tr aining and test dataset p air T raining on 2008 data T raining on 2009 data T raining on 2010 data 2009 2010 2008 2010 2008 2009 Pla yer J π g J π p J π g J π p J π g J π p J π g J π p J π g J π p J π g J π p Ro y Hall ada y 0.655 0.604 0 .546 0.491 0 .659 0.569 0.56 9 0 . 7 66 0.699 0.560 0.638 0 . 707 Cliff Lee 0.692 0 . 706 0.566 0 . 6 22 0.680 0.622 0.558 0.499 0.678 0.664 0.707 0.571 Cole Hamels 0.716 0 . 768 0.814 0.795 0.731 0.700 0.807 0.764 0.724 0.719 0.700 0.680 Jon Lester 0.713 0 . 764 0.876 0.847 0.742 0.737 0.831 0.718 0.739 0 . 741 0.710 0.709 Zac k Greinke 0.642 0.608 0.747 0 . 835 0.795 0.688 0.739 0.719 0.824 0 . 836 0.607 0 . 672 Tim Lincecum 0.649 0 . 694 0.822 0.785 0.717 0.694 0.778 0.723 0.686 0.589 0.653 0.565 CC Sabathia 0.810 0.718 0.802 0.698 0.657 0.550 0.792 0 . 821 0.593 0.550 0.825 0 . 8 36 Johan Sant ana 0.785 0 . 862 0.773 0.703 0.680 0 . 694 0.774 0 . 838 0.651 0 . 773 0.744 0 . 8 52 F elix H er nandez 0.721 0 . 78 4 0.823 0.786 0.777 0.765 0.815 0.786 0.717 0.662 0.760 0.613 Chad Bil lingsley 0.802 0 . 865 0.788 0 . 81 2 0.750 0 . 7 90 0.792 0 . 8 12 0.752 0 . 785 0.792 0 . 8 60 Jered W eav er 0.860 0.841 0.691 0 . 734 0.762 0 . 770 0.704 0 . 711 0.770 0.759 0.883 0.840 Clayt on Kershaw 0.738 0.719 0.716 0.667 0.909 1 . 125 0.710 0.691 0.996 0.800 0.757 0 . 837 Chris Carp ent er 0.751 0.640 0.691 0 . 732 0.757 0.692 0.753 0 . 791 0.667 0 . 944 0.809 0 . 914 Matt Garza 0.827 0.792 0.794 0 . 794 0.725 0.622 0.779 0 . 834 0.692 0.622 0.797 0 . 880 Adam W ainwrigh t 0.689 0 . 690 0.692 0.648 0.609 0.578 0.694 0 . 738 0.554 0 . 636 0.707 0.705 Ubaldo Jimenez 0.735 0.709 0.767 0 . 771 0.867 0.850 0.751 0.741 0.881 0 . 968 0.741 0 . 755 Matt Cain 0.753 0 . 878 0.665 0.610 0.828 0 . 897 0.693 0.610 0.815 0 . 854 0.755 0 . 7 74 Jonathan Sanc hez 0.894 0.842 0.850 0.805 0.794 0.672 0.842 1 . 096 0.791 0.672 0.968 1 . 165 Ro y Oswalt 0.710 0.639 0.787 0.750 0.876 0.667 0.777 0.651 1.022 0. 967 0.687 0.666 Justin V erlander 0.769 0.763 0.757 0 . 758 0.883 0.758 0.758 0.755 0.930 0.914 0.758 0 . 776 Josh Johnson 0.683 0.661 0.673 0 . 701 0.716 0.691 0. 689 0 . 755 0.658 0 . 691 0.684 0 . 764 John Danks 0.813 0 . 84 5 0.807 0 . 820 0.772 0.692 0. 812 0 . 86 8 0.758 0 . 8 55 0.819 0 . 877 Edwin Jackso n 0.916 1 . 053 0.854 0. 725 0.948 0.928 0.840 0.802 0.987 0.930 0.966 0.929 Max Sche rzer 0.843 0. 707 0.794 0.732 0.854 0.728 0.789 0 . 804 0.847 0 . 899 0.868 0.774 T ed Lilly 0.714 0.568 0.740 0.666 0.774 0.770 0.689 0.613 0.792 0.780 0.708 0.690 22 G. SIDHU AND B. CAFFO T able 5 V alues obtaine d f r om CRLIB af ter tr aining on one ye ar of data and testing on another. Sup erscripts π p , π g denote the exp e cte d r ewar d fr om the { 0 , 0 } state when f ol lowing the pitcher-sp e cific or gener al b atting str ate gy. The b olde d pitcher-sp e cific b atting str ate gies ar e b atting str ate gies that exploit the r esp e ctive pitcher on the r esp e ctive tr aining and test dataset p air T raining on 2008 data T raining on 2009 data T raining on 2010 data 2009 2010 2008 2010 2008 2009 Pla yer J π g J π p J π g J π p J π g J π p J π g J π p J π g J π p J π g J π p Ro y Hall ada y 0.644 0.594 0.603 0.585 0.544 0 . 575 0.642 0 . 784 0.538 0 . 558 0.568 0 . 765 Cliff Lee 0.564 0.534 0.532 0 . 595 0.600 0.562 0.522 0.478 0.627 0 . 700 0.536 0 . 557 Cole Hamels 0.644 0 . 701 0.622 0 . 6 64 0.540 0. 537 0.595 0.484 0.526 0 . 634 0.653 0.617 Jon Lester 0.625 0.587 0.651 0 . 720 0.547 0.527 0.600 0.531 0.556 0 . 588 0.570 0 . 610 Zac k Greinke 0.526 0.465 0.630 0 . 668 0.632 0 . 643 0.636 0 . 637 0.658 0 . 762 0.499 0 . 5 59 Tim Lincecum 0.531 0 . 555 0.657 0.497 0.590 0 . 650 0.565 0 . 580 0.578 0 . 583 0.543 0 . 5 45 CC Sabathia 0.602 0.543 0.604 0 . 604 0.514 0 . 657 0.546 0 . 659 0.458 0 . 581 0.588 0 . 6 15 Johan Sant ana 0.569 0 . 591 0.510 0 . 5 33 0.538 0 . 650 0.526 0 . 533 0.482 0 . 575 0.519 0 . 6 04 F elix H er nandez 0.580 0 . 60 7 0.523 0 . 564 0.602 0.551 0.529 0 . 565 0.526 0.504 0.577 0.556 Chad Bil lingsley 0.581 0 . 597 0.608 0.576 0.565 0 . 5 73 0.598 0 . 626 0.513 0.490 0.532 0.463 Jered W eav er 0.612 0.590 0.516 0 . 555 0.554 0 . 575 0.497 0 . 634 0.573 0.546 0.638 0 . 666 Clayt on Kershaw 0.452 0.318 0.527 0.477 0.733 0.435 0.506 0 . 536 0.812 0.506 0.390 0 . 543 Chris Carp ent er 0.542 0.508 0.638 0.506 0.459 0.000 0.686 0 . 882 0.288 0.269 0.597 0 . 640 Matt Garza 0.641 0.639 0.611 0 . 647 0.539 0.500 0.663 0 . 670 0.574 0 . 589 0.597 0 . 631 Adam W ainwrigh t 0.608 0.590 0.595 0.527 0.620 0 . 785 0.589 0.588 0.464 0 . 50 4 0.601 0.546 Ubaldo Jimenez 0.547 0 . 636 0.529 0 . 5 65 0.597 0 . 690 0.497 0 . 632 0.604 0.560 0.594 0 . 597 Matt Cain 0.586 0 . 658 0.478 0 . 5 21 0.600 0.593 0.552 0.463 0.491 0 . 554 0.575 0 . 5 97 Jonathan Sanc hez 0.730 0 . 730 0.585 0.543 0.590 0. 478 0.558 0 . 773 0.593 0.447 0.729 0 . 861 Ro y Oswalt 0.621 0.534 0.498 0 . 510 0.564 0.453 0.471 0 . 473 0.598 0 . 646 0.588 0.542 Justin V erlander 0.601 0.493 0.524 0.480 0.597 0.502 0.518 0 . 541 0.619 0.597 0.547 0.546 Josh Johnson 0.519 0 . 631 0.472 0 . 520 0.667 0 . 762 0.505 0 . 519 0.582 0 . 594 0.554 0.544 John Danks 0.682 0 . 74 9 0.537 0.492 0. 518 0.512 0.502 0.478 0.502 0 . 538 0.642 0 . 65 6 Edwin Jackso n 0.659 0 . 886 0.657 0. 635 0.712 0 . 785 0.617 0.575 0.708 0 . 758 0.750 0.692 Max Sche rzer 0.667 0. 585 0.533 0 . 634 0.415 0.326 0.536 0.516 0.401 0 . 53 7 0.690 0 . 710 T ed Lilly 0.547 0 . 614 0.624 0 . 6 36 0.592 0. 516 0.589 0.522 0.576 0.507 0.497 0.429 MONEYBaRL: EX PLOITING BASEBALL PITCHER D ECISION-MAK ING 23 T able 6 The actual statistics of the eli te b atters when facing the r esp e ctive pitcher in the 2009 se ason ∗ Batter Pitcher P A AB H BB SO A VG OBP S LG Miguel Cabrera Zack Greinke 14 14 2 0 5 0.143 0.143 0.286 Joey V otto Roy Oswa lt 12 12 4 0 2 0.333 0.333 0.500 Joe Mauer Justin V erlander 14 12 4 2 3 0.333 0.429 0.917 Ichiro S uzuki CC S abathia 12 10 4 2 3 0.400 0.500 0.600 Jose Bautista Jon Lester 11 8 1 3 2 0.125 0.364 0.125 Adrian Gonzalez Matt Cain 7 7 6 0 1 0.857 0.857 1.714 Carl Crawf ord CC S abathia 13 13 4 0 4 0.308 0.308 0.538 Matt Holliday Cla yt on Kershaw 8 5 2 3 2 0.400 0.625 1.025 Manny Ramirez Jonathan San chez 1 1 9 5 2 1 0.556 0.636 1.11 1 Alex Ro driguez R o y Halladay 18 17 6 1 2 0.353 0.389 0.47 1 ∗ Please see App endix for baseball terminology . 5.2. Simulating b atting str ate gies with the sp atial c omp onent. W e c hose Miguel Cabr era, Jo ey V otto, Jo e Mauer, Ichiro Suzuki, J ose Bautista, Ad rian Gonzalez, Carl Cra w f ord, Matt Hollida y , Manny Ramir ez and Alex Ro- driguez as our elite batters, and Derek Jeter, Rya n Ho w ard , Mark T eix- eira, Nic k Mark akis, Brandon Ph ilips, Carlos Gonzalez, Prin ce Fielder, Matt Kemp, Ev an Longoria and T ro y T ulo witzki as our nonelite batters. W e used CRLIB’s strategies fr om the 201 0/200 9 train/test d ataset pair, where eac h batter’s α is calculated from the 2010 season, wh ic h is u sed to construct the resp ectiv e b atter’s b eliev ed tra jectories on the 2009 data (for the r esp ectiv e pitc h er). Th e actual and simulat ed statistics accrued by the elite b atters are pro vided in T ables 6 and 7 , resp ectiv ely . When comparing the elite batters’ sim ulated statisti cs to their actual statistics on the 2009 test d ata’s at-bats, the simulate d statistics d o not sho w an appreciable p er f ormance improv ement in comparison to the ac- tual statistics. W e ev aluated the p erformance of the ten n onelite batters to preclude the p ossibilit y that an exploited pitc h er’s pitcher-specific bat- ting strategy is detrimen tal to an elite hitter’s abilit y to get on b ase. These nonelite batters are of course exceptional hitters, but are not co nsidered as elite at other asp ects of the game. If follo win g an exploited pitc h er’s pitc her- sp ecific b atting strategy is detrimen tal to elite h itters, then nonelite hitters ma y still b enefit. Comparing the nonelite b atters’ actual statistics to th eir simulated statis- tics, sho wn in T ables 8 and 9 , resp ecti v ely , the simulate d statistics are sup er ior to the actual statistics for all of the batters. This suggests that the exp loited pitc hers’ pitc her-sp ecific batting strategies are b eneficial for nonelite pla yers. Cons id ering that Jo e Mauer, Ic hiro Suzuki, J o ey V otto, 24 G. SIDHU AND B. CAFFO T able 7 Simulate d p erformanc e of the elite b atters on the 2009 se ason using the str ate gic and sp atial c omp onents, b oth of which ar e tr aine d on 2010 data ∗ Batter Pitcher AB H BB SO A VG OBP SLG Miguel Cabrera Zac k Greinke 911 295 0 93 0.324 0.324 0.538 Joey V otto Roy Oswa lt 655 136 0 20 0 0.208 0.208 0.379 Joe Mauer Justin V erlander 723 169 0 1 27 0.234 0.234 0.390 Ichiro S uzuki CC Sabathia 775 237 0 1 38 0.306 0.306 0.452 Jose Bautista Jon Lester 701 198 0 18 1 0.282 0.282 0.413 Adrian Gonzalez Matt Cain 136 39 0 0 0.287 0.287 0.515 Carl Crawf ord CC Sabathia 978 280 0 2 31 0.286 0.286 0.457 Matt Holliday Cla yton Kershaw 755 187 0 158 0.247 0.247 0.358 Manny Ramirez Jonathan Sanchez 635 321 0 93 0.506 0.506 0.624 Alex Ro driguez Roy Halladay 662 234 0 81 0.353 0.353 0.523 ∗ Please see App endix for baseball terminology . Mann y Ramirez an d Alex Ro d riguez are generational talen ts, it is p ossi- ble that elit e batters mak e at yp ical d ecisions that only they can b enefit from. 5.3. Discussion. Before discuss in g the limiting factors on the exp eri- men t, we briefly mentio n th at the batter’s decision-making can b e exploited in a similar man n er: Batter-sp ecific b eh a viour could b e mo deled as a stochas- tic p ro cess. Reinforcemen t Learning could then b e u sed to obtain optimal pitc hin g strategies against b oth sp ecific b atters and the general p opu lation of b atters. Th is idea is relegated to futur e work. T able 8 The actual statistics of the noneli te b atters when facing the r esp e ctive pitcher in the 2009 se ason ∗ Batter Pitcher P A AB H BB SO A V G OBP SLG Derek Jeter Matt Garza 14 14 3 0 2 0.214 0.214 0.357 Ryan H o w ard Tim Lincecum 7 7 2 0 4 0.286 0.286 0.429 Mark T eixeira Cl iff Lee 14 13 2 0 3 0.154 0.214 0.231 Nick Mark akis Jon Lester 13 13 1 0 6 0.077 0.077 0.077 Brandon Ph ilips Chris Carpenter 11 10 1 3 2 0.100 0.182 0.28 2 Carlos Gonzalez Matt Cain 14 13 3 1 4 0.231 0.286 0.231 T roy T ulow itzki Cla yton Kershaw 14 13 0 1 6 0.000 0.071 0.000 Matt Kemp Jonathan Sanchez 11 11 3 0 0 0.273 0.273 0.364 Ev an Longoria Ro y Hallada y 23 17 4 4 4 0.235 0.348 0.235 Prince Fielder M att Cain 9 7 1 1 1 0.143 0.222 0.286 ∗ Please see App endix for baseball terminology . MONEYBaRL: EX PLOITING BASEBALL PITCHER D ECISION-MAK ING 25 T able 9 Simulate d p erformanc e of the nonelite b atters on the 2009 se ason using the sp atial and str ate gic c omp onents, b oth of whi ch ar e tr aine d on 2010 data ∗ Batter Pi tc her AB H BB S O A VG OBP S LG Derek Jeter M att Garza 257 110 0 0 0.428 0.428 0.656 Ryan H o w ard Tim Lin cecum 487 137 0 131 0.281 0.281 0.413 Mark T eixeira Cliff Lee 301 93 0 6 6 0.309 0.309 0.495 Nick Mark akis Jon Lester 925 383 100 125 0.415 0.522 0.520 Brandon Ph ilips Chris Carp enter 269 161 0 0 0.599 0.599 1.115 Carlos Gonzalez Matt Cain 283 86 0 59 0.304 0.304 0.435 T roy T ulow itzki Clayton Kershaw 1017 216 0 176 0.212 0.212 0.306 Matt Kemp Jonathan Sanchez 6 02 166 0 261 0.276 0.276 0.372 Ev an Longoria Roy Hallada y 1309 429 0 153 0.328 0.328 0.503 Prince Fielder Matt Cain 450 124 0 115 0.276 0.276 0.429 ∗ Please see App endix for baseball terminology . 5.3.1. Potential limitations: Str ate gic c omp onent. The reward function giv es a higher rew ard for a single than a w alk, reflecting the idea that a batter shou ld not b e indifferent b etw een a walk and a s ingle. This is b ecause a single adv ances b aserunners that are n ot on first base, wh ereas a w alk do es not. W e ac knowledge that there are cases, suc h as when there are no baserunners or one b aserunner on first base, where a single s hould b e considered equ iv alent to a w alk. Ho wev er, it is desirable to compu te a batting strategy that maximizes a batter’s exp ectatio n of reac hing base w hile also trying to win the game; adv ancing r unners is critical to winnin g in baseball. In cont rast, the slugging p ercen tage (SLG) calculation can b e in terpreted as a r ew ard function that quantifies the batter’s pr eferen ce of a sin gle, doub le, triple and home r un as 1, 2, 3 and 4, w hile ignoring w alks. Giv en th at the On-base Plus S lugging (OPS ) metric is often us ed to measure a play er’s abilit y , but do es not consider walks and hits as a fun ction of the batting action, it w as felt that the rew ard fun ction us ed in the stud y must address this shortcoming by giving a reward of 1 for a walk; b y doing so, all outcomes are considered by the same rewa rd function, wh ere the low est nonzero rew ard is a walk, w h ic h addresses the shortcomings of OPS. It is p ossib le that p erformance can b e impro ved by tuning the rewa r d function through In verse Reinforcement Learning (IRL ) [Abb eel and Ng ( 2004 )], whic h can reco v er th e optimal r ew ard f u nction. One ca v eat with IRL, ho we v er, is that it requires a near-optimal p olicy to reco ver the op- timal r ew ard f u nction, wh ic h su ggests that a go o d r ew ard function is fi rst required to d ev elop a near-optimal p olic y . W e therefore see an interdep en - dence b et w een the optimal p olicy and r ew ard f unction, wher e add r essing this in terdep endence is a fo cal p oin t of Reinforcement Learning researc h. 26 G. SIDHU AND B. CAFFO Under the assumption that all pitc h ers are not equally exploitable, the results sho w that strategizing against a sp ecific pitc her is statistically b etter than s trategizi ng against a group of th e pitchers more than 50% of the time; assuming that p itc hers are e qual ly sus ceptible to b eing exploited by either strategy , the hyp othesis w as rejected. How ev er, we argue the statistically significan t result u nder the assumption of un equal susceptibility is stronger b ecause eac h p itc her has uniqu e b eha viour that is reflected in the transition probabilities in eac h state of the at-bat (see Section 2.4 for fur ther informa- tion). Given that only t w o f ewer pitc hers are exploited under the assump tion that pitc h ers are equally susceptible to b eing exploited, which r esulted in rejection of our hyp othesis, it is p ossible that ev aluating the hyp othesis o v er a larger n u m b er of pitc hers would result in a n onrejection u nder b oth as- sumptions with the C RLIB mo d el. Imp ortant parts of the data pr o vided b y MLB’s GameDa y s ystem were incomplete. There w ere cases w h ere th e at-bat’s pitc h sequence consisted of one (or more) pitc h es that did not ha ve a pitc h-t yp e. F or the 610,1 30 at-bats in the database, there w ere 32,632 pitc h es concluded for the at-bat without pro v id ing the p itch-t y p e. This was detrimen tal to CR L IB b ecause the last pitch of an at-bat d etermined the terminal state, and the p itc h-t yp e determines the state b eing trans itioned from. W e therefore skipp ed o ver pitc hes with miss ing pitc h -typ es and simply incremented the pitc h coun t by observing w hether the u nlab eled pitc h w as a ball or strik e. W e also observ ed that the 2008 season of data contai ned many more pitc h -typ es than the 2009 and 2010 seasons for the same pitcher, wh ic h suggested that the GameDa y system data was maturing in its initial ye ars; it’s feasible that fu ture w ork using n ew er data will r ep ort even b etter results than those in this articl e. Using the four generalized pitc h -t yp es mentio ned in Section 2.2.2 may ha ve a large impact on our results. Ho wev er, there are 15 different p itc h-t yp es in the GameD a y system, and it is unreasonable to giv e CRLIB 15 × 12 + 6 states du e to issu es that w ould arise with data sparsit y , as we did not w ant to us e any sampling tec hniques. A p oten tial criticism of our batting strategy ev aluations is that they are ev aluated o ver an enti re season of data. W e emphasize the fact that we are not assu m ing that a pitcher do es n ot adju st to th e pitc h er -sp ecific batting strategy . After initially using the pitcher-specific batting strategy in the real world, we u p date the strategy using online learning algorithms, su c h as State–Act ion–Rew ard–State–Action (SARSA) [Sutton and Barto ( 1998 )]. Online learning algorithms up date and r ecompu te the p itc her-sp ecific bat- ting strategy u sing the pitc h-by-pitc h data after the pitc her adjusts to b eing exploited b y the initial batting strategy . W e u se a season of pitc h-by-pitc h data to sho w the p oten tial of our approac h w hen the pitcher do es not know they are b eing exploited. T raining and testing our mo del o v er tw o differen t seasons of pitch-b y-pitc h d ata for the same pitc h er sho w s that the pitc her- sp ecific b atting strateg y’s p erformance is not a consequence of luc k. MONEYBaRL: EX PLOITING BASEBALL PITCHER D ECISION-MAK ING 27 5.3.2. Potential limitations: Simulating b atting str ate gi e s with sp atial c om- p onent. Readers ma y argue that assuming the batter can hit the pitch if it is iden tified correctly is not represent ativ e of the at-bat setting. Ho wev er, w e are simulating the at-bat setting in a p robabilistic mann er , whic h means that there is no guaran tee that the batting action will yield a fortuitous out- come. This is b ecause batters reac h b ase less than b eing out o v er an en tire season, and this is reflected b y the large probabilit y of the out state. W e do not consider predicting the end lo cation of pitc hes b eca use th ere are t wo assumptions that w e d o not agree with: we are assumin g that th e pitc h-type and current state are related to a pitc h ’s end lo cation, and we are assuming that the pitch’s end lo cation is related to the pitc h-typ e, neither of whic h are true. In the r eal w orld, batters rarely kno w wher e the pitc h is going. Instead, they rely on id en tifying the pitc h-t yp e prior to making the c hoice of swinging or not. The limitat ions of the sp atial comp onen t stem from the absence of the ra w sp atial in formation for eac h pitc h. Another issu e some ma y h a ve with the sp atial comp onent is that, in con- junction with an exploited pitc h er’s pitc h er-sp ecific batting strategy , our mo del fails to pro duce w alks in all b u t one case. T he lac k of walks is a r e- sult of CR L IB’s pitc h er-sp ecific strategy suggesting that the b atters swin g in pitc h coun ts w here there are three balls. Swinging at pitch coun ts with three balls maximizes the batter’s exp ectation b ecause p itc hers d o not wan t to w alk the batter. W e men tioned that our mo del puts a higher pr iorit y on adv ancing baseru nners, and it is p ossible that this pr ioritizatio n d ecreased the OBP and A V G statistics. This decrease is explained by the fact that the batters are swinging in states with large exp ecte d rewards, whic h can only b e reac h ed with a base hit. Additionally , the actual n um b er of p itc hes thro wn in the at-bat may b e a limitation on ac hieving walks in our simulat ion. F or example, assu me that the actual 2009 data sho ws that the b atter chose to swing in a certa in pitc h count, and this swing led to them b eing out. Let u s also assume that exploited pitcher’s pitc her-sp ecific batting strategy selects the batting action “stand.” If this pitc h is not thro w n for a strike, th e at-bat is incomplete b ecause there are no m ore p itc hes left. A similar limitatio n that arises is when the batter id en tifies a p itc h at the resp ectiv e pitc h coun t in the test data, b ut the training data did not conta in a case with this pitc h count and pitc h-type. F or example, the b atter identifies the pitc h as a fastball in a { 3 , 0 } coun t, bu t the training data only contai ned curve balls b eing thro w n from the { 3 , 0 } count. I n either of these situations, we skip the at-bat. 7 These examples illus tr ate ho w r eal-w orld data can b e limiting on a sim u lation. 7 W e define “skipp ed” as t he termination of the current simulation. This at-bat is only sim u lated again if the 100 simulation limit has n ot b een exceeded. 28 G. SIDHU AND B. CAFFO 5.3.3. R einfor c ement L e arning in f o otb al l. P atek and Bertsek as ( 1996 ) used Reinforcement Learning to simulate the offensiv e pla y calling for a simplified ve rsion of American F o otball. Th ey computed an optimal p olicy for the offensiv e team b y giving generated sample d ata (that w as represen- tativ e of typical play) as input to their mo del. The optimal p olicy suggested runn in g, passing and r unnin g plays wh en the distance from line of scrim m age and “our” o wn goal line w as b et ween 1 and 65 yards, 66 ya rds and 94 ya rds, and 95 and 100 (touchdo wn) y ards. Th e optimal p olicy pr o duced an exp ected rew ard of − 0 . 9449 p oin ts wh en starting from the t w ent y yard line. This mean t that if the “our ” team receiv ed the ball at the t w ent y y ard lin e ev ery time, they w ould lose the game. It is p ossible that th e resu lt could hav e pro du ced a p ositiv e exp ected reward if real-w orld data w as used, but this data w as not av ailable at the time. The app ealing pr op ert y of Reinforcemen t Learning is that it allo ws the ev aluation of arbitrary strategie s given as input to the P olicy Ev aluation algorithm. O ne strategy that was reflectiv e of go o d pla y-calling in fo otball pro du ced a slight ly worse exp ected rew ard ( − 1 . 27 p oin ts) than th e optimal p olicy . Considering th at this strategy w as int uitiv e, manuall y constructed and did not p erform muc h worse than th e optimal strategy , Reinforcemen t Learning pro vides a p latform for inv estigating the strategic asp ects in sp orts. After all, eve ry team’s goal is to devise a strategy that maximizes the team’s opp ortun it y to win the game. Reinforcemen t Learning’s applicabilit y to baseball is tant alizing b ecause team p erformance dep ends on in dividual p erformance. Th e distinguish ing asp ect of Reinf orcement Learnin g in baseball (from fo otball) is th e scop e of the strategy: in f o otball, a p olicy r eflectiv e of “go o d” pla y-calling do es not change signifi can tly with the opp onen t. In baseball, the batting strategy c hanges significant ly with th e opp onent, as the batting strategy is pitc h er - sp ecific. Using an exploited pitc h er’s pitc her-sp ecific batting strategy against the resp ectiv e p itc her should increase the team’s op p ortunit y of winn ing the game, as it increases the b atter’s exp ectat ion of reac hing base. 6. Conclusion. This article sho ws ho w Reinforcemen t Learning algorithms [P atek and Bertsek as ( 1996 ), Bertsek as and Tsitsiklis ( 1996 ), S utton and Barto ( 19 98 )] can b e app lied to Mark ov Deci sion Pro cesses [La wler ( 2006 )] to s tatistica lly analyze baseball’s at-bat setting. With the w ealth of infor- mation pro vided at the p itc h-by-pitc h lev el, ev aluating a pla y er’s decision- making ab ility is no longer unrealistic. Earlier wo r k alluded to the amount of information con tained in real-w orld baseball data b eing a limiting factor for analysis [Bukiet, Harold and P ala- cios ( 1997 ) and C o ve r and Keilers ( 1977 )]. Noting this, w h at is particularly impressive ab out C RLIB’s statistically significan t resu lt, which is pro duced MONEYBaRL: EX PLOITING BASEBALL PITCHER D ECISION-MAK ING 29 under the assumption that p itc hers are not equally susceptible to b eing ex- ploited (See Section 5.3.1 ), is th at eac h pitc her-sp ecific batting strategy w as computed using a few thousand samples. In many p revious baseball arti- cles, authors ha v e used Mark ov Ch ain Monte Carlo (MCMC) tec hniques to pro du ce a sufficient num b er of samples to test their m o del [Alb ert ( 1994 ), Jensen, Sh irley and Wyner ( 2009 ), Reic h et al. ( 2006 )]. C urrently , th is is the only mo del th at uses only th e real-w orld pitc h -b y -p itc h data to pro duce a result that is b oth intuitiv e and supp orted with algo r ithmic statistics. Baseball has a ric h history of elite b atters m aking d ecisions that nonelite batters cannot. This is exemp lifi ed by Vladimir Guerrero, a fu ture first- ballot h all of fame “bad-ball h itter,” swinging at a p itch that b ounced off the dirt for a base h it durin g an MLB game. It is therefore p ossible that elite pla yers do not b enefit from an exploite d pitcher’s p itc her-sp ecific b atting strategy b ecause they mak e instinctual decisions. Given that the nonelite batters’ simulat ed statistics are sup erior to their actual statistic s, u sing the exploited pitc hers’ pitc her-sp ecific batting strategie s w ould b e incredibly useful in a real MLB game. W e feel th at m o deling th e at-bat setting as a Mark o v Decision Pro cess to statistically analyze baseball pla yers’ decision- making w ill change talen t ev aluation at the professional leve l. APPENDIX: BASEBALL DEFINITIONS A Plate App e ar anc e ( P A ) is when the batter has completed their turn batting. An at-b at ( AB ) is when a pla y er tak es their turn to bat against the opp osition’s pitc h er. Unlik e Plate App earances, at-bats do not include sacrifice flies, w alks, b eing hit b y a pitch or interference by a catc h er. A H it ( H ) is wh en a pla y er reac hes base b y putting the ball into pla y . A W alk ( BB ) is wh en a pla yer r eac hes base on four balls thr own by the pitc her. The [ pitch ] c ount is the curr en t “state” of the at-bat. This is quantified b y the num b er of balls and strik es, denoted b y B and S , resp ectiv ely , thro w n by the pitcher. This is numerically repr esen ted as B–S, where 0 ≤ B ≤ 4, 0 ≤ S ≤ 3 and B , S ∈ Z + , where Z + is the set of p ositive in tegers. Note that an at-bat h as ended if any one of the conditions is true: • ( B = 4) ∩ ( S < 3) (referred to as a w alk) • ( B < 4) ∩ ( S = 3) (a strikeo ut) • ( B < 4) ∩ ( S < 3) and the batter hit the b all in side th e field of pla y . This results in t wo disjoin t outcomes for the batter: out or hit. There is a sp ecial other case w e m en tion b elo w . 30 G. SIDHU AND B. CAFFO A F oul is wh en a play er hits the b all outside th e field of play . If S < 2, then the foul is count ed as a strike . When S = 2 and the next p itc h r esults in a foul, then S = 2. That is, if a ball is hit for a fou l with t wo strike s, the coun t r emains at t w o strik es. Ho w ever, if a foul ball is caugh t by an opp osing pla yer b efore it h its the ground, the batter is out regardless of the co unt . A Batter’s c ount is defined as a p itc h count that fa vors the batter—that is, th e num b er of balls are greater than the num b er of strik es (exception of th e 3–2 coun t, whic h is referred to as a full count) . A B aserunner is a pla ye r who is on base during his team’s at-bat. A Runner in Sc oring Position (RISP) is a b aserunner who is on second or third base. This is b ecause when an at-bat results in more th an a d ou b le, the baserunner on second base can score. Walks plus hits p er inning pitche d (WH IP) is a measurement of ho w many baserunner s a pitc her allo ws p er innin g. It is the sum of the total n u m b er of walks and hits divided b y the n umb er of innings pitc hed. Earne d Run Aver age (ERA ) is the a verag e num b er of earned runs a pitc her has giv en u p for ev ery nine innin gs pitc hed. On Base Per c entage (OBP) is a statistic w hic h represents th e num b er of times a pla y er r eac hes base either through a w alk or hit when d ivided by their tota l num b er of at-bats. Slugging Per c entage (SLG) is a measure of the h itter’s p o wer. It assigns rew ard s 1, 2, 3 and 4 for a single, double, triple and home run. SLG is a w eighte d a verag e of these outcomes. On-b ase P lus Slugging (OPS) is the sum of the O n-base P ercen tage and Slugging P ercen tage—that is, OPS = OBP + S LG. Ac kn o wledgment s. Th e follo wing ac kno wledgmen ts are strictly on the b ehalf of Gagan Sidhu: I w ould lik e to dedicate this work to a Statistical pi- oneer, Dr. Leo Breiman (1928–20 05), whose fiery an d ob jectiv e wr iting style allo w ed the S tatistica l learning communit y to garner recognition. This work w ould not hav e b een considered statist ics without Dr. Br eiman’s Statistic al Scienc e article that delineated algorithmic and classical statistical metho ds. Big thanks to Dr. Mic hael Bowling (Univ ersity of Alb erta) for b oth s up er- vising and m en toring th is pro ject in its infancy , Dr. Brian Caffo for selflessly senior-authoring this pap er, and Dr. P addo ck, the Asso ciate ed itor and re- view ers for providing h elpful comments. Last, thanks to Lauren Style s for assisting in marginalizing m y p osterior distrib ution. SUPPLEMENT AR Y MA TERIAL Supp lemen t to “MONEYBaRL: Exploiting p itc her d ecision-making u sing Reinforcemen t Learning” (DOI: 10.121 4/13-A OAS712SUPP ; .p df ). A high- lev el o verview of the tec hn ical details of the implementati on u sed in this article. MONEYBaRL: EX PLOITING BASEBALL PITCHER D ECISION-MAK ING 31 REFERENCES Abbeel, P. and Ng, A. Y. (2004). App rentices hip learning via inverse Reinforcemen t Learning. In Pr o c e e dings of the Twenty-First International Confer enc e on Machine L e arning 1. ACM, N ew Y ork. Alber t, J. (1994). Ex ploring baseball hitting data: What ab out those breakdown statis- tics? J. Amer. Statist. Asso c. 89 1066–107 4. Ber tsekas, D. P. and Tsitsiklis, J. N. (1996). Neur o-Dynamic Pr o gr amming . Athena Scientific, Nashua, N H. Bickel, J. E. (2009). On the d ecision t o take a pitch. De cis. Anal. 6 186–193. Bukiet, B. , Harold, E. R. and P alacios, J. L. ( 1997). A Marko v c hain approach to baseball. Op er. R es. 45 14–23. Co ver, T. M. and Ke ilers, C. W. (1977). An offensive earned-run aver age for baseball. Op er. Re s. 25 729–740. Feller, W. (1968). An I ntr o duction to Pr ob abili ty The ory and Its Applic ations 1 , 3nd ed. Wiley , N ew Y ork. MR0228020 Hastie, T . , Ti bshirani, R. and Friedman, J. (2009). The Elements of Statistic al L e arn- ing: Data M ining, Infer enc e, and Pr e diction , 2nd ed. Springer, New Y ork. MR2722294 Jensen, S. T. , Shirley, K. E. and Wyner, A. J. (2009). Bay esball: A Bay esian hi- erarc h ical mo del for eval uating fielding in ma jor league b aseball. Ann. Appl. Stat. 3 491–520 . MR2750670 La wler, G . F. ( 2006). Intr o duction to Sto chastic Pr o c esses , 2nd ed. Chapman & Hall/CR C, Boca R aton, FL. MR2255511 P a tek, S. D. and Be r tsekas, D. P. (1996). Pla y selection in American fo otball: A case study in neuro-dy namic programming. Reich, B. J. , Hodges, J. S . , Carli n, B. P. and Reich, A. M. (2006). A spatial analysis of b aske tball shot chart d ata. Amer. Statist. 60 3–12. MR2224131 Sidhu, G. and Caffo, B. (2014 ). Su pplement to “MONEYBaRL: Exp loiting pitcher decision-making using R einforcemen t Learning.” DOI : 10.1214 /13-A OAS712SUPP . St a llings, J. , Benn ett, B. and A merican Baseball Coaches A ssociation ( 2003). Baseb al l Str ate gies: A meric an Baseb al l Co aches Asso ciation . Hum an Kinetics, Champaign, IL. Sutton, R . S . and Bar to, A. G . (1998). R ei nfor c ement L e arning: An Intr o duction . MIT Press, Cambridge, MA. V apnik, V. N. (1998). Statistic al L e arning The ory . Wiley , New Y ork. MR1641250 University of Alb er t a 1-36 A thab asca Hall Edmonton, Alber t a T6G2E8 Canada E-mail: gagan@g-a.ca URL: http ://w ebdo cs.cs.ualb erta.ca/˜gagans Dep ar tment of Biost at istics Johns Hopkins University 615 N. W olfe Street Bal timore, Mar yland 2 1205 USA E-mail: bcaffo@jhsph.edu URL: http ://www.biostat.jhsph.edu
Original Paper
Loading high-quality paper...
Comments & Academic Discussion
Loading comments...
Leave a Comment