iGPSe: A Visual Analytic System for Integrative Genomic Based Cancer Patient Stratification
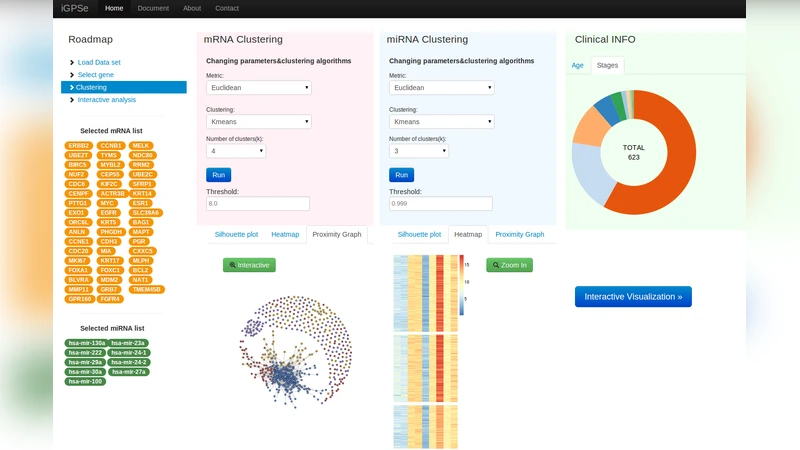
Background: Cancers are highly heterogeneous with different subtypes. These subtypes often possess different genetic variants, present different pathological phenotypes, and most importantly, show various clinical outcomes such as varied prognosis and response to treatment and likelihood for recurrence and metastasis. Recently, integrative genomics (or panomics) approaches are often adopted with the goal of combining multiple types of omics data to identify integrative biomarkers for stratification of patients into groups with different clinical outcomes. Results: In this paper we present a visual analytic system called Interactive Genomics Patient Stratification explorer (iGPSe) which significantly reduces the computing burden for biomedical researchers in the process of exploring complicated integrative genomics data. Our system integrates unsupervised clustering with graph and parallel sets visualization and allows direct comparison of clinical outcomes via survival analysis. Using a breast cancer dataset obtained from the The Cancer Genome Atlas (TCGA) project, we are able to quickly explore different combinations of gene expression (mRNA) and microRNA features and identify potential combined markers for survival prediction. Conclusions: Visualization plays an important role in the process of stratifying given population patients. Visual tools allowed for the selection of possibly features across various datasets for the given patient population. We essentially made a case for visualization for a very important problem in translational informatics.
💡 Research Summary
The paper introduces iGPSe (Interactive Genomics Patient Stratification explorer), a visual‑analytic platform designed to help biomedical researchers stratify cancer patients by integrating multiple omics data types such as mRNA expression, microRNA (miRNA) profiles, and clinical information. The authors argue that cancer heterogeneity—manifested in distinct genetic variants, pathological phenotypes, and divergent clinical outcomes—requires integrative, “pan‑omics” approaches to discover robust biomarkers for patient grouping. Traditional pipelines for multi‑omics analysis involve lengthy steps: data preprocessing, dimensionality reduction, clustering, statistical testing, and result interpretation, often taking days or weeks and demanding substantial computational expertise. iGPSe compresses this workflow into an interactive, web‑based environment that reduces the time from hypothesis to insight to a matter of minutes.
Technical Architecture
The system consists of a front‑end built with React.js and D3.js for dynamic visualizations, and a back‑end powered by Python (Flask, scikit‑learn, lifelines). Users upload or directly fetch datasets from public repositories such as The Cancer Genome Atlas (TCGA). The back‑end performs missing‑value imputation, normalization, optional dimensionality reduction (t‑SNE, UMAP), and unsupervised clustering (K‑means, PAM, hierarchical). Clustering results are returned as JSON objects for immediate rendering.
Visualization Components
- Graph View – Each patient is represented as a node; edges encode similarity based on the selected feature set. Layout algorithms preserve high‑dimensional relationships in a 2‑D/3‑D space, allowing users to perceive cluster cohesion, outliers, and inter‑cluster bridges.
- Parallel Sets – This chart visualizes how patient assignments change when different feature combinations are selected. Bars correspond to clusters, and connecting ribbons illustrate the flow of patients between clusters across feature selections. Users manipulate sliders and checkboxes to add or remove genes/miRNAs, instantly observing the impact on cluster composition.
- Survival Analysis Panel – For any selected clustering, Kaplan‑Meier curves are generated automatically, and log‑rank tests provide p‑values. This tight coupling of visual clustering with clinical outcome statistics enables rapid validation of candidate biomarker panels.
Case Study: Breast Cancer (TCGA‑BRCA)
The authors applied iGPSe to a breast‑cancer cohort comprising ~1,100 patients with matched mRNA and miRNA expression data. They experimented with several feature subsets: (a) 500 most variable mRNAs, (b) 200 most variable miRNAs, and (c) combined sets of 10 HER2‑associated mRNAs plus 5 miRNAs previously linked to tumor aggressiveness. When using the combined set, clustering yielded two major patient groups. Kaplan‑Meier analysis showed a striking survival difference: the high‑risk group had a 5‑year overall survival of 62 %, whereas the low‑risk group reached 88 % (log‑rank p < 0.01). In contrast, clustering on mRNA alone produced groups with no statistically significant survival separation. This demonstrates that integrative feature selection can uncover prognostic signals missed by single‑omics analyses.
Strengths and Contributions
- Interactive Hypothesis Loop: Researchers can iteratively refine feature sets, clustering parameters, and visualizations without writing code, dramatically shortening the exploratory cycle.
- Direct Clinical Linkage: Survival curves are generated on‑the‑fly, providing immediate feedback on the clinical relevance of any proposed biomarker combination.
- Data Flexibility: iGPSe accepts public TCGA data via API calls as well as user‑provided CSV/TSV files, supporting a wide range of study designs.
- Transparency: Visual representations of similarity graphs and parallel sets make the clustering process interpretable, helping users spot outliers or potential data quality issues.
Limitations and Future Directions
The current implementation supports a limited set of clustering algorithms; scaling to very large cohorts (tens of thousands of patients) stresses the GPU‑based graph rendering pipeline. Feature selection remains manual, raising the risk of over‑fitting. The authors propose extending the platform with automated feature importance ranking (e.g., random‑forest based Gini importance), Bayesian network inference for causal relationships, and cloud‑native deployment to handle massive datasets. Validation on additional cancer types and multi‑institutional cohorts will be essential to demonstrate generalizability.
Conclusion
iGPSe exemplifies how visual analytics can transform integrative genomics from a computational bottleneck into an intuitive, exploratory process. By coupling unsupervised clustering, interactive graph/parallel‑sets visualizations, and real‑time survival analysis, the system empowers researchers to rapidly identify and evaluate combined omics biomarkers for patient stratification. The authors anticipate that such tools will become central to precision oncology, facilitating the translation of complex multi‑omics data into actionable clinical insights.
Comments & Academic Discussion
Loading comments...
Leave a Comment