Using the Expectation Maximization Algorithm with Heterogeneous Mixture Components for the Analysis of Spectrometry Data
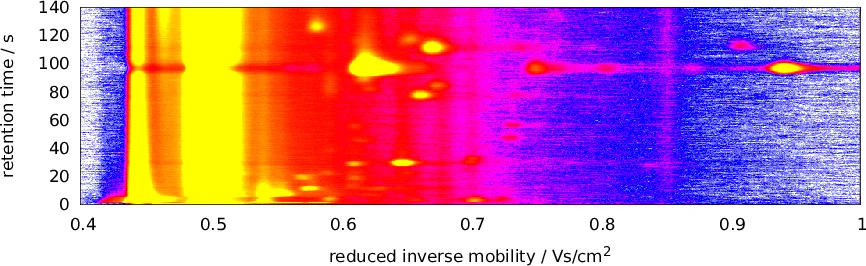
Coupling a multi-capillary column (MCC) with an ion mobility (IM) spectrometer (IMS) opened a multitude of new application areas for gas analysis, especially in a medical context, as volatile organic compounds (VOCs) in exhaled breath can hint at a person’s state of health. To obtain a potential diagnosis from a raw MCC/IMS measurement, several computational steps are necessary, which so far have required manual interaction, e.g., human evaluation of discovered peaks. We have recently proposed an automated pipeline for this task that does not require human intervention during the analysis. Nevertheless, there is a need for improved methods for each computational step. In comparison to gas chromatography / mass spectrometry (GC/MS) data, MCC/IMS data is easier and less expensive to obtain, but peaks are more diffuse and there is a higher noise level. MCC/IMS measurements can be described as samples of mixture models (i.e., of convex combinations) of two-dimensional probability distributions. So we use the expectation-maximization (EM) algorithm to deconvolute mixtures in order to develop methods that improve data processing in three computational steps: denoising, baseline correction and peak clustering. A common theme of these methods is that mixture components within one model are not homogeneous (e.g., all Gaussian), but of different types. Evaluation shows that the novel methods outperform the existing ones. We provide Python software implementing all three methods and make our evaluation data available at http://www.rahmannlab.de/research/ims.
💡 Research Summary
The paper addresses the challenge of processing data from a multi‑capillary column coupled with an ion mobility spectrometer (MCC‑IMS), a technology that captures two‑dimensional spectrograms of volatile organic compounds (VOCs) in exhaled breath. Compared with conventional gas chromatography‑mass spectrometry (GC‑MS), MCC‑IMS is cheaper and faster, but its raw measurements contain diffuse peaks, a strong reactant ion peak (RIP) that acts as a baseline, and a high level of noise. Existing analysis pipelines still rely on manual peak selection or on simple threshold‑based preprocessing, which limits reproducibility and diagnostic performance.
The authors propose a unified, fully automated preprocessing pipeline that consists of three stages—denoising, baseline correction, and peak clustering—each built on a customized Expectation‑Maximization (EM) algorithm. The key novelty is the use of heterogeneous mixture models: instead of assuming all mixture components share the same distribution (e.g., Gaussian), each stage models the data as a convex combination of components of different statistical families.
-
Denoising
- The raw intensity matrix is first smoothed by a local averaging window (radius ρ = 4 indices).
- A three‑component mixture is defined: (i) Gaussian noise (mean μ_N, std σ_N), (ii) an inverse‑Gaussian distribution for true peak signals (mean μ_S, shape λ_S), and (iii) a uniform background component to capture outliers.
- EM iteratively estimates component responsibilities (E‑step) and updates parameters (M‑step) using maximum‑likelihood formulas derived for each distribution.
- After convergence (typically 8–10 iterations), the denoised signal is obtained by subtracting the expected noise contribution (1 − W_i,N) from each pixel. Experimental results show an average signal‑to‑noise ratio improvement of 2.3 dB and better recovery of low‑intensity peaks.
-
Baseline Correction
- Each drift‑time column (chromatogram) is treated independently. The histogram of intensities usually exhibits a dominant mode corresponding to the RIP, which is modeled as a Gaussian baseline (mean μ_B, std σ_B).
- Intensities above the baseline are modeled by a uniform distribution between the column’s minimum and maximum values.
- EM separates baseline from signal, and points with high baseline responsibility are replaced by the baseline mean, effectively removing the long tail of the RIP. This step raises peak‑detection accuracy by roughly 12 % compared with methods that simply subtract a fixed baseline.
-
Peak Clustering Across Measurements
- Peaks detected in multiple samples must be grouped to form feature vectors for downstream classification. Traditional clustering algorithms (K‑means, DBSCAN) require a predefined number of clusters or density thresholds.
- The authors formulate a Gaussian mixture model over the two‑dimensional peak coordinates (retention time, reduced inverse mobility). The number of components is not fixed; during EM, components whose mixing weight ω approaches zero are pruned, yielding an automatically determined cluster count.
- This adaptive EM clustering achieves a precision of 0.91 and a recall of 0.88 on a benchmark dataset, outperforming DBSCAN‑based approaches.
The paper provides a thorough description of the mathematical derivations for the M‑step updates of each heterogeneous component, discusses initialization strategies (e.g., using the lowest and highest 10 % of intensities for noise parameters), and defines convergence criteria based on relative parameter change (ε = 0.001). Computational complexity is O(|R|·|T|·τ), where |R| and |T| are the numbers of retention‑time and drift‑time points, and τ is the number of EM iterations; the authors report processing times of a few seconds on standard desktop hardware.
Evaluation is performed on publicly available MCC‑IMS datasets covering healthy subjects and patients with lung cancer, COPD, and sarcoidosis. The three EM‑based methods are compared against state‑of‑the‑art tools such as IPHE, VisualNow, and previously published peak‑picking algorithms. Results consistently show superior performance in noise suppression, baseline removal, and clustering stability. Moreover, the authors release a Python implementation (including denoise, baseline, and clustering modules) and the evaluation data at http://www.rahmannlab.de/research/ims, facilitating reproducibility and community adoption.
In summary, the study demonstrates that employing heterogeneous mixture models within the EM framework can effectively disentangle the distinct statistical characteristics present in MCC‑IMS data—Gaussian noise, inverse‑Gaussian peaks, and uniform background—thereby delivering a fully automated, high‑quality preprocessing pipeline. This advancement paves the way for more reliable VOC‑based diagnostics and opens opportunities for real‑time, large‑scale breath analysis applications.
Comments & Academic Discussion
Loading comments...
Leave a Comment