Change Point Analysis of Histone Modifications Reveals Epigenetic Blocks Linking to Physical Domains
Histone modification is a vital epigenetic mechanism for transcriptional control in eukaryotes. High-throughput techniques have enabled whole-genome analysis of histone modifications in recent years. However, most studies assume one combination of hi…
Authors: Mengjie Chen, Haifan Lin, Hongyu Zhao
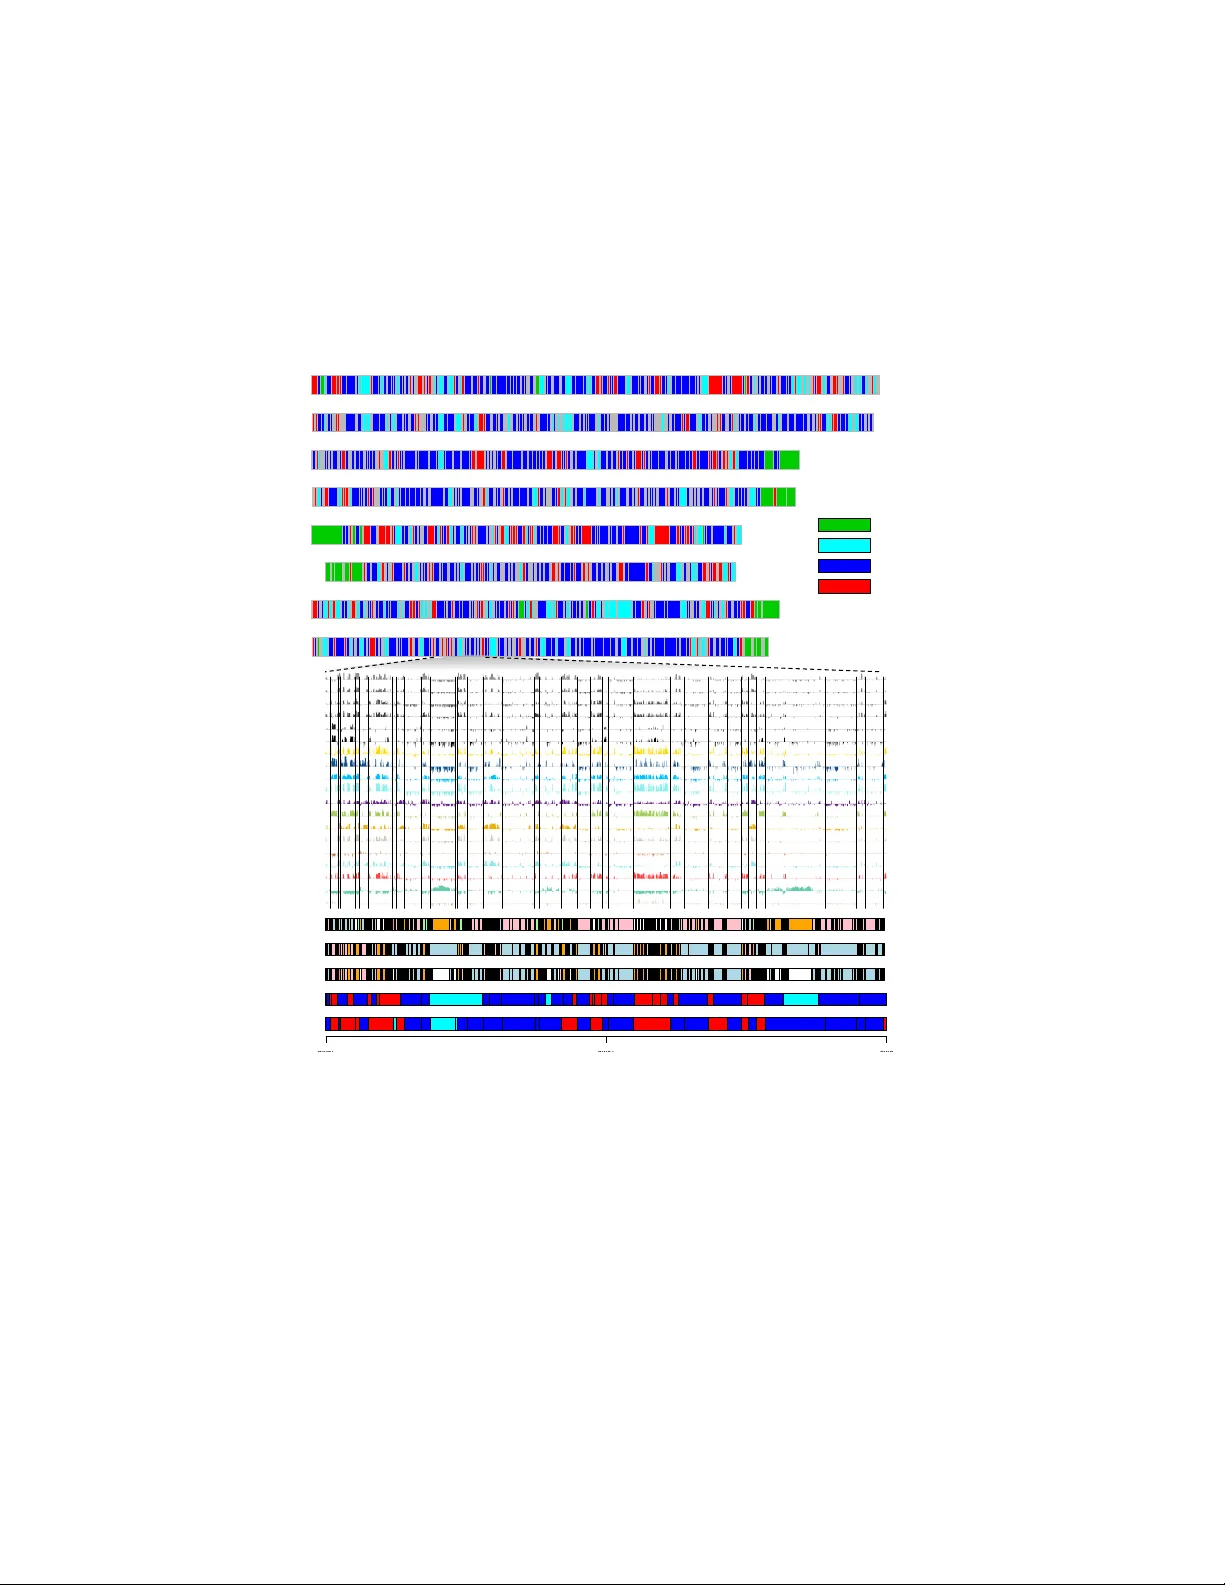
Submitte d to the Annals of Applie d Statistics CHANGE POINT ANAL YSIS OF HISTONE MODIFICA TIONS REVEALS EPIGENETIC BLOCKS LINKING TO PHYSICAL DOMAINS By Mengjie Chen , Haif an Lin † and Hongyu Zhao ∗ , ‡ Y ale University Histone mo dification is a vital epigenetic mechanism for tran- scriptional con trol in euk ary otes. High-throughput tec hniques ha ve enabled whole-genome analysis of histone mo difications in recen t y ears. How ever, most studies assume one combination of histone mo dification in v ariantly translates to one transcriptional output re- gardless of local c hromatin en vironmen t. In this study we h yp oth- esize that, the genome is organized into local domains that mani- fest similar enrichmen t pattern of histone mo dification, which leads to orchestrated regulation of expression of genes with relev ant bio- logical functions. W e propose a multiv ariate Ba yesian Change P oint (BCP) model to segment the Dr osophila melano gaster genome into consecutiv e blocks on the basis of com binatorial patterns of histone marks. By modeling the sparse distribution of histone marks across the chromosome with a zero-inflated Gaussian mixture, our parti- tions capture local BLOCKs that manifest relatively homogeneous enric hment pattern of histone mo difications. W e further character- ized BLOCKs b y their transcription levels, distribution of genes, de- gree of co-regulation and GO enrichmen t. Our results demonstrate that these BLOCKs, although inferred merely from histone modifica- tions, rev eal strong relev ance with physical domains, which suggest their important roles in c hromatin organization and coordinated gene regulation. 1. In tro duction. Epigenetics refers to the study of heritable c hanges affecting gene expression and other phenotypes that o ccur without a change in DNA sequence. Epigenetic mechanisms, including c hromatin remodeling, histone modification, DNA meth ylation and binding of non-histone proteins, pro vide a fundamen tal lev el of transcriptional con trol. Extensive studies on histone mo difications ha ve led to the “histone code” hypothesis that histone mo difications do not occur in isolation but rather in a com binatorial manner ∗ Corresp onding author † Supp orted b y a National Institutes of Health grant DP1 OD006825 ‡ Supp orted by a National Institutes of Health grant GM59507 and a National Science F oundation gran t DMS 1106738 Keywor ds and phr ases: Ba yesian change p oin t mo del, Histone mo dification, chromoso- mal domain 1 2 M. CHEN ET AL. to pro vide “ON” or “OFF” signature for transcriptional even ts ( Allis , 2007 ). Genome-wide studies using high-throughput tec hnologies such as c hro- matin immunoprecipitation (ChIP) follo wed b y microarra y analysis (ChIP on c hip) or deep sequencing (ChIP-seq) hav e b egun to decipher the “histone co de” at the genome-wide scale. Currently , a common approach to assess c hromatin states using these data is a multiv ariate Hidden Marko v Mo del (HMM) introduced by Ernst and Kellis ( 2010 ), which has b een employ ed in sev eral mo dENCODE and ENCODE pro ject publications ( mo dENCODE Consortium 2010 , Kharchenk o et al. 2011 , Riddle et al. 2011 , Eaton et al. 2011 ). This mo del asso ciates each 200bp genomic window with a particu- lar state, generating a chromatin-cen tric annotation. How ever, a pre-defined n um b er of states needs to b e specified in HMMs and it is difficult to justify and in terpret a particular choice. Different studies trying to balance reso- lution and in terpretability based on different criteria often led to different n um b ers of states, b oth b et w een different organisms ( Ernst and Kellis 2010 , mo dENCODE Consortium 2010 ) and within the same organism ( Filion et al. 2010 , mo dENCODE Consortium 2010 ). Moreo ver, HMM summarizes c hro- matin information in a vector of “emission” probabilities asso ciated with eac h c hromatin state and a v ector of “transition” probabilities with whic h differen t c hromatin states o ccur in spatial relationship of eac h other ( Ernst and Kellis 2010 ). These settings assume the homogeneity of hidden states and their transitions across the genome. How ev er, since histone mo difica- tions are outcomes of interpla y with lo cal en vironmen t, the assumption of spatial homogeneit y may not hold at the genome level. T o address the limitations in the HMM-based approac hes, w e prop ose an alternativ e approac h to examining combinatorial histone marks at coarse scales. W e h yp othesize that the genome is organized into lo cal blo c ks that displa y regionalized histone signatures. Those blo c ks ma y hav e imp ortan t roles in orc hestrated regulation of expression of genes with relev an t biological functions. W e note that our approach does not require a pre-defined n um b er of possible states and it identifies local patterns without the assumption on spatial homogeneit y . T o computationally infer these blocks, w e prop ose a m ultiv ariate Ba yesian Change P oin t (BCP) mo del which is capable of incorp orating b oth lo cal and global information. The BCP mo del was first prop osed b y Barry and Hartigan ( 1992 , 1993 ) to describ e a pro cess where the observ ations can b e considered to arise from a series of contiguous blo c ks, with distributional pa- rameters differen t across blo c ks. One of the inferen tial goals is to identify the c hange p oin ts separating con tiguous blocks. By “assuming probability of any partition is proportional to a pro duct of prior cohesions, one for each block 3 in the partition, and that given the blocks the parameters in differen t blo c ks ha v e indep enden t prior distributions” ( Barry and Hartigan 1992 , 1993 ), a fully Bay esian approach can b e adopted to detect change p oin ts from a se- quence of observ ations. Barry and Hartigan ( 1992 ) considered in detail the case where the observ ations X 1 , ... , X n are indep enden t and normally dis- tributed given the sequence of parameters µ l with X i ∼ N ( µ l , σ 2 ) where the observ ations from the same blo c k l ha ve the same µ l . This metho d has been used b y Erdman and Emerson ( 2008 ) to segment microarra y data. How ever, this mo del cannot b e directly applied to infer histone mo dification blo c ks b ecause observ ed mo dification data do not follo w normal distributions. This is due to the fact that histone modifications are usually observed at a small prop ortion of the genome lo cations with remaining of the input signal b eing (or near) zero (Figure S1). Moreov er, individual histone mo difications may ha v e spatially shifted pattern b ecause of physical constraint on o ccupancy . T o address these unique features, here w e rep ort a new multiv ariate BCP mo del through the introduction of a zero-inflated Gaussian mixture distri- bution, to partition the genome into blo c ks where each blo c k is relatively homogeneous with resp ect to histone marks. 1.1. Outline of the Pap er. W e organized the pap er as follo wing. In Sec- tion 2 , w e presen t the methodological details of the BCP mo del with a mixture prior and an MCMC algorithm to infer the p osterior probability . Section 3 presen ts results from simulation studies. In Section 4 , we describ e a systematic change p oin t analysis of the D. melano gaster genome with a comp endium of histone marks in S2 cells with mo dENCODE data.The iden- tified chromosomal blo c ks are called as BLOCKs in the rest of this article. In the follo wing Section, we present tw o sets of exploratory analysis, with Section 3 studying BLOCKs’ relationship with physical domains and Sec- tion 3 in vestigating the functional relev ance of BLOCKs. In Section 3 , w e compare our results with HMM. W e conclude the pap er with a summary and discussion in Section 5 . 1.2. Notations. W e denote the densit y function of N ( µ, σ 2 ) by φ ( ·| µ, σ ), and denote the densit y function of Beta( a, b ) by ψ ( ·| a, b ). The Dirac function δ indicates the point mass at 0. F or a set S , # S is the cardinalit y of S . F or a random v ariable X , { X = 1 } is the indicator function taking v alue 1 if X = 1 and taking v alue 0 if X 6 = 1. The indicator function { X = 0 } is defined in the same w a y . The set { i + 1 , i + 2 , ..., j } with in tegers i < j is denoted by ( i : j ). The function f ( ·|· ) is a generic notation for conditional densit y when the distribution is clear in the context. 4 M. CHEN ET AL. 2. Metho d. 2.1. A BCP mo del for blo ck identific ation. The observ ation we hav e is a M × n data matrix X = ( X 1 , ..., X M ) T , where eac h X m for m = 1 , ..., M is a mo dification mark with length n . W e first describ e the lik eliho od of eac h X m and then combine them together. F or notational simplicity , w e suppress the subscript and write X instead of X m . Let X = ( X 1 , ..., X n ) b e a vector with length n . Create another vector Z = ( Z 1 , ..., Z n ) to indicate whether eac h X h is zero or not. That is, Z h = 0 if X h = 0, and Z h = 1 if X h 6 = 0. Note Z is fully determined by X . F or the index set { 1 , ..., n } , let ρ b e a partition of this set. That is ρ = { S 1 , ..., S N } , with { 1 , ..., n } = S N l =1 S l and S l 1 T S l 2 = ∅ for all l 1 6 = l 2 . The n um b er N represents the num b er of blocks of { 1 , ..., n } . F or the c hange-p oin t problem, each S l is a contiguous subset of { 1 , ..., n } . That is, S l = ( i : j ) = { i + 1 , ..., j } for some i < j . 2.1.1. Likeliho o d. Given the partition ρ = { S 1 , ..., S N } , X k follo ws a mix- ture distribution X k ∼ (1 − λ ) N ( µ l , σ 2 ) + λδ , for k ∈ S l and eac h l = 1 , ..., N . The parameter µ l is blo c k-sp ecific, while σ and λ are shared among differ- en t blo c ks. The parameter λ describ es how likely X k is zero. Thus, given ( ρ, µ 1 , ..., µ N , λ, σ ), the lik eliho o d of ( X , Z ) can be fully sp ecified. That is, (2.1) L ( X , Z | ρ, µ 1 , ..., µ N , λ, σ ) = N Y l =1 f ( X S l , Z S l | µ l , λ, σ ) , where for eac h l with S l = { i + 1 , ..., j } , f ( X S l , Z S l | µ l , λ, σ ) (2.2) = (1 − λ ) # { k ∈ S l : Z k =1 } λ # { k ∈ S l : Z k =0 } Y { k ∈ S l : Z k =1 } φ ( X k | µ l , σ ) , (2.3) where X S l = ( X i +1 , ..., X j ) and Z S l = ( Z i +1 , ..., Z j ). 2.1.2. Prior. W e proceed to sp ecify the prior distribution on the param- eters ( ρ, µ 1 , ..., µ N , λ, σ ). ρ ∼ N Y l =1 c ( S l ) , (2.4) µ l ∼ N µ 0 , σ 2 0 d − 1 l for eac h l with S l = { i + 1 , ..., j } , (2.5) and d l = # { k ∈ S l : Z k = 1 } , λ ∼ Beta( a, b ) . (2.6) 5 The prior ( 2.4 ) on the partition ρ is called pro duct partition mo del, which w as originally describ ed in Barry and Hartigan ( 1993 ). The quantit y c ( S l ) is called cohesion. In this pap er, c ( S l ) is defined to b e c ( i : j ) = (1 − p ) j − i − 1 p when j < n and c ( i : j ) = (1 − p ) j − i − 1 when j = n , where 0 ≤ p ≤ 1 and S l = { i + 1 , ..., j } as mentioned b efore. This sp ecification implies that the sequence of c hange p oin ts forms a discrete renewal process with inter-arriv al times iden tically geometrically distributed. The priors ( 2.5 ) and ( 2.6 ) are conjugate priors with resp ect to the likelihoo d. The prior on the v ariance σ 2 will b e join tly sp ecified with the h yp er-parameters. T o pursue a fully Ba yesian approach, we put priors on the h yp er-parameters ( p, µ 0 , σ 0 ) in ( 2.4 ) and ( 2.5 ). Define w = σ 2 σ 2 + σ 2 0 . W e jointly specify the priors on the h yp er-parameters together with the prior on σ 2 . µ 0 ∼ 1 , −∞ < µ 0 < ∞ (2.7) σ 2 ∼ 1 σ 2 , 0 ≤ σ 2 < ∞ , (2.8) w ∼ 1 w 0 , 0 ≤ w ≤ w 0 , (2.9) p ∼ 1 p 0 , 0 ≤ p ≤ p 0 . (2.10) The priors ( 2.7 ), ( 2.9 ) and ( 2.10 ) are uniform priors. They reflect our igno- rance of knowledge. The prior ( 2.8 ) can b e viewed as a uniform distribution on the logarithmic scale. Notice ( 2.7 ) and ( 2.8 ) are improp er priors. This will not cause problem in view of our sampling pro cedure describ ed later. 2.1.3. Posterior. Our goal here is to find the p osterior distribution of the partition, whic h is f ( ρ | X , Z ). According to Bay es formula, (2.11) f ( ρ | X , Z ) = Q M m =1 f ( X m , Z m | ρ ) f ( ρ ) R Q M m =1 f ( X m , Z m | ρ ) f ( ρ ) dρ . Since the denominator of ( 2.11 ) is complicated, w e need to use MCMC to sample from the p osterior b y (2.12) f ( ρ | X , Z ) ∝ M Y m =1 f ( X m , Z m | ρ ) f ( ρ ) . The conditional densit y f ( X , Z | ρ ) is b y integrating out the likelihoo d func- tion ( 2.1 ) using the prior of ( µ 1 , ..., µ N , λ, σ ) sp ecified in ( 2.5 ), ( 2.6 ), ( 2.7 ), 6 M. CHEN ET AL. ( 2.8 ) and ( 2.9 ). The prior f ( ρ ) is by integrating out f ( ρ | p ) specified in ( 2.4 ) with resp ect to ( 2.10 ). W e first find f ( ρ ). f ( ρ ) = 1 p 0 Z p 0 0 f ( ρ | p ) dp = 1 p 0 Z p 0 0 N Y l =1 c ( S l ) ! dp = 1 p 0 Z p 0 0 Y S l = { i +1 ,...,j } c ij ! dp = 1 p 0 Z p 0 0 p N − 1 (1 − p ) n − N dp. (2.13) Then, we contin ue to find f ( X , Z | ρ ). W e first integrate out ( µ 1 , ..., µ N , λ ) in ( 2.1 ) using ( 2.5 ) and ( 2.6 ). Remember ψ ( λ, b ) is the density of Beta( a, b ). Using ( 2.3 ) as the representation of ( 2.1 ), we ha v e f ( X , Z | ρ, µ 0 , w, σ ) (2.14) = N Y k =1 Z Y { k ∈ S l : Z k =1 } φ ( X k | µ l , σ ) φ µ l | µ 0 , σ 0 d − 1 / 2 l dµ l × Z 1 0 N Y k =1 (1 − λ ) # { k ∈ S l : Z k =1 } λ # { k ∈ S l : Z k =0 } ψ ( λ | a, b ) dλ = Y { ( i : j )= S l ∈ ρ } A × (2 π σ 2 ) − T 2 w N 2 exp − 1 2 σ 2 W + w B + w T ( µ 0 − ¯ X T ) 2 ! , where T = n X k =1 { Z k = 1 } ¯ X T = T − 1 n X k =1 X k ¯ X ( i : j ) ,Z k = 1 # { Z k = 1 } X { k : Z k =1 ,i=96% Block Size T ranscription D ● ● ● ● ● ● ● ● ● ● ● ● ● ● ● ● ● ● ● 0 50 100 <=5% 6%~35% 36%~65% 66%~95% >=96% Block Size Gene Density C Fig 3 . BLOCKs char acterization. A. A lo cus on chr omosome 2R with four BLOCKs display diverse sizes, gene density and tr anscription activity (c orr esp onde d “chr omatin states” annotation fr om Kharchenko et al. ( 2011 ) shown on the top). B. T r anscription activity vs. gene density with blo ck size shown in gr adient. C. Box plot for gene density on five blo ck size quantiles. D. Box plot for tr anscription activity on five blo ck size quantiles. 4.2. BLOCK b oundaries ar e p otential ly physic al domain b oundaries. A recen t published high-resolution chromosomal contact map on Dr osophila em bry onic nuclei ( Sexton et al. 2012 ) sho wed that the en tire genome is lin- early partitioned in to well-demarcated ph ysical domains. W e therefore stud- ied the link b et ween physical domains and BLOCKs that w e inferred from histone mo difications. A total of 966 physical domains w ere identified from Dr osophila embry onic nuclei ( Sexton et al. 2012 ) chromosome 2L, 2R, 3L and 3R with the sizes ranged from 10kb to 823kb and a median of 60kb. W e observ ed strong asso ciation b et ween physical domains and BLOCK bound- aries. F or example, 38% of BLOCK b oundaries are within 10kb of physical domain b oundaries whereas this proportion nev er exceeds 26% in 1000 ran- domized blo c k partitions and 56% of BLOCK b oundaries are within 20kb of ph ysical domain b oundaries whereas this prop ortion nev er exceeds 42% in 1000 randomized blo c k partitions. In ( Sexton et al. 2012 ), the authors characterized ph ysical domains into four epigenetic classes based on the enrichmen t of epigenetic marks. Out of the four classes, transcriptional “Active” domains are asso ciated with H3K4me3, H3K36me3, and h yp eracet ylation, “PcG” domains are asso ci- ated with the mark H3K27me3, “HP1/Cen tromere” class is asso ciated with 13 HP1 and “Null” domains are not enriched for any av ailable marks. W e ex- plored whether BLOCKs can b e aligned to the classification in ( Sexton et al. 2012 ). W e assigned the four classes to BLOCKs based on enrichmen t of H3K4me3, H3K27me3 and HP1a. F or BLOCKs, ones with a verage in ten- sities of HP1a greater than 1 and cov erage greater than 10% are classified as “HP1/Centromere” domains, ones with a verage intensities of H3K27me3 greater than 0.5 and cov erage greater than 25% are classified as “PcG” domains, ones with av erage intensities of H3K27me3 greater than 1 and co v erage greater than 25% are classified as “Active” domains and all re- maining are c haracterized as “Null” domains. Figure 4 shows the alignment b et ween BLOCKs and physical domains with epigenetic classes. The high concordance b et ween BLOCKs and physical domains suggests that BLOCKs bridge the link b et ween epigenetic domains with top ological domains. The difference ma y b e in tro duced b y techniques, data quality and cell t yp es used in the t wo studies. Another indirect evidence for BLOCKs as physical domains is the consis- tency with replication timing. Replication timing refers to the order in which segmen ts of DNA along the length of a c hromosome are duplicated. Since the pac k aging of DNA with proteins into chromatin takes place immediately af- ter the DNA is duplicated, replication timing reflects the order of assem bly of c hromatin. Recent studies suggest that late-replicating regions generically define not only a repressed but also a ph ysically segregated nuclear com- partmen t. Thus replication timing is a manifestation of spatial organization of the chromosome. T o in vestigate the asso ciation of BLOCKs with repli- cation timing, we compared BLOCKs with the meta p eaks of replication origins (10kb to 285kb) from cell lines BG3, Kc and S2 analyzed by mo d- ENCODE pro ject. W e observ ed that 58% of meta peaks are within 20kb of BLOCK b oundaries. This statistic agrees with physical domains w ell since w e observ ed that 60% of meta p eaks within 20kb of ph ysical b oundaries c haracterized in Sexton et al. ( 2012 ). 4.3. F unctional r elevanc e of BLOCKS. T o in vestigate whether BLOCKs represen t domains of functional imp ortance, w e p erformed three different analyses. First, we c hec ked whether genes within each BLOCK tended to b e co-regulated using transcriptome in L1 larv ae and 10-12h em bryo measured b y RNA-seq. A total of 11376 FlyBase genes w ere used in our analysis. When a gene had multiple isoforms, only the isoform with the broadest genomic o ccupancy w as used. W e defined the expression c hange status of each gene in L1 larv ae stage (and 10-12h em bryo) using expression lev els in S2 cell as a reference by the following rule: genes whose expression increased by more 14 M. CHEN ET AL. color coded b loc ks chr2L chr2R chr3L chr3R BLOCKs Sexton et al BLOCKs Sexton et al BLOCKs Sexton et al BLOCKs Sexton et al 8Mb 10Mb 12Mb HP1a H3K27Me3 H3K4Me3 H3K18Ac H3K23Ac H3K27Ac H3K36Me1 H3K36Me3 H3K4Me1 H3K4Me2 H3K79Me2 H3K79Me1 H3K9Ac H3K9Me2 H3K9Me3 H4Ac H4K16Ac H4K5Ac H4K8Ac ChromHMM 5 − state ChromHMM 3 − state ChromHMM 4 − state Physical Domain Sexton et al BLOCKs 8Mb 10Mb 12Mb HP1a H3K27Me3 H3K4Me3 H3K18Ac H3K23Ac H3K27Ac H3K36Me1 H3K36Me3 H3K4Me1 H3K4Me2 H3K79Me2 H3K79Me1 H3K9Ac H3K9Me2 H3K9Me3 H4Ac H4K16Ac H4K5Ac H4K8Ac Chr omHMM 5 − state Chr omHMM 3 − state Chr omHMM 4 − state Ph ysical Domain Se xton et al BLOCKs 8Mb 10Mb 12Mb HP1a H3K27Me3 H3K4Me3 H3K18Ac H3K23Ac H3K27Ac H3K36Me1 H3K36Me3 H3K4Me1 H3K4Me2 H3K79Me2 H3K79Me1 H3K9Ac H3K9Me2 H3K9Me3 H4Ac H4K16Ac H4K5Ac H4K8Ac Chr omHMM 5 − state Chr omHMM 3 − state Chr omHMM 4 − state Ph ysical Domain Se xton et al BLOCKs Active Null PcG HP1/centromeric A B Fig 4 . A. The alignment of BLOCKs (S2 cells) with physic al domains in Sexton et al. ( 2012 ) (embryonic nuclei c el ls). B. A c omp arison of Chr omHMM, BLOCKs and physic al domains at a lo cus on chromosome 2L (8Mb-12Mb). BLOCK b oundaries are shown as vertic al gr ay lines. 15 than 2 fold but were not b elo w 10 were categorized as “up-regulated”; those with fold change less than 0.5 but the expression levels w ere not b elo w 10 as “down-regulated”; and others as “no-change”. T o examine whether each BLOCK is enriched for genes with sp ecific expression change patterns, w e used the prop ortion of blo c ks that the most dominant pattern accoun ted for 50% or more of total num b er of genes within that blo c k as the test statistic. W e observed the p ercen tage of BLOCKs where the most dominan t pattern accoun ted for more than 50% of the genes was 61.6% and 60.8% for L1 larv ae and 10-12h embry o, resp ectiv ely , with 46.8% of the BLOCKs sho wing the same pattern b et w een the tw o comparisons. These observed statistics reach statistical significance b y comparing with randomly p erm utated blocks. F or ph ysical domains in Sexton et al. ( 2012 ), we observ ed 68% and 65.8% with dominan t co-regulation patterns for L1 larv ae and 10-12h embry o, resp ec- tiv ely . Second, we ask ed whether genes within each BLOCK tended to hav e sim- ilar biological functions. W e tested for enric hment of Gene Ontology (GO) categories within each BLOCK by using hypergeometric test with Bonfer- roni correction. 52.5% (351 out of 669 BLOCKs with more than 2 genes) w ere enriched for at least one GO category using a 0.05 cutoff and 1061 GO categories in total are enriched (T able S2). The observed num b ers of GO enriched BLOCKs and enriched GO categories were b oth significantly higher than those from p erm utated blo c ks. W e further asked which biologi- cal processes or functions inv olve genes that are significantly linearly juxta- p osed. W e found 90% (108/119) of chromatin assem bly or disassem bly genes (GO:0006333) for Dr osophila w ere juxtap osed within a BLOCK lo cated on chr2L: 21329-215856kb, with a striking p-v alue of 3 . 95 × 10 − 234 . Genes in chitin-based cuticle developmen t (GO:0040003), structural constituent of p eritrophic mem brane (GO:0016490), b o dy morphogenesis(GO:0010171), proteinaceous extracellular matrix (GO:0005578) w ere found significantly clustered with o ver 70% genes in one BLOCK share the same function. Third, we reasoned if BLOCKs reflected co ordinated regulation of genes with relev ant biological functions, we w ould exp ect that BLOCKs enriched in dev elopmen tally sp ecific GO categories would display large deviation in transcription across differen t dev elopmental stages, while BLOCKs en- ric hed in “house-keeping” GO categories w ould display limited fluctuations. W e ranked the BLOCKs based on their standard deviation of transcription across 9 different dev elopmental stages (T able S3 and S4). BLOCKs with the top 20% largest deviations and 20% smallest deviations were chec ked for their GO enric hment resp ectiv ely , and then were listed in T ables S2 and S3 in the order of statistical significance. Notably , in BLOCKs dis- 16 M. CHEN ET AL. pla ying most striking c hanges in dev elopmen tal transcriptomes, we found GO categories associated with conspicuous dev elopmental-specific biological pro cesses or functions, sp ecification of segmen tal identit y , eg. heart dev el- opmen t, structural constituen t of chitin-based cuticle, positive regulation of m uscle organ developmen t, and midgut developmen t, among others. More- o v er, metab olism-related functions, suc h as serine-t yp e endopeptidase activ- it y , p eptidyl-dip eptidase activity etc, display turno ver across developmen tal transcriptomes and are among the top of our list. GO categories asso ci- ated with “house-keeping” functions, like transferase activity , aminoacylase activit y , chromatin assem bly , insulin receptor binding show ed limited fluc- tuations through dev elopment. This result pro vides further evidence on the role of BLOCKs in co ordinated regulation. 4.4. Comp arison with Chr omHMM. In this subsection, we compare the results from our metho d with those from a p opular HMM based metho d, ChromHMM. W e applied ChromHMM to the same dataset (18 histone mod- ification, 1kb bins, S2 cell). The data were binarized to fit ChromHMM’s requiremen t of input. More specifically , all interv als with intensities greater than 0 are set to 1 and remaining are set to 0. T o obtain blo c ks at coarse lev els, we explored ChromHMM mo dels by v arying the pre-sp ecified num- b er of hidden states (from 3 to 18). W e observ ed that a smaller n umber of hidden states tended to pro duce blo c ks with larger sizes. Here we re- p ort ChromHMM mo dels with the num b er of hidden states from 3 to 5. The ChromHMM mo del with 3 hidden states generates 12517 segments, the mo del with 4 hidden states generates 9157 segmen ts, and the mo del with 5 hidden states generates 12444 segments. F or each ChromHMM mo del, the sizes of segments range from 2kb (5% quan tile) to 26kb (95% quantile) and a median of 5kb. The distributions of sizes of segments from ChromHMM mo dels and BLOCKs are visualized in Figure 5 . Therefore, we think that, compared to BLOCKs, the HMM mo dels are not able to characterize the more global histone mo dification patterns. Therefore, we think that, com- pared to BLOCKs, the Hidden Marko v mo dels are not able to characterize the more global histone mo dification patterns. 4.5. How r obust is the r esult?. The BCP mo del used in this pap er as- sumes that differen t histone marks are indep enden t. Ho wev er, some histone marks, such as H3K4me3 and H3K4me2, are highly correlated with eac h other. Moreo v er, it is kno wn that there exists redundancy and exclusivity b et ween the active and repressiv e marks. T o further explore how the input histone marks will affect the result, w e p erformed the c hange p oin t analysis with the input of 4 marks, 7 marks and 10 marks, respectively . The marks for 17 ● ● ● ● ● ● ● ● ● ● ● ● ● ● ● ● ● ● ● ● ● ● ● ● ● ● ● ● ● ● ● ● ● ● ● ● ● ● ● ● ● ● ● ● ● ● ● ● ● ● ● ● ● ● ● ● ● ● ● ● ● ● ● ● ● ● ● ● ● ● ● ● ● ● ● ● ● ● ● ● ● ● ● ● ● ● ● ● ● ● ● ● ● ● ● ● ● ● ● ● ● ● ● ● ● ● ● ● ● ● ● ●● ● ● ● ● ● ● ● ● ● ● ● ● ● ● ● ● ● ● ● ● ● ● ● ● ● ● ● ● ● ● ● ● ● ● ●● ● ● ● ● ● ● ● ● ● ● ● ● ● ● ● ● ● ● ● ● ● ●● ● ● ● ● ● ● ● ● ● ● ● ● ● ● ● ● ● ● ● ● ● ● ● ● ● ● ● ● ● ● ● ● ● ● ● ● ● ● ● ● ● ● ●● ● ● ● ● ● ● ● ● ● ● ● ● ● ● ● ● ● ● ● ● ● ● ● ● ● ● ● ● ● ● ● ● ● ● ● ● ● ● ● ● ● ● ● ● ● ● ● ● ● ● ● ● ● ● ● ● ● ● ● ● ● ● ● ● ● ● ● ● ● ● ● ● ● ● ● ● ● ● ● ● ● ● ● ● ● ● ● ● ● ● ● ● ● ● ● ● ● ● ● ● ● ● ● ● ● ● ● ● ● ● ● ● ● ● ●● ● ● ● ● ● ● ● ● ● ● ● ● ● ● ● ● ● ● ● ● ● ● ● ● ● ●● ● ● ●● ● ● ● ●● ● ● ● ● ● ● ● ● ● ● ● ● ● ● ● ● ● ● ● ●● ● ● ● ● ● ● ● ● ● ● ● ● ● ●● ● ● ● ● ● ● ● ● ● ● ● ● ● ● ● ● ● ● ● ● ● ● ● ● ● ● ● ● ● ● ● ● ● ● ● ● ● ● ● ● ● ● ● ● ● ● ● ● ● ● ● ● ● ● ● ● ● ● ● ●● ● ● ● ● ● ● ● ● ● ● ● ● ● ● ● ● ● ● ● ● ● ● ● ● ●● ● ● ● ● ● ● ● ● ● ● ● ● ● ●● ● ● ● ● ● ● ● ●● ● ● ● ● ● ● ● ● ● ● ● ● ● ● ● ● ● ● ● ● ● ●● ● ● ● ●● ● ● ● ● ● ● ● ● ● ● ● ● ● ● ● ● ● ● ● ● ● ● ● ● ● ● ● ● ● ● ● ● ● ●● ● ● ● ● ● ● ● ● ● ● ● ● ● ● ● ● ● ● ● ● ● ● ● ● ● ● ● ● ● ● ● ● ● ● ● ● ● ● ● ● ● ● ● ● ● ● ● ● ● ● ● ● ● ● ● ● ● ● ● ● ● ● ● ● ● ●● ● ● ●● ● ● ● ● ● ● ● ● ● ● ● ● ●● ● ● ● ● ● ● ● ● ● ● ● ● ● ● ● ● ● ● ● ● ● ● ● ● ● ● ● ● ● ● ● ● ● ● ● ● ● ● ●● ● ● ● ● ● ● ● ● ● ● ● ● ● ● ● ● ● ● ● ● ● ● ● ● ● ● ● ● ● ● ● ● ● ● ● ● ● ● ● ● ● ● ● ● ● ● ● ● ● ● ● ● ● ● ● ● ● ● ● ● ● ● ● ● ● ● ● ● ● ● ● ● ●● ● ● ●● ● ● ● ● ● ● ● ● ● ● ● ● ● ● ● ● ● ● ● ● ● ● ● ● ● ● ● ● ● ● ●● ● ● ● ● ● ● ● ● ● ● ● ● ● ● ● ● ● ● ● ● ● ● ● ● ● ● ● ● ● ●● ● ● ● ● ● ● ● ● ● ● ● ● ● ● ● ● ● ● ● ● ● ● ● ● ● ● ● ● ● ● ● ● ● ● ● ● ● ● ● ● ● ● ● ● ● ● ● ●●● ● ● ● ● ● ● ● ● ● ● ● ● ● ● ● ● ● ● ●● ● ● ● ● ● ● ● ● ● ● ● ● ● ● ● ● ● ●● ● ● ● ● ● ● ● ● ● ● ● ● ● ● ● ● ● ● ● ● ● ● ● ● ● ● ● ● ● ● ● ● ● ● ● ● ● ● ● ● ● ● ● ● ● ● ● ● ● ● ●● ● ● ● ● ● ● ● ● ● ● ● ● ● ● ● ● ● ● ● ● ● ● ● ● ● ● ● ● ● ● ● ● ● ● ● ● ● ● ● ● ● ● ● ● ● ● ● ● ● ● ● ● ● ● ● ● ● ● ● ● ● ● ● ● ● ● ● ● ● ● ● ● ● ● ● ● ● ● ● ● ● ● ● ● ● ● ● ● ● ● ● ●● ● ● ● ● ● ● ● ● ● ● ● ● ● ● ● ● ● ● ● ● ● ● ● ● ● ● ● ● ● ● ● ● ● ● ● ● ● ● ●● ● ● ● ● ● ● ● ● ● ● ● ● ● ●● ● ● ● ● ● ● ● ● ● ● ● ● ● ● ● ● ● ● ● ● ● ● ● ● ● ● ● ● ● ● ● ● ● ● ● ● ● ● ● ● ● ● ● ● ● ● ● ● ● ● ●● ● ● ● ● ● ● ● ● ● ● ● ● ● ● ● ● ●● ● ● ● ● ● ● ● ● ● ● ● ● ● ● ● ● ● ● ● ● ● ● ● ● ● ● ● ●● ● ● ● ● ● ● ● ● ● ● ● ● ● ● ● ● ● ● ● ● ● ● ● ● ● ● ● ● ● ● ● ● ● ● ● ● ● ● ● ● ● ● ● ● ● ● ● ● ● ● ● ● ● ● ● ● ● ●● ● ● ● ● ● ● ● ● ● ● ● ● ● ● ● ● ● ● ● ● ● ● ● ● ● ● ● ● ● ● ● ● ● ● ● ● ● ● ● ● ● ● ● ● ● ● ● ● ● ● ● ● ● ● ● ● ● ● ● ● ● ●● ● ● ● ● ● ● ● ● ● ● ● ● ●● ● ● ● ● ● ● ● ● ● ● ● ● ● ● ● ● ● ● ● ● ● ● ● ● ● ● ● ● ● ● ● ● ● ● ● ● ● ● ● ● ● ● ● ● ● ● ● ● ● ● ● ● ● ● ● ● ● ● ● ● ● ● ● ● ● ● ● ● ● ● ● ● ● ● ● ● ● ● ● ● ● ● ● ● ● ● ● ● ● ● ●● ● ● ● ● ● ● ● ● ● ● ●● ● ● ● ● ● ● ● ● ● ● ● ● ● ● ● ●● ● ● ● ● ● ● ● ● ● ● ● ● ● ● ● ● ● ● ● ● ● ● ● ● ● ● ● ● ● ● ● ● ● ● ● ● ● ● ● ● ● ● ● ● ● ●● ● ● ● ● ● ● ● ● ● ● ● ● ● ● ● ● ● ● ● ● ● ● ● ● ● ● ● ● ● ● ● ● ● ● ● ● ● ● ● ● ● ● ● ● ● ● ● ● ● ● ● ● ● ● ● ● ● ● ● ● ● ● ● ● ● ● ● ● ● ● ● ● ● ● ● ● ● ●● ● ● ● ● ● ● ● ● ● ● ● ● ● ● ● ● ● ● ● ● ● ● ● ● ● ● ● ● ● ● ● ● ● ●● ● ● ● ● ● ● ● ● ● ● ● ● ● ● ● ● ● ● ● ● ● ● ● ● ● ● ● ● ● ● ● ● ● ● ● ● ● ● ● ● ● ● ● ● ● ● ● ● ● ● ● ● ● ● ● ● ● ● ● ●● ● ● ● ● ● ● ● ● ● ● ● ● ● ● ● ● ● ● ● ● ● ● ● ● ● ● ● ● ● ● ● ● ● ●● ● ● ● ● ● ● ● ● ● ● ● ● ● ● ● ● ● ● ● ● ● ● ● ● ● ● ● ● ●● ● ● ● ● ● ● ● ● ● ● ● ● ● ● ● ● ● ● ● ●● ● ● ●● ● ● ● ● ● ● ● ● ● ● ● ● ●● ● ● ● ● ● ● ● ● ● ● ● ● ● ● ● ● ● ● ● ● ● ● ● ● ● ● ● ● ● ● ● ● ● ● ● ● ● ● ● ● ● ● ● ● ● ● ● ● ● ● ● ● ● ● ● ● ● ● ● ● ● ● ● ● ● ● ● ● ● ● ● ● ● ● ● ● ● ● ● ● ● ● ● ● ● ● ● ● ● ● ● ● ● ● ● ● ● ● ● ● ● ● ● ● ● ● ● ● ● ● ● ● ● ● ● ● ● ●● ● ● ● ● ● ● ●● ● ● ● ● ● ● ● ● ●● ● ● ● ● ● ● ● ● ● ● ● ● ● ● ● ● ● ● ● ● ● ● ● ● ● ● ● ● ● ● ● ● ● ● ● ● ● ● ● ● ● ●● ● ● ● ● ● ● ● ● ● ● ● ● ● ● ● ● ● ● ● ● ● ● ●● ● ● ● ● ● ● ● ● ● ● ● ● ● ● ● ● ● ● ● ● ● ● ● ● ● ● ● ● ● ● ● ● ●● ● ● ● ● ● ● ● ● ● ● ● ● ● ● ● ● ● ● ● ● ● ● ● ● ● ● ● ● ● ● ● ● ● ● ● ● ● ● ● ● ● ● ● ● ● ● ● ●● ● ● ● ●● ● ● ● ●● ● ● ● ● ● ● ● ● ● ● ● ● ● ● ● ● ● ●● ● ●● ● ● ● ● ● ● ● ●● ● ● ● ● ● ● ● ● ● ● ● ● ● ● ● ● ● ● ● ● ● ● ● ● ● ● ● ● ● ● ● ● ● ● ● ● ● ● ●● ● ● ● ● ● ●● ● ● ● ● ● ● ● ● ● ● ● ● ● ● ● ● ● ● ● ● ● ● ●● ● ● ● ● ● ● ● ● ● ● ● ● ● ● ● ● ● ● ● ● ● ● ●● ● ● ● ● ● ● ● ● ● ● ● ● ● ● ●● ● ● ● ● ● ● ● ● ● ● ● ● ● ● ● ● ● ● ● ● ● ● ● ● ● ● ● ● ● ● ● ● ●● ● ● ● ● ● ● ● ● ● ● ● ● ● ● ● ● ● ● ● ● ● ● ● ● ● ● ● ● ● ● ● ● ● ● ● ● ● ● ● ● ● ● ● ● ● ● ● ● ● ● ● ● ● ● ● ● ● ● ● ●● ● ● ● ● ● ● ● ● ● ● ● ● ● ● ● ● ● ● ● ● ● ● ● ● ● ● ● ● ● ● ● ● ● ● ● ● ● ● ● ● ● ● ● ● ● ● ● ● ● ● ● ● ● ● ● ● ● ● ● ● ● ● ● ● ● ● ●● ● ● ● ● ● ● ● ● ● ● ● ● ● ● ● ● ● ● ● ● ● ● ● ● ● ● ● ● ● ● ● ● ● ● ● ● ● ● ● ● ● ● ● ● ● ● ● ● ● ● ● ● ● ● ● ● ● ● ● ● ● ● ● ● ● ● ● ● ● ● ● ● ● ● ● ● ● ● ● ●● ● ● ● ● ● ● ● ● ● ● ● ● ● ● ● ● ● ● ● ● ● ● ● ● ● ● ● ● ● ● ● ● ● ● ● ●● ● ● ● ● ● ● ● ● ● ● ● ● ● ● ● ●● ● ● ● ● ● ● ● ● ● ● ● ● ● ● ● ● ● ● ● ● ● ● ● ● ● ● ● ● ● ● ● ● ● ● ● ● ● ● ● ● ● ● ● ● ● ● ● ●● ● ● ● ● ● ● ● ● ● ● ● ● ● ● ● ● ● ● ● ● ● ● ● ● ● ● ● ● ● ● ● ●● ● ● ● ● ● ● ● ● ● ● ● ● ● ● ● ● ● ● ● ● ● ● ● ● ● ● ● ● ● ● ● ● ● ● ● ● ● ● ● ● ●● ● ● ● ●● ● ● ● ● ● ● ● ● ● ● ● ● ● ● ● ● ● ● ● ● ● ● ● ● ● ● ● ● ● ● ● ●● ● ● ● ● ● ● ● ● ● ● ● ● ● ● ● ● ● ● ● ● ● ● ● ● ● ● ● ● ● ●● ● ● ● ● ● ● ● ● ● ● ● ● ● ● ● ● ● ● ● ● ● ● ● ● ● ● ● ● ●● ● ● ● ● ● ● ● ● ● ● ● ● ● ● ● ● ●● ● ● ● ● ● ● ● ● ● ● ● ● ● ● ●● ● ● ● ● ● ● ● ● ● ● ● ● ● ● ● ● ● ● ● ● ● ● ● ● ● ● ● ● ●● ● ● ● ● ● ● ● ● ● ● ● ● ● ● ●● ● ● ● ●● ● ● ● ● ● ● ● ● ● ● ● ● ● ● ● ● ● ● ● ● ● ● ● ● ● ● ● ● ● ● ● ● ● ● ● ● ● ● ● ● ● ● ● ● ● ● ● ● ● ● ● ● ● ● ● ● ● ● ● ● ● ● ● ● ● ● ● ● ● ● ● ● ● ● ● ● ● ● ● ● ● ● ● ● ● ● ● ● ● ● ● ● ● ● ● ● ● ● ● ● ●● ● ● ● ● ● ● ● ● ● ● ● ● ● ● ● ● ● ● ● ● ● ● ● ● ● ● ●● ● ● ● ● ● ● ● ●● ● ● ● ● ● ● ● ● ● ● ● ●● ● ● ● ● ● ● ● ● ● ● ● ● ● ● ● ● ● ● ● ● ● ● ● ● ● ● ● ● ● ● ● ● ● ● ● ● ● ● ● ● ● ● ●● ● ● ●● ● ● ● ● ● ● ● ● ● ● ● ● ● ● ● ● ● ● ● ●● ● ● ● ● ● ● ● ● ● ● ● ● ● ● ● ● ● ● ● ● ● ● ● ● ● ● ● ● ● ● ● ● ● ● ● ● ● ● ● ● ● ● ● ● ● ● ● ● ● ● ● ● ● ● ● ● ● ● ●● ● ● ● ● ● ● ● ● ● ● ● ● ● ● ● ● ● ● ● ● ● ● ● ● ●● ● ● ● ● ● ● ● ● ● ● ● ● ● ● ● ● ● ● ● ● ● ● ● ● ● ● ● ● ● ● ● ● ● ● ● ● ● ● ● ● ● ● ● ● ● ● ● ● ● ● ● ● ● ● ● ● ● ● ● ● ● ● ● ● ● ● ● ● ● ● ● ● ● ● ● ● ● ● ● ● ● ● ● ● ● ● ● BLOCKs (PP = 0.25) BLOCKs (PP = 0.75) ChromHMM (3 − state) ChromHMM (4 − state) ChromHMM (5 − state) Sexton et al 0 250 500 750 Length (kb) Method Fig 5 . Boxplot for the sizes of se gments identifie d using differ ent metho ds: physic al do- mains in embryonic nuclei identifie d using High-C data ( Sexton et al. 2012 ), Chr omHMM with 5, 4 and 3 hidden states and BLOCKs with p osterior prob ability gre ater than 0.75 and 0.25. eac h mo del were selected based on their correlation across the en tire genome. As shown in Figure 6 A, there are mainly 7 groups of marks based on their correlation patterns: the first group consists of H3K9me2 and H3K9me2; the second group is featured by H3K36me3 and H3K79me1; the third group consists of H4K5ac, H3K18ac, H4K8ac, H3K27ac, H4Ac, H3K36me1 and H3K4me1; the fourth group is featured by H3K79me2, H3K9ac, H3K4me3 and H3K4me2; where as three separate groups are formed b y H4K16ac, H3K23ac and H3K27me3, resp ectiv ely . F or the 7 marks mo del, w e selected one mark from each of the 7 groups with the input marks as H3K18ac, H3K23ac, H3K27Me3, H3K36me3, H3K4Me3, H3K9me2, and H4K16ac. F or the 10 marks mo del, we further in tro duced H4, H3K79Me2, and H3K9ac in to the 7 marks mo del. F or the 4 marks mo del, w e excluded H3K18ac, H3K36me3, and H4K16ac from the 7 marks mo del. The 4 marks, 7 marks and 10 marks mo dels identified 419, 579 and 532 blo c ks, resp ectively . W e observ ed high consistency b et ween these results and rep orted BLOCKs ob- tained with 18 marks, for example, 80% of b oundaries from the 10 marks mo del are within 20kb of BLOCK b oundaries and 77% of b oundaries from the 7 marks mo del are within 20kb of BLOCK b oundaries (see Figure 6 B for other comparisons). T o in vestigate how the p osterior probability cutoff w ould affect the char- 18 M. CHEN ET AL. ● ● ● ● ● ● ● ● ● ● ● ● ● ● ● ● ● ● ● ● ● ● ● ● ● ● ● ● ● ● ● ● ● ● ● ● ● ● ● ● ● ● ● ● ● ● ● ● ● ● ● ● ● ● ● ● ● ● ● ● ● ● ● ● ● ● ● ● ● ● ● ● ● ● ● ● ● ● ● ● ● ● ● ● ● ● ● ● ● ● ● ● ● ● ● ● ● ● ● ● ● ● ● ● ● ● ● ● ● ● ● ● ● ● ● ● ● ● ● ● ● ● ● ● ● ● ● ● ● ● ● ● ● ● ● ● ● ● ● ● ● ● ● ● ● ● ● ● ● ● ● ● ● ● ● ● ● ● ● ● ● ● ● ● ● ● ● ● ● ● ● ● ● ● ● ● ● ● ● ● ● ● ● ● ● ● ● ● ● ● ● ● ● ● ● ● ● ● ● ● ● ● ● ● ● ● ● ● ● ● ● ● ● ● ● ● ● ● ● ● ● ● ● ● ● ● ● ● ● ● ● ● ● ● ● ● ● ● ● ● ● ● ● ● ● ● ● ● ● ● ● ● ● ● ● ● ● ● ● ● ● ● ● ● ● ● ● ● ● ● ● ● ● ● ● ● ● ● ● ● ● ● ● ● ● ● ● ● ● ● ● ● ● ● ● ● ● ● ● ● ● ● ● ● ● ● − 1 − 0.9 − 0.8 − 0.7 − 0.6 − 0.5 − 0.4 − 0.3 − 0.2 − 0.1 0 0.1 0.2 0.3 0.4 0.5 0.6 0.7 0.8 0.9 1 H3K9me2 H3K9me3 H3K36me3 H3K79me1 H4K5ac H3K18ac H4K8ac H3K27ac H4Ac H3K36me1 H3K4me1 H3K79me2 H3K9ac H3K4me3 H3K4me2 H4K16ac H3K23ac H3K27me3 H3K9me2 H3K9me3 H3K36me3 H3K79me1 H4K5ac H3K18ac H4K8ac H3K27ac H4Ac H3K36me1 H3K4me1 H3K79me2 H3K9ac H3K4me3 H3K4me2 H4K16ac H3K23ac H3K27me3 A 18 marks 10 marks 7 marks 4 marks 18 marks 10 marks 7 marks 4 marks 419/728 311/532 322/579 277/419 80% 77% 48% 69% 48% 55% Number of PD/BLOCKs B Fig 6 . A. Genome-wide c orr elation plot for 18 histone marks in S2 c el ls. The marks ar e or der e d b ase d on the r esult of hier ar chic al clustering. B. Comp arison of mo dels with differ- ent input histone marks. Each of the off-diagonal element is the p er c entage of b oundaries (within 20kb) shar e d by any pair of the mo dels. The diagonal element is the numb er of b oundaries shar e d with physic al b oundaries in Sexton et al. ( 2012 ) (short as PD) / the numb er of se gments dete cte d for e ach mo del. acterization of BLOCKs, we v aried the threshold and chec ked the distri- bution of the sizes. The results were rather stable under different cut-off v alues. When the cut-off v alue was set as lo w as 0.25, 40 new b oundaries w ere added, leading to a total of 769 blo c ks. Although newly introduced b oundaries w ere all almost within 10kb distance of ph ysical domains, this n um b er is still less than the n umber of ph ysical domains iden tified in Sexton et al. ( 2012 ). 5. Discussion. 5.1. Metho dolo gic al c omp arisons. Our BCP mo del w as developed with a differen t purp ose compared to existing metho ds for analyzing combinatorial histone mo difications. F or example, ChromaSig ( Hon, Ren and W ang 2008 ) w as designed to uncov er p oten tial regulatory elements through searc hing for genome-wide frequently o ccurring chromatin signatures. Spatial clustering ( Jasc hek and T ana y 2009 ) iden tified no vel patterns of lo cal co-o ccurrence among histone mo difications by imp osing a spatial K-clustering solution on HMM. Segwa y ( Hoffman et al. 2012 ) based on Dynamic Bay esian Netw orks, ac hiev ed a breakthrough in precision and resolution in finding known ele- men ts and handling of missing data compared to HMM-based approaches. 19 The most recent metho d of this kind, ChA T ( W ang, Luny ak and Jordan 2012 ), extends the capabilities of chromatin signatures c haracterization through an inherent statistical criterion for classification. All these metho ds tried to detect c hromatin signatures asso ciated with a v ariet y of small functional ele- men ts. T o the b est of our kno wledge, our mo del is the first effort to examine histone marks at coarse scales although no explicit constraint has b een put on blo c k size. By separately mo deling zero and non-zero signals, our mo del is able to capture the lo cal enric hment patterns of v astly differen t sizes im- plicitly , sup erior than the existing ad ho c merging strategy ( W ang, Luny ak and Jordan 2012 ). BCP differs substantially from several previously describ ed studies to sub- divide the genome at “domain-lev el”. de Wit et al. ( 2008 ) rep orted a study to iden tify nested c hromatin domain structure through a statistical test of each c hromatin comp onen t. Their chromatin domains are sp ecific for each com- p onen t or factor whereas our approac h captures domain with combinatorial pattern of multiple factors. Thurman et al. ( 2007 ) used a simple tw o-state HMM to segmen t the ENCODE regions in to active and repressed domains based on m ultiple tracks of functional genomic data, including activ ating and repressiv e histone mo difications, RNA output, and DNA replication timing. By using w av elet smo othing, their metho d fo cuses on a single scale at a time ( Lian et al. 2008 ). In contrast, our analysis fo cuses on histone mo difi- cations only and simultaneously captures enrichmen t patterns ov er different scales. BCP is most similar to a four-state CPM mo del proposed to charac- terize chr omatin accessibility based on tiled microarray DNaseI sensitivity data only ( Lian et al. 2008 ). Both metho ds formulate the segmentation of genome in to a c hange p oin t detection problem. How ever, these t w o meth- o ds differ in several resp ects. First, CPM is still a hidden-state mo del with transition probabilities imp osed on segmen ts other than equal-sized bins in HMM, whereas BCP is hidden-state free with emphasis on lo cal patterns. Second, four-state CPM mo del was dev elop ed to interpret a single track DNaseI array data while our metho d was an examination based on multi- v ariate histone modification data. Third, CPM models the DNaseI signal as a con tinuous mixture of Gaussian at eac h state, whereas we models histone mo difications with a zero-inflated Gaussian mixture due to spatial sparsity of binding ev ents. 5.2. Summary and futur e dir e ctions. In this pap er, we hav e developed a no v el m ultiv ariate BCP mo del to partition genome into contiguous blo c ks based on histone mo difications. It could be extended to analyze chip-sequencing data or applied to other studies with partitioning zero-inflated multiple ob- 20 M. CHEN ET AL. serv ation tracks as a task. Our mo del presents a new approach to examin- ing com binatorial histone marks. Not only histone marks are signatures for functional elements ( Kharc henko et al. 2011 , Ernst and Kellis 2010 ), our results from the D. melano gaster S2 cell genome suggest that they are also roadmaps for c hromatin organization at coarse scales. It is worth while to further in vestigate whether BLOCKs and top ologi- cal domains are substantiv ely differen t, or if BLOCKs merely re-describ es top ological domains based on histone mo difications. Besides the difference in tro duced b y techniques, data qualit y and cell types, we b eliev e other tw o p ossible reasons for imp erfect alignment b et ween BLOCKs and physical do- mains are: 1) the partition is not saturated based on the curren t profile of histone mo difications; 2) the equal weigh t assigned to differen t histone mo difications in the partition limit the identification of finer domains (a dra wbac k of all current approac hes). It has become increasingly clear that functionally related genes are often lo cated next to one another in the linear genome ( Sproul, Gilb ert and Bic k- more 2005 ), resembl ing DNA op eron in bacteria ( Chen et al. 2012 , Keene 2007 ). This proximit y is essential for co ordinated gene regulation. Genome- wide expression analysis hav e iden tified man y clusters of co-expressed genes during Dr osophila developmen t ( Lee and Sonnhammer 2003 , Yi, Sze and Thon 2007 ), such as the hox gene clusters ( Dub oule 2007 ). One mec hanism for this co ordinated regulation is that these genes are organized into a chro- matin domain that acts as a regulatory unit b y the epigenetic mec hanism ( Kosak and Groudine 2004 , Sproul, Gilb ert and Bickmore 2005 ). Several suc h chromatin domains hav e already been characterized ( Kosak and Grou- dine 2004 , T olhuis et al. 2006 , Pic kersgill et al. 2006 , Orlando and Paro 1993 ). In this study , we illustrated the widespread existence of these c hro- matin domains as BLOCKs that were identified b y com binatorial histone marks. Last but not least, although we ha ve shown that a substantial p ortion of BLOCKs can p oten tially act as regulatory units, this is likely still an underestimate. Firstly , our BLOCKs were identified based on combinatorial patterns of all av ailable 18 histone marks from the S2 epigenome. W e do not kno w in totalit y how man y histone marks are sufficien t to saturate the seg- men tation. It is lik ely that more mark ers, including p oten tially undisco vered ones will be needed to get a complete view of epigenetic landscap e. Ov er 100 histone marks ha ve b een discov ered y et with a lot of exclusivity and cor- relation. F uture studies addressing relationships among histone marks will giv e us more insigh t in to this op en question. It is also imp ortan t to dev elop blo c k identification metho ds that can accommo date the dep endency struc- 21 ture among marks. Secondly , when ev aluating expression of genes within an individual BLOCK, we used dev elopmental transcriptome from Dr osophila tissues other than S2 cells, which only present a weigh ted av erage of v ary- ing BLOCKs across differen t cell types within each developmen tal stage. In realit y , each type of cells is likely to hav e its distinct pattern of BLOCKs. Thirdly , plasticity in chromosomal modifications has b een sho wn in several rep orts ( Riddle et al. 2011 , Eaton et al. 2011 , mo dENCODE Consortium 2010 ). Thus w e would exp ect BLOCKs are dynamic structures and the p er- cen tage of BLOCKs with tendency of co-regulation might b e even higher if taking into account this plasticity . This conjecture could b e tested when more histone marks data across developmen t stages are a v ailable. F ourthly , with incomplete and inaccurate knowledge on gene functions in GO database (as well as others) ( Khatri, Sirota and Butte 2012 ), likely man y BLOCKs with functional relev ance ma y not stand out just b ecause supporting infor- mation do esn’t exist yet. Finally , co ordinated regulation is a complex pro cess accomplished by miRNA, transcript factors and other regulatory elements with feedback effect on chromatin organization. F urther analysis on binding sites of regulatory elements and their in terpla y with genes within BLOCKs will shed more lights on understanding the underlying mec hanism. Ac kno wledgemen ts. W e thank the review ers for their constructiv e commen ts and Chao Gao for discussion. SUPPLEMENT AR Y MA TERIAL Supplemen tary Figures and T ables ( h ttp://www.meng jiec hen.com/publication.html ). Figure S1. Num b er of enric hed regions of 46 histone marks and non-histone c hromosomal proteins from mo dENCODE pro ject. T able S1. BLOCKs identified by BCP in S2 cells using p osterior probability cutoff 0.75. T able S2. Gene lists in GO enric hed BLOCKs in S2 cell. T able S3. BLOCKs with the top 20% largest deviations in the transcription across 9 differen t developmen tal stages. T able S4. BLOCKs with the top 20% smallest deviations in the transcrip- tion across 9 different developmen tal stages. References. [1] Allis, D. (2007). Epigenetics . CSHL Press. [2] Barr y, D. and Har tigan, J. A. (1992). Pro duct Partition Models for Change P oint Problems. The Annals of Statistics 20 260–279. 22 M. CHEN ET AL. [3] Barr y, D. and Har tigan, J. A. (1993). A Bay esian Analysis for Change Poin t Problems. Journal of the Americ an Statistic al Asso ciation 88 309–319. [4] Chen, D. , Zheng, W. , Lin, A. , Uyhazi, K. , Zhao, H. and Lin, H. (2012). Pumilio 1 Suppresses Multiple Activ ators of p53 to Safeguard Spermatogenesis. Curr ent Biolo gy 22 420-425. [5] de Wit, E. , Braunschweig, U. , Greil, F. , Bussemaker, H. J. and v an Steensel, B. (2008). Global Chromatin Domain Organization of the Drosophila Genome. PL oS Genetics 4 e1000045. [6] Duboule, D. (2007). The rise and fall of Hox gene clusters. Development 134 2549- 2560. [7] Ea ton, M. L. , Prinz, J. A. , MacAlpine, H. K. , Trety akov, G. , Kharchenk o, P. V. et al. (2011). Chromatin signatures of the Drosophila repli- cation program. Genome R es. 21 164–174. [8] Erdman, C. and Emerson, J. W. (2008). A fast Ba y esian c hange p oin t analysis for the segmentation of microarray data. Bioinformatics 24 2143–2148. [9] Ernst, J. and Kellis, M. (2010). Disco very and characterization of chromatin states for systematic annotation of the human genome. Natur e Biote chnolo gy 28 817–826. [10] Filion, G. J. , v an Bemmel, J. G. , Braunschweig, U. , T alhout, W. , Kind, J. et al. (2010). Systematic protein lo cation mapping rev eals five principal chromatin t yp es in Drosophila cells. Cel l 143 212–224. [11] Hoffman, M. M. , Buske, O. J. , W ang, J. , Weng, Z. , Bilmes, J. A. et al. (2012). Unsup ervised pattern disco very in human chromatin structure through genomic seg- men tation. Natur e Metho ds 9 473–476. [12] Hon, G. , Ren, B. and W ang, W. (2008). ChromaSig: A Probabilistic Approach to Finding Common Chromatin Signatures in the Human Genome. PL oS Computational Biolo gy 4(10) e1000201. [13] Jaschek, R. and T ana y, A. (2009). Spatial Clustering of Multiv ariate Genomic and Epigenomic Information. R ese ar ch in Computational Mole cular Biolo gy 5541 170-183. [14] Keene, J. D. (2007). RNA regulons: co ordination of p ost-transcriptional even ts. Natur e R eviews Genetics 8 533-543. [15] Kharchenk o, P. V. , Alekseyenko, A. A. , Schw ar tz, Y. B. , Minoda, A. , Rid- dle, N. C. et al. (2011). Comprehensive analysis of the chromatin landscap e in Drosophila melanogaster. Nature 471 480–485. [16] Kha tri, P. , Sirot a, M. and Butte, A. J. (2012). T en years of pathw ay analy- sis: current approaches and outstanding challenges. PL oS c omputational biolo gy 8 e1002375. [17] K osak, S. T. and Groudine, M. (2004). Gene order and dynamic domains. Science 306 644-647. [18] Lee, J. M. and Sonnhammer, E. L. L. (2003). Genomic gene clustering analysis of path wa ys in euk aryotes. Genome Res 13 875-882. [19] Lian, H. , Thompson, W. A. , Thurman, R. , St ama toy annopoulos, J. A. , No- ble, W. S. et al. (2008). Automated mapping of large-scale chromatin structure in ENCODE. Bioinformatics 24(17) 1911-1916. [20] modENCODE Consor tium, T. (2010). Identific ation of functional elements and regulatory circuits by Drosophila mo dENCODE. Scienc e. 330 1787. [21] Orlando, V. and P aro, R. (1993). Mapping Polycom b-repressed domains in the bithorax complex using in vivo formaldehyde cross-link ed c hromatin. Cel l 75 1187- 1198. [22] Pickersgill, H. , Kal verd a, B. , de Wit, E. , T alhout, W. , Forner od, M. and 23 v an Steensel, B. (2006). Characterization of the Drosophila melanogaster genome at the nuclear lamina. Nature genetics 38 1005–1014. [23] Riddle, N. C. , Minoda, A. , Kharchenko, P. V. , Alekseyenko, A. A. , Schw ar tz, Y. B. et al. (2011). Plasticit y in patterns of histone modifications and c hromosomal proteins in Drosophila hetero c hromatin. Genome R es. 21 147–163. [24] Sexton, T. , Y affe, E. , Kenigsberg, E. , Bantignies, F. , Leblanc, B. , Hoich- man, M. et al. (2012). Three-Dimensional F olding and F unctional Organization Prin- ciples of the Drosophila Genome. Cel l 148 1-15. [25] Sproul, D. , Gilber t, N. and Bickmore, W. A. (2005). The role of chromatin structure in regulating the expression of clustered genes. Nat R ev Genet 6 775-781. [26] Thurman, R. E. , D a y, N. , Noble, W. S. and St ama toy annopoulos, J. A. (2007). Iden tification of higher-order functional domains in the human ENCODE regions. Genome R ese ar ch 17 917-927. [27] Tolhuis, B. , Muijrers, I. , de Wit, E. , Teunissen, H. , T alhout, W. , v an Steensel, B. and v an Lohuizen, M. (2006). Genome- wide profiling of PRC1 and PR C2 Polycom b chromatin binding in Drosophila melanogaster. Nat Genet 38 694- 699. [28] W ang, J. , Luny ak, V. V. and Jord an, I. K. (2012). Chromatin signature discov ery via histone mo dification profile alignmen ts. Nucleic A cids R esear ch . [29] Yi, G. , Sze, S.-H. and Thon, M. R. (2007). Iden tifying clusters of functionally related genes in genomes. Bioinformatics 23 1053-1060. Program of Comput a tional Biology and Bioinforma tics Y ale University New Ha ven, CT 06520 E-mail: meng jie.c hen@yale.edu Y ale Stem Cell Center Y ale School of Medicine New Ha ven, CT 06520 E-mail: haifan.lin@yale.edu Dep ar tment of Biost a tistics Y ale School of Public Heal th New Ha ven, CT 06520 E-mail: hongyu.zhao@yale.edu
Original Paper
Loading high-quality paper...
Comments & Academic Discussion
Loading comments...
Leave a Comment