Identification of structural features in chemicals associated with cancer drug response: A systematic data-driven analysis
Motivation: Analysis of relationships of drug structure to biological response is key to understanding off-target and unexpected drug effects, and for developing hypotheses on how to tailor drug thera-pies. New methods are required for integrated ana…
Authors: Suleiman A Khan, Seppo Virtanen, Olli P Kallioniemi
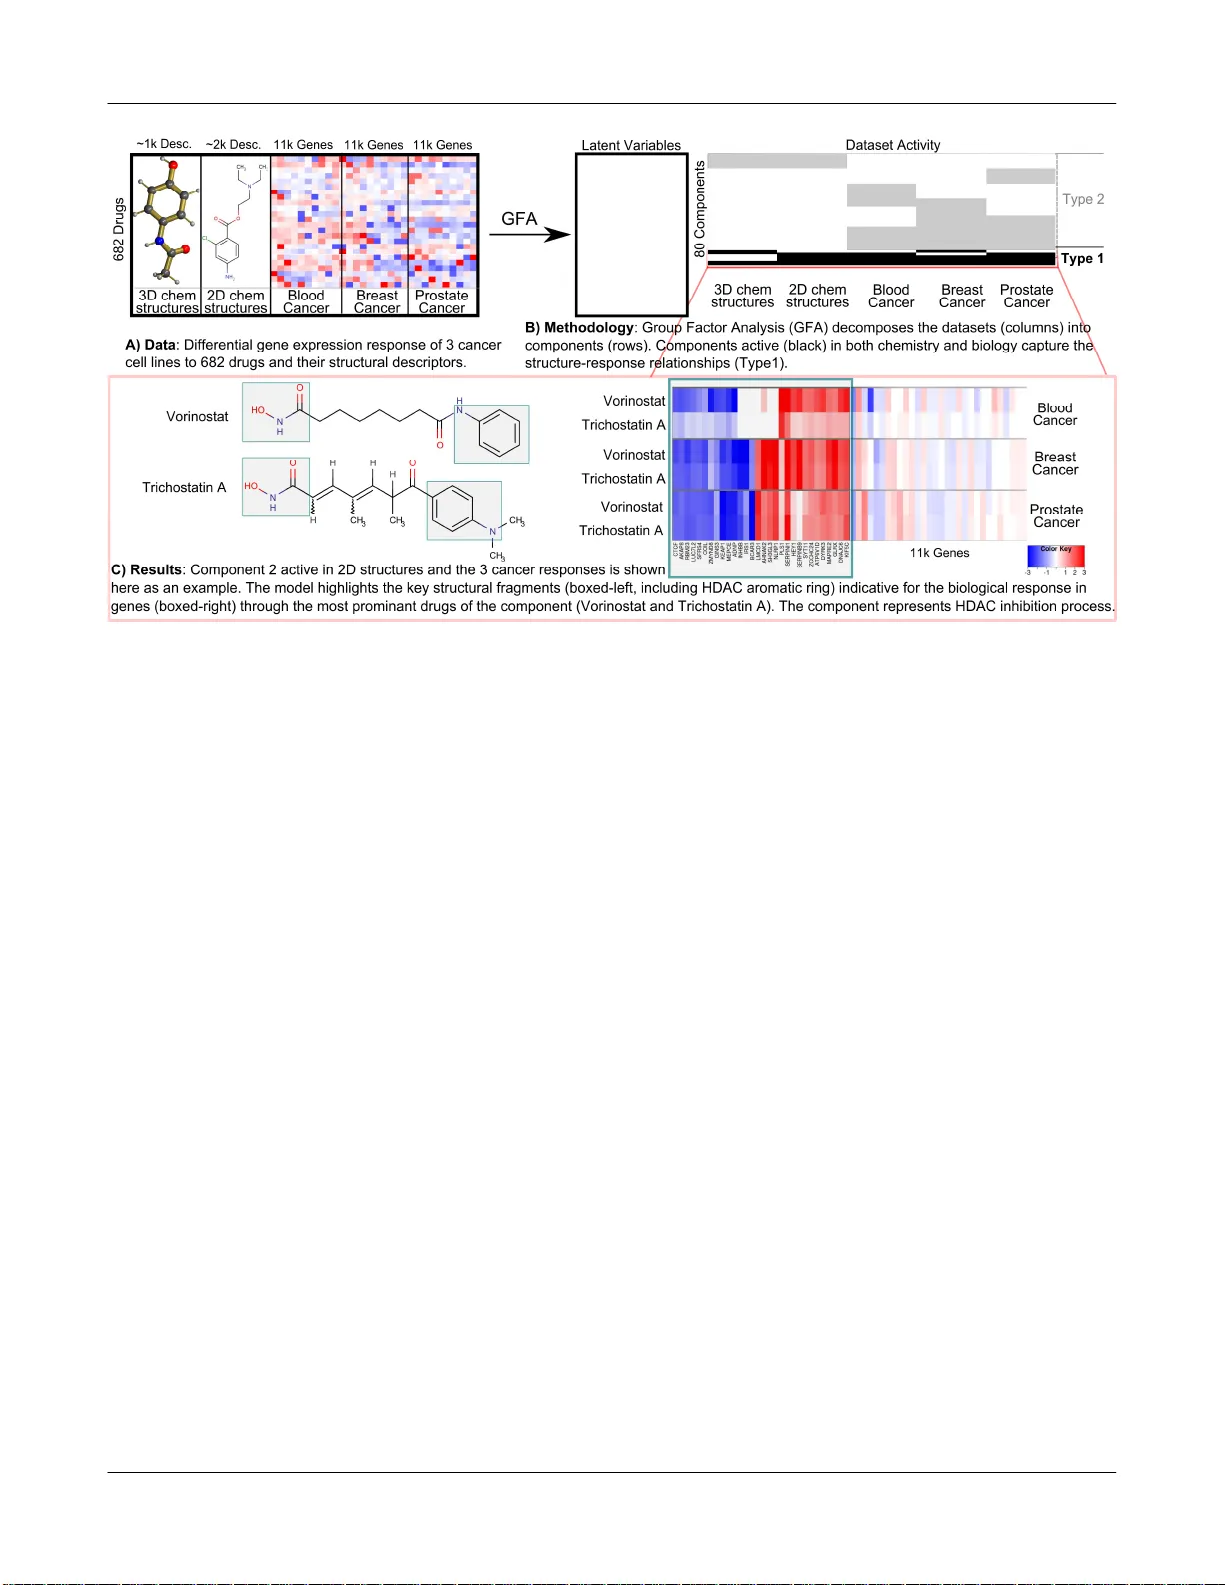
1 Identifica tion of struc tural feat ures in che micals ass ociated w ith cancer dr ug res ponse: A syste matic data-dri ven anal ysis Suleiman A Khan 1, * , Seppo Virtanen 1 , Olli P Kallion iemi 2 , Krister Wenner berg 2 , Antti Po so 2,3 and Samuel K aski 1,4, * 1 Helsinki Institute for Information Technology HIIT, Department of Information and Computer S cience, Aalto Uni versity, 00076 Espoo , Finland. 2 Instit ute for Molecular Medici ne Finland FIMM, University of Helsinki, 00014 Helsinki, Finland . 3 School of Phar macy, Fac ulty of Health Sciences, Uni versity of Eastern Finla nd, 702 11 Kuop io, Finland. 4 He lsinki Instit ute for Infor mation Technolo gy HIIT , Depa rtment of Computer Science, U niversit y of Helsink i, 000 14 Helsinki, Finla nd. A BSTR ACT Motivation: Analysis of relationships of drug st ructure t o biological response is key to understanding off-target and unexpected drug effects, and for developing hypotheses on how to t ailor drug thera - pies. New methods are required for integrated analy ses of a l arge number of chemical features o f drugs against the c orresponding genome-wide responses of multiple cell models. Results : I n this paper, we present t he f irst comprehensive multi-set analysis on how the chemical structure of drugs i mpacts on ge- nome-wide gene expression across several cancer c ell lines (CMap database). The task is f ormulated as s earching for drug response components across m ultiple cancers to reveal shared effec ts of drugs and the c hemical features that may be responsible. The com- ponents c an be c omputed with an extension of a very recent ap- proach called Group Fact or Analysis (GFA). W e i dentify 11 compo- nents that link t he structural descriptors of drugs with s pecific gene expression responses observed in the three cell lines, and identify structural groups that may be responsible f or the responses. Our method quantitatively outperforms the limited earlier studies on CMap and identifies both the previously reported ass ociations and several interesting novel findings, by taking into account multiple cell lines and advanced 3D struct ural descriptors. The novel observa- tions include: previously unknown s imilarities i n the effects induced by 15-delta prostaglandin J2 and HSP 90 inhibitors, which are linked to the 3D descriptors of the drugs; and the induction by simvastatin of leukemia-specific anti-inflam matory response, resembling th e effects of corticosteroids. Contact: suleiman.khan@aa lto.fi , samuel.kaski@aalto .fi 1 INTRO DUCTIO N Modeling and u nderstanding the diverse spectrum o f cellular re- sponses to d rugs is one of th e biggest chall enges in chemical sys- tems biolo gy. So me o f the respon ses can be predicted for targeted drugs, which have been d esigned to bind t o a specific pro tein th at triggers t he bio logical respo nse. The bind ing of a drug to a target largely dep ends on the structural correspondence of the drug mole- cule an d the binding cavit y of t he target molecule which can b e modeled in prin ciple, given ample computational resour ces. Off- target effects are harder to predict. They are depend ent on the cell types, ind ividual genetic ch aracteristics and cellular states making the spectrum of respo nses o verwhelmingly di verse. The less well known the drug’s mechanism of action and the characteristics o f * T o whom correspondence should be addressed. the d isease, the h arder the prediction from first princip les becomes. The most feasible way t o approach this challenge in an unbi ased way, which d oes no t require p rior knowledge of all on- and o ff- target int eractions of drugs, is to collect systematic measure ments across di fferent dru gs, cell types, and d iseases, and search for re- sponse pattern s correlating with the characteristics of the d rugs. The patterns fou nd can be used as evidence for hypotheses o n un- derlying action mechanisms, or di rectly in pred icting the respons- es. The Con nectivity M ap (CMap; Lamb et a l. , 2006) describ ed the basis for a d ata-driven stud y of drug-effect relation ships at a ge- nome-wide level. CMap hosts the largest collection of high- dimensional gene expression pr ofiles derived fro m tre atment of three diff erent human cancer cell lines w ith over one thou sand drugs. The CMap data have b een used in a multitude of stud ies revealing new biological links between drugs and between d rugs and d iseases. Genome-wide gen e expression res ponses f rom the CMap h ave b een used to discover clusters o f drugs having similar mechanisms of action, resulting in n ovel findings, such as effects of h eat sh ock p rotein (HSP ) inhibitors and identi fication of modu - lators of auto phagy ( Iorio et al., 2010). The CMap data have also been successfully u sed in large s cale i ntegrative stud ies includ ing the an alysis of re gulation of d rug targets (Is kar et a l. , 2010), hERG annotations to predict novel inhibitors (Babcock et al. , 2013) and drugs’ interactions with protein networks (Laenen et al . , 2013). Quantitative structure activity relationship analysis (QSAR; Cramer et al. , 1988 ) is a widel y adopted approach to studying dru g responses. Tradition ally, univariate biological activities are pre- dicted using a r ange o f m ethods, including classical regression, Support Vector Machines, and Random Forests. The key challeng e when moving from tradi tional QSAR to s ystems wide anal ysis of chemical effects is h ow to relate structural features to geno me- wide cellular responses. Integration o f chemical stru ctures with genome- wide respon ses has become a major research direction in Chemical S ystems Bio logy (Iskar et a l. , 2012; Xie et al. , 2012). Keiser et a l. (2009) studied structural sim ilarities between ligand sets while Klabu nde et a l. (2005) used protein -ligand complexes to predict off-targets. To infer po tential indications for drugs, Gottlieb et al. (2 011) com- bined similarities from ch emical structures, gene expression pro - files, pro tein targets and several ot her datasets. Atias et al. (2011) modeled linkage b etween structural descriptors o f d rugs and t heir side effects using Cano nical Correlation Analysis (CCA; Hotelling, 1936). St ructures have also been u sed with genomic datasets to predict toxicity and complex adverse drug reactio ns (Russom et Khan et al. 2 al., 2 013). Recently, M enden et al. (2013 ) combined structur es of drugs and mutation information o f cell lines to p redict drug cyto- toxicity in a series of cell lines. Relationships between structural descriptors of drugs and their gene expression pro files have also been st udied. Cheng et al. (2010) examined similarities between chemical structures and molecular targets of 37 drugs that were clu stered based o n th eir bioactivity p rofiles. Low et al. (2011) classified 1 27 rat liver sam- ples to toxic vs n on-toxic responses, based on com bined drug- induced expression p rofiles and chemical descriptors, and identi- fied che mical substr uctures an d genes that were respo nsible f or liver toxicit y. In a bro ader settin g, when th e goal is to find d epend- encies between t wo data sources (chemical stru ctures and genomic responses), correlation-type approaches m atch the goal directly, and h ave t he addit ional advantage that a pre-defined classification is not required. Khan et al. (20 12) generalized structure-response analysis to multivariate correlatio ns with Cano nical Co rrelation Analysis (CC A) o n the CM ap. Du e to th e limitation s of classical CCA, th eir st udy was restricted to a limited set o f des criptors (76) and genomic su mmaries (13 21 genesets), and did not attempt to take into account the d ata from three separate cell lines. In this p aper we present the first probabilisti c approach to the p rob- lem of integrated analysis of effects of chemical structures across genome-wide respo nses in multiple model s ystems. We extend the earlier work in three major ways: (i) Instead o f using only two d ata sources (as in classical CCA), we used th e recent Bayesian Group Factor Analysis method (GFA; V irtanen et al. , 2012) that general- izes the anal ysis to multiple sources, here th ree cell lines and two sets of chemical descriptors. (ii) Our Ba yesian treatment with fea- ture-level priors enabled u s to cope better with the uncertainties in the high-dimensional data. (iii) We included a more infor mative set of 3 D ch emical descriptors to comple ment the widely used 2 D fingerprints which are recognized to only explain limited aspects of drugs (Schn eider, 2010). Our goal was t o u ncover the bi g pictu re of relationship s between chemical stru cture parame ters and genome -wide res ponses, in a data-driven fashion (Fig. 1). The data came from CMap, 1 1,327 gene-wide responses in three cell lines (HL60-Blood Cancer/Leukemia, MCF 7-Breast Cancer and PC3 -Prostate Cancer; Lamb et a l. , 2006) , and from t wo sets of chemical descrip tors: 780 3D P entacle d escriptors o f d rugs (Duran et al., 2008 ) and 2,769 functionally relevant stru ctural fragments (FCFP 4; Glen et al. , 2006) as 2D fingerprints of th e drugs. These five datasets consist of samples from th e 682 drug treatments, co upled b y th e detailed drug ident ity . We anal yzed th e st atistical relation ships between the datasets by decomposin g them into a set of interpr etable components. Our method quantitatively o utperformed previous studies, thereby validating the ap proach. We rediscovered findin gs reported earlier as well as id entified n ovel drug associations and detailed structure-respo nse relationships. 2 MET HODS 2.1 Gene Express ion Dat asets We used the Conn ectivity Map (Lamb et al . , 2006) gene expression data as a measu re of th e biological response of the three cancer cell lines t o dru g treatments, forming the gene expression datasets. The Connectivity M ap hosts over 7100 gene expression profiles including technical replicat es treated with 1309 drugs and is the largest available resource of its k ind. Responses from a subset of these drugs (68 2) were measured on all of the three cell lines, namely HL60 (Leukemia), MCF7 (Breast Cancer) and PC3 (Prostate Cancer cell line). We obtained the raw gene expression profiles from the C onnectivity Map and u sed th e data from t he most abundant microarray p latform (HT-HG- U133A). The data were preprocessed using RMA (Irizarry et al ., 2003) and drug - treatment vs. control (log2) differential expression was calculated Fig. 1. Overview of the symmetric multi-structure t o multi-response decomposition . A) The five datasets sp anning 682 paired drugs are B ) decomposed into components by GF A. C omponents of T ype 1 represent shared patterns in both chemistry and biology while T ype 2 describes biology -only or ch emistry-o nly variation (not as useful in our case ). C) Each shared compo nent identifies ke y structures and genes of a n underlying biological process. Data-driven genome-wide structure-re sponse links 3 batch-wise (Khan et a l. , 2012). Technical replicates were merged b y taking the mean of each gene. This resulted in gene expression profiles for the 68 2 drugs having measurements over all three cell lin es. To reduce noise we approximated the approach of Ior io e t al. (2010) for our setting, b y retain- ing the expression of top 2000 u p and down regulated genes for each sam- ple, while co nsidering the rest to be noise (se t to zero). These pro files formed th ree b iological response datasets (one for each cell line), each being a differential gene expression matrix of 682 drugs times 11,327 genes. 2.2 Chemical Descri ptor Dataset s The chemical spac e of d rugs was represented u sing two different t ypes of chemical descriptors, name ly the 2D f ingerprints ‘FCFP4’ and 3D de - scriptors ‘Pentacle’ . The FCFP4 (Functional Connectivity Fingerprints of radius 4 ; Gle n et al. , 2006) are circular topological fingerprints designed specifically for structure-activity modeling and similarity searching. They are rapid ly computable an d heavily used in a wide variet y of applications (Rogers and Hahn, 2010). Each dimension of the fin gerprints represe nts a certain 2-dimensional fragment of the compounds, interpretable as presence of certain substructures, typically stereochemical information, and allow s easy visua l insp ection of structures. Th erefo re, FCFP4 c an be used to id en- tify the core 2D substructure s that make compounds structurall y similar and are responsible for biolog ical activity. The more complex 3-dimensional descriptors Pentacle (Duran et al. , 2008) capture the functional properties of the compounds using molecular interac- tion fields. They are ab le to group together compounds with very di ssimilar chemical structures and yet ha ving the same type of molecular field proper- ties. This i s especially important in our stud y where the aim is t o find small molecule s th at share biological functions d espite structural dissimilarity. Most of the traditional fingerprints, like MACCS and FCFP4, are superior to recognize 2 D structural si milarity but unfortunately unable to recognize structurally un related and ye t biologica lly similar compounds binding into the sa me binding pocket. The opposite is true with most (if not all) field- based similarity methods like Pentacle, which find more effective distant similarities; therefo re we decided to combine both approaches. In th e earli- er work, Khan et al. (2012) had used VolSurf descriptors to represent mo- lecular properties. While VolSurf is an op timal method for physicochemi- cal p roperties esti mation it is not able to describe pha rmacophore features extensively , un like the Pentacle descriptors, and thus is not an option in our study. Pentacle field distance descriptors were compu ted using Pentacle v 1.0.4 ( http://www.mo ldiscovery.com/soft_pentacle.ph p ), b y Molecular Discov- ery. The descript ors were calculated for a ll the available 1 0 probe sets, namely D², O², N², T², DO, DN, DT, ON, OT, NT, where D is Dry Probe to represent hydrophobic interactions, O is carbonyl oxygen probe to repre- sent H-bond donor feature of the molecules and N flat probe of Ni trogen is the H-bond ac ceptor while T is TIP probe representing shape of t he mo le- cule, in terms of steric hot spots. For each p robe set 7 8 descriptors were obtained, representing the interaction potentials of probes at different d is- tances, resulting in 7 80 d escriptors in tot al. Higher interaction p otential values indicate stronger interaction of compounds w ith Pentacle probes. This results i n a 682 x 7 80 d ata matrix, with each row being a dru g and the 780 columns represe nting the Pentacle descriptors. This fo rms the first chemical dataset in our stu dy. The 2D func tional connectivity fi ngerprints (FCFP4) represent the chemi- cals as structural fragments. In FCFP, the fragments are not predefined, rather computed dy namically and thus can represe nt variation in nove l structures. The FCFP4 fingerprints w ere computed using Pi peline Pilot Student Edition software ( http://accelrys.com/products/pipel ine-pilot/ ), by Accelrys. A total of 2 ,769 unique structural fragments are found and the fingerprints are represe nted as a matrix of 682 compounds x 2 ,769 frag- ment descriptors. This forms t he second chemical dataset in our study. 2.3 Model: Group Fact or Analysis (GF A) We search for relationships b etween chemical d escriptors and biological responses, as clues to the key und erlying biological processes. Group Fac- tor Analysis (GFA) is a model d esigned to capture such relationships (sta- tistical dependencies) by explaining a c ollection of da tasets (“views”) b y a set o f factors or components, w hich fo rm a c ombined low-dimensional representation (Virtanen et al. , 2012). In the multi-view setting, each com- ponent is active in a subset of th e datasets, and i s a simplified model of an underlying process visible in th ose sets. The task solved by GFA is to sepa- rate t he sh ared components that capture the structure-biology relationships from th e r est of the data: the former a re visible i n all or a subset of t he datasets, whereas components active in a si ngle view describe variation specific to that particular vie w or noise. Given a collection of M datasets ( ) 1 1 N D X R × ∈ … ( ) M m N D X R × ∈ , con sist- ing of N co-oc curring samples ( ) m n x , GFA finds a set of latent c omponents (with upper limi t K, see below). Each d ataset i s assum ed to ha ve b een generated as a linear c ombinati on of la tent componen ts N K Z R × ∈ , with weights of th e combina tion given by a load ings m atrix ( ) m m D K W R × ∈ : Assumin g normal di stribution s for simp licity, the m odel is: ( ) ( ) ( ) ( ) ~ , , m m m n n N Σ x W z z n ~ N 0, I ( ) , (1) where n z is the n th row of Z , an d ( ) m Σ is a diagonal n oise covarianc e matrix. GFA is special in that th e projections W are required to be group -wise sparse, i.e. , all th e eleme nts ( ) :, m k W are set to zero for t he components k that are n ot active in the m th data set. The compon ents with n on-ze ro p rojections between two or more views capture dependencies between the views. To increase the interpretability of the model we extend GFA by in troducing element-wise sparsity in addition t o the g roup-sparsity for the p rojection matrices, matching the biological prior assumpti on that each process typi- cally activates only a subset of genes. We in troduce element-wise Automat- ic Relevance Determina tion (ARD; Neal, 1996) pri or for the projection weight matrices, pu shing irrelevant weight values ( ) , m d k W towards zero and making each c omponent eleme nt-wise sparse. For th e g roup sparsity we apply the group spike and slab prior (Klami et al. , 2013) where the bin ary variable ( ) m k H controls the activity of th e k th component in the group m . The prior is ( ) ( ) ( ) ( ) ( ) ( ) 1 , , 0 ~ 0, ( ) 1 , m m m m d k k d k k N α δ − + − W H H ( ) ( ) ~ , m k k Bernoulli π H ( ) ~ , , k Beta a b π π π ( ) ( ) , ~ , . m d k Gamma a b α α α (2) If ( ) m k H becomes zero, all va lues in ( ) :, m k W will be set to zero. To complete the model d escription, we set an uninformati ve prior to the diagonal ele - ments of the p recision matrix ( ) 1 ( ) m − Σ . We represent ou r (M=5 ) datasets as matrices of d rugs vs. features. The rows r epresent th e sa mples (drugs) and the columns are th e features (genes or c hemical descriptors). Dru gs are paired in all th e views, i.e. , a row i n all matrices correspond to the same drug. A tot al of N = 682 d rugs were us ed in th e study. The featu res of the c hemical descriptors, Pentacle (m=1) and FCFP4 (m=2 ) are D 1 = 780 Pentacle p robe fields and D 2 = 2 ,769 fragment structures, respectively. The b iologica l re sponses of the three cell lines (m=3,4,5) are represented b y d ifferential expression of D m = 11 ,327 genes each. The hyperparameters of t he gamma distribution were set t o values 3 ( 1e ) − corresponding t o an uninformative symmetri c prior, while t he hy- perparameters of th e spike and slab were set to , 1 a b π π = . All remaining model pa rameters are l earned from the data usi ng Gib bs sampling. The number of comp onents is optimally learn ed from da ta b y initializing K to be large enough, such that s parsity assumption s push some to be inactive. Here for compu tational reason s we set K=80, a value si gnificantly larger than the actual number of shared components, and let th e noise model represent the rest of t he data. For samplin g, we ran 1 0 c hains and selected Khan et al. 4 for further analysis the one having its likelihood closest to the mean of non- outlier chains. The first 5000 samples were d iscarded as the b urn-in, and the chain was run for 1000 more iterations, with a thinning factor of 5. The mean value of the samples was u sed as a representation of the model. As a sanity check, we verified that our shared components had over 70% simi- larity with the second (non- used) chain. For interpretation we represent each component by listing the h igh-valued latent scores z an d p rojection values W. For the latent scores we p erformed a permutation test to detect the most significantly (q-value < 0.05) activated drugs, while for the projections we inspected the top 3 0 elements. 3 RESULT S Fig. 2 gives an o verview of the t ypes o f compon ents d iscovered b y the model. For studying stru cture-activity relatio nships, the most important are the c omponents s hared by on e o r more chemical view and one or more of th e cancer su btypes. The co mponents active in o nly th e expression datasets r epresent drug responses not captured by th e u sed chemical descripto rs, and components only active in the ch emical datasets represent b iologically irrelevan t structural variance. Additionall y, co mponents active in only a sin- gle dataset may represent dataset-specific noise. We found a total of 11 sh ared components which will be d iscussed belo w. The d e- tailed structu re-response relationship s d iscovered from all t he shared compon ents are visualized in Supp lementary F igure S1 and tabulated in a usable format in S upplementary Table S2. 3.1 Validatio n via Che mical Biolog y Onto logy We st arted by quan titatively e valuatin g h ow closely related the drugs in th e shared components are in terms of kno wn ch emical biology r elationsh ips, and compared our d ata with t hose of two previous studies that investigated drug actions using t he CMap database (Iorio et a l. , 2010; Khan et al. , 2012). The establ ished chemical biology relationships were ob tained from the ont ology, Che mical En tities of Biolo gical Interest (ChEBI; Degtyarenko et al . , 2008), which is the largest such onto logy of small co mpounds. Ch EBI links compou nds with respect to Che mi- cal structu re, Bio logical roles they are kno wn t o p lay, and their Applications. Examples o f classifications are antibi otic, coenzyme and agonist ( biological); do nor, ligand, inhibito r (ch emical), and pesticide, anti-asthmatic (ap plication s). ChEBI was d ownloaded as a graph contain ing p aths b etween 328 of ou r co mpounds via 611 ontology terms ( http:// www .ebi.ac.u k/chebi/ ). The average similarit y (inverse p ath distance) of d rugs within th e shared GFA co mponents was co nsisten tly h igher than the corre- sponding similarities of Kh an et a l. , (2012), Iorio et a l. , (2010) and random sets of co mpounds (Fi g. 3 ). The largest path l ength (16) in ChEBI linked all drugs, while th e smallest (2 ) lin ked o nly the most similar. Interestin gly, th e differen ce in GFA and o thers on small path len gths was h igher than that on larger ones, in dicating th at drugs closely connected i n ChEBI were even better found by GFA. 3.2 Component Interpretat ions We n ext analyzed the shared componen ts in detail. Each compo- nent conn ects a set o f structural drug p roperties and gene expres- sion changes, forming a h ypothesis of a structure activity relation- ship. A compon ent can be characterized by the set of d rugs th at activate it the most, and by the set of genes that are expressed dif - ferentially when the compon ent is active. We first co mpared the findi ngs to th e two oth er studies th at have investigated drug actions using t he CMap database (Iorio et a l. , 2010; Khan et al. , 2012). Out o f t he 1 1 shared GFA components, the majority of th e drugs in 7 components were similar to the clus- ters foun d b y Iorio et al. (2010), w hile 3 components ca ptured structurally driven cell-specific responses th ey h ad missed. Com- pared to the oth er earlier study ( Khan et al., 2012), the majority o f the drugs in 6 ou t of the 11 GFA compon ents matched a corre- sponding structure-response su bcomponent o f Khan et a l., (2 012), again indicatin g conformance t o known resu lts. Our co mponents also revealed several novel drug actio ns d ue to cell-type speci ficity and advanced 3 D descrip tors that were missed b y bo th of these earlier studies, and are p resented below. Detailed interp retation of all the 11 shared componen ts is present- ed in Supp lementary Table S1 . The componen ts were numbered in the o rder of the amount of variation they captured ; the cell line specific compon ents iden tified by the model were sep arately or- dered with th e p refix SP . On e component (SP3) captured outlier response of a single d rug, and was omitted from further anal ysis. The majority o f the co mponents captured effects shared a mong al l the t hree cell lines, while five c omponents had respon ses which were eit her cell-line-specific (component s SP1, SP2, SP 4), domi- nant in a specif ic cell l ine (component 7), or revealed some cell- line-specificity indication s for an interestin g d rug (co mponent 1). The 2 D structural features were active in most co mponents, id enti- Fig. 2. Summary of th e GF A compon ents. The plot demonstrates a ctivity (black is active) of each component (y-axis) over th e 5 input datasets (x- axis). Each component is active in some or all of the datasets. Components shared (active) by b oth chemical d escriptor and expression datasets capture structure-re sponse relationships. Fig. 3 . Qu antitative V alidation of chemical biology si milarity of drugs in shared GF A Components. Drugs in the same GF A Component had a consistently higher mean average similarity (y-axis) in ChEBI th an either of the earlier stud ies, and random sets of compounds, over th e entire range of Ch EBI pat h lengths (x-axis). Error bars represent one standard deviation over 1000 randomly generated sets. Data-driven genome-wide structure-re sponse links 5 fying si milarities in structu rally analogo us d rugs. The pentacle descriptors captured similarities in five co mponents, four o f which indicated novel responses of drugs that have not b een reporte d before. We discuss t hese four novel components in detail below. One of these had cell -line-specific effects (SP 2), while the re main- ing cell-line-sp ecific compon ents (SP1 and SP4) are su mmarized in Table 1. Component 1 was characterized by c ardenoli des. The to p 7 drugs of the component , lanatoside C, digito xigenin, digoxin, digoxigen- in, ouabin, helveticoside and strop hantidin belonged to this class. The primary activity of the other drugs anisomycin, lycorine and cicloheximide is protein s ynthesis inhibition , and bisacodyl is used as a laxative th rough sti mulation of secretion in the colo n. Cardenolides act on Na + /K + pumps and are known for io n flux alterations. Interestingly, the other compounds of Com ponent 1 also appeared to affect membran e potassium ion flux. Bisacodyl and anisomycin activate K + flux, lycorine is kno wn to reduce membrane potent ial (indicative of potassium efflux) and , indicative of affecting K + , emetine needs to b e administered with p otassium to redu ce cardiotoxicity. Intere stingly, bisacod yl e xhibited the response in M CF7 and PC3 cells only, suggesting th at its target may be expressed selectively. On the structural side, the top 4 FCFP4 fragments collectively represented t he correct core 2D response triggering sub structure in all the 7 cardeno lides, as detailed in F ig. 4. The other two key drugs, b isacodyl and ani somycin, were different from cardiac gly- cosides i n terms of 2D stru ctures, but the P entacle d escriptors indi- cated potential field similarities on ON, OT and NT probes. These probes re ferred to existence of common structural pharmacoph oric features: h ydrogen-bonding and sh ape-related f eatures. The 3D descriptors may therefore ind icate that these drugs do in deed b ind the same ion chann els as the Cardenolides. Component 3 captu red protein synthesis inhibition. All drugs in the compon ent are known to inhibit p rotein synthesis b ut each in a different way. T he only exception, alexidine, is a derivative o f clorhexidine, which is used as an an tibacterial mouth wash. In ter- estingly, it has been described to have anti-cancer cell activity through an unkn own target ( Yip et al. , 2 006). The model i dentified pentacle probe fields of D2 , DO and DT ( shape and lipophilicity related p robes) that relate alexidin e’s pro tein synthesis inhi bition response with th e known protein synthesis inhibitors. Component 5 was HSP 90 inhibition response. The component contains the three very similar d rugs geldana mycin, tanesp imycin, alvespimycin, an d on th e 2D structure le vel very dissi milar 15- delta prostaglandin J2 (PGJ2) and puromycin. Geldanamycin and its two an alogs tan espimycin a nd alvespimycin are h eat sho ck protein (HSP) 90 inhibitors and the latter two have b een explo red in the clinic as ant i-cancer d rugs. PGJ2 has also been described as having anti-cancer activity through an unkn own mechanism, cau s- ing inh ibition of several cancer survival signals. Pu romycin is re- ported as an aminonucleoside antib iotic with a primar y function of terminating ribo somal protein translation. At th e respon se level, this compon ent appeared to b e strongly indu cing a heat sho ck re- sponse with ma ny HSP and related genes being u p-regulated (see Fig. 5, left). The expression prof ile very strongl y indicated tha t PGJ2 and puro mycin are also i nhibiting HSP90. Pub Chem drug- target data demonstrates th at HSP9 0 targets have been rep orted as active in geldanamycin and i ts derivatives, while u ntest- ed/unspecified for both pur omycin and prostaglandin. On the structural side, the 2D descript ors co nfirmed that pu romy- cin and prostaglandi n are dissimilar to the three geldan amycin analogs. However, th e Pent acle d escriptors clearly in dicated th at N2, DN and NT fields shared a ver y strong pattern across all the five drugs. The p atterns were o nly visible in features of s maller distances of th ese larg e m olecules, indicating that only a s mall region of these compound s (polar ato ms o f all co mpounds) created Table 1. Sha red components having cell-line-specific response. The com- ponents (rows) ar e summarized by th eir top drugs (column 1), biological response (column 2) and the str uctural proper ties (column 3). Drug Description Biological Interpretati on Structural P. SP1 Antimetabolite (8- Azaguanine) used for antineoplastic activity and aniso- mycin a protein syn- thesis inhibitor. 8- azaguanine has bee n used in leukemia (Colsky et al. , 1955). Protein synthesis inhibition i n HL60 and PC3 cell s only. It could be interesting to expl ore 8-azaguanine as an anti- Prostate Cancer drug. I n a recent study Wen et al. (2013) also indicate d 8-azaguanine for potential t her- apeutic efficacy in prostate cancer. 2D Ring struc- tures of 8- azaguanine SP4 Anti-Estrogen Drugs Response visible in MCF7 (e s- trogen receptor) cel l line only. Pentacle ON/ OT fields. Fig. 4. Structure identification in Component 1 . L eft : The top 4 FCFP4 Structural Fragments identified by th e model a s strongly relating to the response of the drugs ( right ). W hen combined, th ese fragments represe nt the core response trigge ring structure ster oid backb one (shaded grey) in all the cardenolides. Khan et al. 6 the activity, while th e rest o f the stru cture is ju st needed to main- tain th e shape. This fitted well with t he observation that the d rugs are overall structu rally very dissimilar. At the smaller d istances th e structure responsi ble for biological respon se was ch aracterized by N2: ligand s hydrogen bonding capacit y, DN: h ydrogen b onding and lipophol icity and NT: h ydrogen bondin g/shape based d e- scriptors. In geldanamycin and p rostaglandin this distance (see Fig. 5 w here N2 descriptor is plot ted) was connected t o p olar ring- atoms an d more p recisely co rresponding H-bondin g positi ons. These same po sitions, alth ough i n a different co nformational ar- rangement (but with almost identical distance) are cri tical in the binding o f geldanamycin to HSP9 0. Hence, while the expressio n data str ongly argues for PGJ2 inhibiting HSP 90 activity at so me level, the stru ctural information does su ggest that this effect could be through a direct b inding to HSP90 enzymes. Component SP2 is a co rticosteroid component, b ut additionally captured very similar responses by o ther steroids su ch as etynodiol as well as th e surprisingly different drugs si mvastatin and rep- aglinide. Corticosteroids are anti-inflammatory and typically used against immune responses. Concentrations in the micro molar range were t ypically used in the CMap d ata, which is ver y high, com- pared to the nanomolar af finities to th e corti costeroid receptor primary tar gets. The response in this componen t was largely domi- nant in HL60 cells (Fig. 6) an d li ghtly ob served in P C3 while none at all was observed in MCF7 , indicating that th e relevan t target o r signal may be selectivel y expressed in HL60. Both simvastatin (a cholesterol-lowering HM G-CoA inhibitor) and repaglinide (a dia- betes drug) are highly dissi milar at the 2D level when compared to the c orticosteriods, but both inte restingly h ave been reported t o have anti-inflammatory activities, likely due to targets other than the primary target(s). Once a gain, P entacle descriptors capture th e underlying similarities between these dru gs through NT and N2 fields suggesting t hat the c ommon gene e xpression patterns in- duced by th e di ffe rent dru gs (corticosteroi ds, simvastatin and rep- aglinide) affect the same targets, eith er primary or off-targets. 4 CONCLUSION S AND DISCU SSION We extended the dru g response analysis paradigm from stand ard QSAR, of relating dru g properties and univariate respon ses, to finding relationships between specific structu ral d escriptors of drugs with the genome-wide responses they elicit in multiple cell lines . The task was for malized as d iscovering dep endencies b e- tween multiple datasets, an d addressed using the state-of-the-art method Group Factor Analysis (GFA). T he approach iden tified structure-genomic respo nse relation ships as underlying co mpo- nents of t he data, and can be used as a tool for exploring such rela- tionships from large-scale measure ment datasets. We qu antitatively validated our structu re-response components over the establish ed chemical-biology relationsh ips of ChEBI and found them to be better than earlier stu dies (I orio et al., 2010; Khan et a l., 2012) that did no t account for separate cell li nes and advanced 3D chemical descripto rs. Moreover, several drug grou ps we identified were c onsistent with earlier studies w hile several revealed signi ficantly i nteresting novel findings earlier studies had missed, demonstrating that our approach is viable for explorative multi-set structu re-activity analysis. These novel findings were clearly attrib uted to separating cell line identities and advanced 3 D descriptors in ou r formulation. In a d ifferent setting, Yera et al ., (2011) found 3D sim ilarity to be m ore important for o ff-target identification and this was partial ly suppo rted by our study as well. However, since the used methods are not ident ical and since in our approach biolo gical profile (gene expression) was also activel y used, this question remains open. The discovered co mponents revealed in teresting new findi ngs of potential importance for revealing n ovel action mechanisms of drugs. The 2D fingerpri nts hi ghlighted important co re structural groups p rima rily respo nsible for activity of si milar drugs, su ch as the identification of the stero id backbone in cardiac gl ycosides and aromatic ring in HDAC i nhibi tors. The joint analysis of data fro m multiple cell lin es with advanced 3 D P entacle descripto rs allowed us to ident ify relationship s between dru gs that w ere no t kno wn earlier. If validated, th is suggests an approach that could signifi- cantly help in medicinal che mistry and d rug d esign. For example, Fig. 5 . Component 5 identified a novel HSP90 response of prostaglandin. Left : Gene expression response of the top 7 d rugs in the three cell lines (y-axis), over t he top genes (x-axis) of the component, d emonstrates HSP genes being strongly up-regulated by t he HSP90 inhibitors and by the strikingly very differe nt puromycin and p rostaglan din. Right : N2 descriptor in geldanamy cin and prostaglandin connected to several polar ri ng-atoms (red and blue). The Pentacle feature (N2 distan ce range) found by GF A as rel ated with HSP ge ne ex pression is represented with the yell ow line. Data-driven genome-wide structure-re sponse links 7 our data led to the i dentification o f a p reviously u nknown an d n ov- el sh ared mechanism o f 1 5-delta p rostaglandin J2 (PGJ2) and heat shock protein (HSP90) inhib itors. In terestingly, P GJ2 and related prostaglandin analogs have repeatedly been described in t he litera- ture for having anti-cancer activit ies, bu t their mechanism o f action has n ot been clarified before (Fion da et al. , 2007; Zimmer et al. , 2010; Hegde et al. , 2011 ). Furthermore, our analysis revealed that simvastatin, a cholesterol-lowerin g dru g, has a leukemia-specific anti-inflammatory respo nse very similar to a range of corticoster- oids. This app ears to be a significant finding in the light that lovas- tatin, a close stru ctural analog of si mvastatin, recently was sh own to selectively in hibit leu kemic stem cells t ogether with severa l anti-inflammatory steroids (Hartwell et a l., 2013). Such systematic explo rations raise t he p ossibility for targete d interventions and will b ecome a growing trend in the future as more large-scale d atasets like th e CMap will become a vailable. For drug designers it o pens up t he opportuni ty to tailo r drug molecules to match a desired gene expression fingerprin t. For medicinal chemists, it coul d help to increase understand ing of action mecha- nisms of existing drugs and revealing potential on-label and off- label application s, including precision medicine. ACKNOW LEDGEM ENTS We thank Pekka Tiikkainen for g enerating the FCFP4 descriptors. Funding : This work was supp orted by Academy of Fin land [140057] and Finnish Centre o f Excellence in Computatio nal In - ference Rese arch COIN [ 251170] ; the Jane and Aatos Erkko Foundation; and th e FICS graduate school. REFERENC ES Atias,N. and S haran,R. (2011) An Algorithmic Framewo rk for Predic ting S ide-Effects of Drugs. J ournal of Co mputational Biology, 18(3 ): 207-218. Babcock,J.J . et al. (2013) Integrated Ana lysis o f Drug-Induced Gene Expres sion Profiles Pred icts Novel hERG Inhibitors. PLoS ON E 8(7) : e69513. Cheng,T. et al. (201 0) I nvestigating the corre lations a mong t he chemica l struct ures, bioactivity pro files and molecular targets of sma ll molecules. Bioinfor matics 26(22): 2881-2 888. Colsky,J. et al. (1955) Res ponse of patients w ith le ukemia to 8-aza guanine. Blood 10: 482–492. Cramer,R.D. III et al. (198 8) Co mparative molecular field analysis (CoMFA), Effect of shape o n binding o f steroids to carr ier proteins. J Am Chem Soc 110: 18. Degtyarenko, K. et a l. (2008) C hEBI: a databas e and onto logy for c hemica l e ntities o f biological inte rest, Nucle ic Acids Res 36: 344–350. Duran,A. et al. (2008) Develop ment a nd validat ion of AM ANDA, a new a lgorithm for selecting highly relevant regions in molecular interaction fie lds. J Chem Inf Mode l 48(9): 1813-18 23. Fionda,C. et al. (200 7) I nhibitio n o f t rail gene express ion b y c yclope ntenonic prosta- glandin 15-deoxy-de lta12,14-pros taglandin J 2 in T lymphoc ytes. Mol P harmacol. 72(5): 1246-57 . Glen,R.C. et a l. (2006) Circular fingerprints: Flexible molecular de scriptors with applications from phys ical chemistry to ADME. IDr ugs 9(3): 199-2 04. Gottlieb,A. e t al. (201 1) PRED ICT: a method for inferr ing nove l drug ind ications w ith application to pe rsonalized medicine. Molecular S ystems Bio logy 7: 496. Hartwell, K.A., et al. (201 3) Niche -based s creening ide ntifies s mall-molec ule inhib i- tors of leuke mia stem cells. Nature C hemical Biology 9 (12): 840-8 48. Hegde,S. et al. (2011) ∆ 12-prostagland in J3, an omega-3 fatty ac id-derived m etabo- lite, select ively ablates leuke mia ste m cells in mice. 11 8(26): 690 9-19. Hotelling,H. (1936) Relatio ns betwee n two sets of variants. Bio metrika 28 : 321-327. Iorio,F. et al. (2010) D iscove ry o f drug mode o f actio n and dr ug rep ositioning fro m transcriptio nal responses. PNAS 107(3 3): 14621-14 626. Irizarry,R.A. et a l. (200 3) S ummaries of Affymetrix Ge neChip p robe level data. Nucleic Acids R es 31: 4. Iskar,M. et al (2010 ) Drug-I nduced Re gulation o f Target Express ion. PLoS Co mputa- tional Biology 6 : 9. Iskar,M. et al. (2012) Dr ug discover y in the age of syste ms biology: the r ise of co mpu- tational app roac hes for da ta integratio n. Current Opinion in Biotechnolo gy 23 (4): 609–616. Keiser,M.J. et a l. (200 9) Pred icting new molec ular tar gets for known drugs. N ature 462: 175–191. Khan,S.A. et al. (20 12) C o mprehensive data-drive n a nalysis o f t he impact o f chemoinfor matic structure on the genome-wide biological response profiles of cancer ce lls to 1159 drugs. BMC Bio informatics 13: 11 2. Klabunde,T. and E vers,A. (2005) GPCR antitarget modeling: p harmacophore models for b iogenic amine binding GPCR s to avo id GPCR- mediated s ide e ffects. Che m- BioChe m 6: 876 –889. Klami,A. et al. (2013 ) Bayesian canonic al corre lation analys is. Journal of Machine Learning Resea rch, 14 : 965–1003 Laenen,G. et al. (2013) Find ing t he tar gets of a drug by integration of gene expressio n data with a prote in interact ion network. Mol BioS yst 9: 1676-16 85. Lamb,J. et al. (2006) The Con nectivity Map : Us ing Gene-E xpression Signatures to Connect S mall Molecules, Genes, a nd Diseas e. Science 313(5795 ): 1929-1935. Low,Y. et a l. (2011) Predicting drug- induced hepatoto xicity using QSAR and toxi- cogenomics a pproaches. Chemical Rese arch in T oxicology 24 : 1251–1262. Menden,M.P. et al. (2013) Machine Learning P rediction o f Ca ncer Ce ll Sens itivity to Drugs Based on Geno mic and Che mical Propert ies. Plos One 8(4 ): e61318. Neal,R.M. (1996) Bayes ian Learning for Neural Net works. Spr inger-Ver lag Rogers,D. and Ha hn,M. (2010) Exte nded-Connect ivity Fingerpr ints. J C hem I nf Model 50(5): 74 2-754. Russom,C. L. et a l. (2013 ) P redicting mod es of toxic action from c hemica l struct ure. Environmenta l Toxico logy and Che mistry 32(7): 1441–14 42 Schneider,G. (2010) Virtua l scre ening: a n endless staircase ? Nat Rev Drug Discov 9: 273–276. Virtanen,S. et a l. (2012) Bayes ian Gro up Factor Analysis. AIS TATS, J MLR W&C P 22: 1269-1277. Wen,D.Y. et al. (201 3) A co mputat ional bio informatics analysis o f gene expression identifies ca ndidate age nt for prostate ca ncer. Andro logia. doi:10.11 11/and.1212 7. Xie,L. et a l. (2012) No vel Co mputatio nal Approac hes to Po lypharmaco logy as a Means to De fine Respo nses to I ndividual D rugs. Annua l Review o f Pharmaco logy and Toxicology 52: 361-379. Yera,E.R. e t al. (2011) Che mical Struc tural No velty: On-Tar gets a nd O ff-Targets, J. Med. C hem. 54(19): 6771–6785 . Yip,K,W. et a l. (20 06) Pote ntial use of a lexidine dihydrochloride as a n apop tosis- promoting a nticancer age nt. Mol Cancer Ther 5(9) : 2234-2240. Zimmer,M. et a l. (20 10) The co nnectivity map links iron regulator y prote in-1- mediated inhibitio n of hypo xia-inducibl e factor-2a tra nslation to t he ant i- inflammatory 15 -deoxy-de lta12,14-pros taglandin J2. Cancer R es. 70 (8): 3071-9. Fig. 6. SP2: Corticosteroids sh owing r esponse specific to HL 60 cells, while only minor regulation in PC3 a nd not at all in MCF 7.
Original Paper
Loading high-quality paper...
Comments & Academic Discussion
Loading comments...
Leave a Comment