Construction dune plate-forme integree pour la cartographie de lexposition des populations aux substances chimiques de lenvironnement
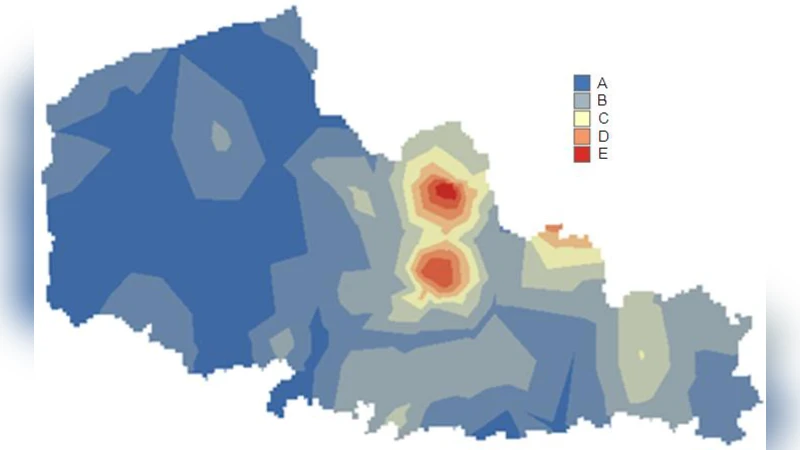
L’analyse du lien entre l’environnement et la sant'e est devenue une pr'eoccupation majeure de sant'e publique comme en t'emoigne l’'emergence des deux Plans nationaux sant'e environnement. Pour ce faire, les d'ecideurs sont confront'es au besoin de d'eveloppement d’outils n'ecessaires `a l’identification des zones g'eographiques dans lesquelles une surexposition potentielle `a des substances toxiques est observ'ee. L’objectif du projet Syst`eme d’information g'eographique (SIG), facteurs de risques environnementaux et d'ec`es par cancer (SIGFRIED 1) est de construire une plate-forme de mod'elisation permettant d’'evaluer, par une approche spatiale, l’exposition de la population fran\c{c}aise aux substances chimiques et d’en identifier ses d'eterminants. L’'evaluation des expositions est r'ealis'ee par le biais d’une mod'elisation multim'edia probabiliste. Les probl`emes 'epist'emologiques li'es `a l’absence de donn'ees sont palli'es par la mise en {\oe}uvre d’outils utilisant les techniques d’analyse spatiale. Un exemple est fourni sur la r'egion Nord-Pas-de-Calais et Picardie, pour le cadmium, le nickel et le plomb. Le calcul de l’exposition est r'ealis'e sur une dur'ee de 70 ans sur la base des donn'ees disponibles autour de l’ann'ee 2004 sur une maille de 1 km de c^ot'e. Par exemple pour le Nord-Pas-de-Calais, les indicateurs permettent de d'efinir deux zones pour le cadmium et trois zones pour le plomb. Celles-ci sont li'ees `a l’historique industriel de la r'egion : le bassin minier, les activit'es m'etallurgiques et l’agglom'eration lilloise. La contribution des diff'erentes voies d’exposition varie sensiblement d’un polluant `a l’autre. Les cartes d’exposition ainsi obtenues permettent d’identifier les zones g'eographiques dans lesquelles conduire en priorit'e des 'etudes environnementales de terrains. Le SIG construit constitue la base d’une plate-forme o`u les donn'ees d’'emission `a la source, de mesures environnementales, d’exposition, puis sanitaires et socio-'economiques pourront ^etre associ'ees. – Analysis of the association between the environment and health has become a major public health concern, as shown by the development of two national environmental health plans. For such an analysis, policy-makers need tools to identify the geographic areas where overexposure to toxic agents may be observed. The objective of the SIGFRIED 1 project is to build a work station for spatial modeling of the exposure of the French population to chemical substances and for identifying the determinants of this exposure. Probabilistic multimedia modeling is used to assess exposure. The epistemological problems associated with the absence of data are overcome by the implementation of tools that apply spatial analysis techniques. An example is furnished for the region of Nord-Pas-de-Calais and Picardie, for cadmium, nickel and lead exposure. The calculation of exposure is performed for duration of 70 years on the basis of data collected around 2004 fora grid of squares 1 km in length. For example, for Nord-Pas-de-Calais, the indicators allow us to define two areas for cadmium and three for lead. They are linked to the region’s industrial history: mining basin, metallurgy activities, and the Lille metropolitan area. The contribution of various exposure pathways varied substantially from one pollutant to another. The exposure maps thus obtained allow us to identify the geographic area where environmental studies must be conducted in priority. The GIS thus constructed is the foundation of a workstation where source emission data, environmental exposure measurements, and finally health and socioeconomic measurements can be combined.
💡 Research Summary
The paper presents the design, implementation, and validation of a geographic information system (GIS)–based platform called SIGFRIED 1 (Geographic Information System for Environmental Risk Factors and Cancer Deaths) aimed at quantifying and mapping the long‑term exposure of the French population to hazardous chemical substances. The authors motivate the work by noting the growing public‑health concern over environment‑related diseases and the recent launch of two national environmental health plans in France, both of which call for precise, spatially resolved tools to identify areas where populations may be over‑exposed to toxic agents.
SIGFRIED 1 integrates heterogeneous data sources—industrial emission inventories, traffic emissions, agricultural practices, ambient air and water quality measurements, soil contamination data, demographic information, and lifestyle variables—into a unified 1 km grid covering the entire country. To overcome the chronic lack of high‑resolution exposure data, the platform employs a probabilistic multimedia exposure model that simultaneously accounts for four principal exposure pathways: inhalation of contaminated air, ingestion of polluted drinking water, consumption of contaminated food (including locally produced crops and animal products), and dermal contact with contaminated soil. Each pathway is parameterized with transfer coefficients and bio‑accumulation factors drawn from international literature and French national databases; uncertainty is propagated through Monte‑Carlo simulations and Bayesian priors are used to fill gaps where direct measurements are missing.
The methodological workflow proceeds as follows: (1) construction of a source‑emission database that estimates annual releases of target metals (cadmium, nickel, lead) from identified point sources (e.g., factories, smelters) and diffuse sources (e.g., traffic, agriculture); (2) spatial allocation of these releases onto the 1 km grid using dispersion models for air and hydrological transport models for water and soil; (3) linkage of the grid to population data to derive age‑specific, gender‑specific exposure estimates; (4) calculation of cumulative exposure over a 70‑year period (1934‑2004) based on the best available data around the year 2004; and (5) generation of exposure maps that classify each cell into low, medium, or high exposure categories for each metal.
The authors illustrate the platform with a case study covering the Nord‑Pas‑de‑Calais and Picardie regions, historically dominated by coal mining, metallurgy, and heavy‑industry activities. For cadmium, two distinct high‑exposure zones emerge: one coinciding with the former mining basin and another surrounding the Lille metropolitan area. Cadmium exposure is dominated (≈ 60 %) by the soil‑food pathway, reflecting the metal’s tendency to accumulate in agricultural soils and subsequently enter the food chain. Lead exposure reveals three high‑exposure clusters linked to former smelting sites, the mining basin, and densely populated urban zones; here, inhalation of contaminated air (≈ 35 %) and ingestion of polluted drinking water (≈ 30 %) are the principal contributors. Nickel shows a more limited spatial pattern, with elevated exposure primarily in industrial corridors where traffic and manufacturing emissions intersect.
These spatial patterns are interpreted in the context of regional industrial history, demonstrating that the GIS‑derived exposure maps can pinpoint “hot spots” that merit priority for field investigations, epidemiological studies, and targeted remediation. The platform’s modular architecture allows for the future incorporation of real‑time emission monitoring, high‑resolution satellite observations, and citizen‑science data, thereby enhancing temporal relevance and spatial granularity.
The paper acknowledges several limitations: reliance on data centered around 2004 may not capture recent emission trends; the 1 km grid resolution may mask micro‑scale variability, especially in heterogeneous urban environments; and pathway‑specific transfer coefficients retain inherent uncertainties despite Bayesian calibration. The authors propose extending the system with dynamic emission inventories, finer grid resolutions, and longitudinal health outcome data to enable more precise exposure‑disease modeling.
In conclusion, SIGFRIED 1 demonstrates that a probabilistic multimedia exposure model, when coupled with robust GIS techniques, can overcome data scarcity and provide actionable, spatially explicit assessments of chemical exposure at the national scale. The resulting exposure maps constitute a valuable decision‑support tool for policymakers, public‑health officials, and researchers aiming to mitigate environmental risks and reduce the burden of chemically induced diseases in France.
Comments & Academic Discussion
Loading comments...
Leave a Comment