Compact USB measurement and analysis system for real-time fluctuation enhanced sensing
Measuring the resistance fluctuations of gas sensors provides new opportunities to enhance the selectivity and sensitivity of the sensor. Taking advantage of this possibility requires special low-noise measurement hardware and software to acquire data and perform analysis. In this paper we will present a small, USB-powered device capable of doing precise measurement of the resistance fluctuations of different kinds of gas sensors. We have developed a graphical user interface software to control the parameters of the measurement, to collect data and perform real time analysis on the measured data. The analysis is based on a PCA algorithm, which is proven to be a high performance tool to support fluctuation enhanced sensing. The system has been tested on Taguchi and carbon nanotube based gas sensors as well. The main advantages of the system include the small form factor, low cost and the fully featured software performing all required data analysis operations. Complemented with a gas sensor and an optional test chamber, the setup can serve as an efficient tool for practical fluctuation-enhanced gas sensing.
💡 Research Summary
**
The paper presents a compact, USB‑powered measurement and analysis platform designed for real‑time fluctuation‑enhanced gas sensing. The authors combine a low‑noise analog front‑end, a mixed‑signal microcontroller data‑acquisition unit, and a PC‑based graphical user interface (GUI) to acquire, process, and interpret resistance fluctuations of various gas sensors.
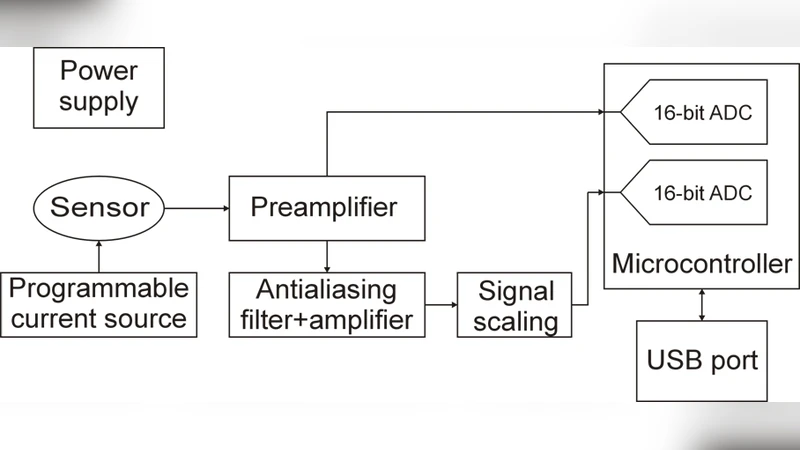
The analog front‑end uses a precision voltage reference (AD780) together with a low‑noise current source (MAX4478) to convert the sensor resistance into a voltage. An inverting amplifier and a programmable‑gain amplifier (LTC1564) amplify the AC component by roughly 1 k× while rejecting the DC offset. Two stages of high‑pass filtering limit the bandwidth to 20 kHz, which is sufficient for the low‑frequency noise signatures exploited in fluctuation‑enhanced sensing.
Data acquisition is handled by a Silicon Labs C8051F060 microcontroller. Its dual 16‑bit ADCs digitize both the DC and AC channels simultaneously, storing samples in on‑chip SRAM before streaming them over a USB‑UART bridge (FT232RL) to a host computer. The sampling rate can be set up to 50 kHz, though the effective measurement bandwidth is limited to 20 kHz by the analog filters. Power can be drawn from the USB port or from an external low‑noise DC‑DC converter (TMR200521). The microcontroller also provides 12‑bit DAC outputs to set the sensor heating voltage and an optional gate voltage, enabling precise control of sensor operating conditions.
The host‑side GUI software offers full control over measurement parameters: sampling frequency, anti‑aliasing filter cutoff, sensor excitation current, heating voltage, and gate voltage. Raw data are displayed in real time, and the software computes the power spectral density (PSD) on‑the‑fly using user‑defined averaging and frequency‑range settings. Users can optionally suppress the 50 Hz/60 Hz mains components. The PSDs are saved to files for later analysis.
For pattern recognition, the authors implement a principal component analysis (PCA) module that operates on the PSDs. By projecting the high‑dimensional PSD vectors onto the first two principal components, distinct clusters corresponding to different gases and concentrations become visible. The PCA calculation can be performed online, while additional PSDs can be averaged offline to improve robustness.
Experimental validation was carried out with carbon‑nanotube (CNT) sensors whose resistance varied between 10 kΩ and 1 MΩ, as well as with conventional Taguchi metal‑oxide sensors. Gases such as CO, NO, and CH₄ were introduced at concentrations ranging from a few tens to several thousand ppm in an argon carrier. Measurements were taken at a 20 kHz sampling rate with 16 384‑point FFTs; 100 PSDs were averaged for each PCA run, and five repeated measurements per gas type were performed. The resulting PCA plots clearly separated the different gases and also distinguished between different concentrations of the same gas (e.g., 25 ppm, 50 ppm, 100 ppm CO).
Key advantages of the system include:
- Compact, low‑cost hardware – the entire measurement chain fits in a USB‑powered enclosure using off‑the‑shelf components.
- Full‑featured software – real‑time data acquisition, PSD computation, and PCA‑based classification are all integrated into a single GUI, eliminating the need for separate signal‑processing hardware.
- High selectivity and sensitivity – fluctuation‑enhanced sensing combined with PCA enables discrimination of gases using a single sensor, reducing system complexity.
Limitations noted by the authors are the modest 20 kHz bandwidth, which may miss higher‑frequency noise features, and the reliance of PCA on a pre‑collected training set. Future work could involve faster ADCs or FPGA‑based processing to extend the bandwidth, and the adoption of more advanced machine‑learning techniques (e.g., nonlinear dimensionality reduction, deep neural networks) to handle multi‑gas mixtures and improve quantitative concentration estimation.
In conclusion, the paper demonstrates a practical, USB‑driven platform that successfully implements fluctuation‑enhanced gas sensing with real‑time spectral analysis and pattern recognition. The system’s small footprint, affordability, and integrated software make it a promising tool for laboratory research as well as field‑deployable gas monitoring applications.
Comments & Academic Discussion
Loading comments...
Leave a Comment