Determinants of the Pace of Global Innovation in Energy Technologies
Understanding the factors driving innovation in energy technologies is of critical importance to mitigating climate change and addressing other energy-related global challenges. Low levels of innovation, measured in terms of energy patent filings, were noted in the 1980s and 90s as an issue of concern and were attributed to low investment in public and private research and development (R&D). Here we build a comprehensive global database of energy patents covering the period 1970-2009 which is unique in its temporal and geographical scope. Analysis of the data reveals a recent, marked departure from historical trends. A sharp increase in rates of patenting has occurred over the last decade, particularly in renewable technologies, despite continued low levels of R&D funding. To solve the puzzle of fast innovation despite modest R&D increases we develop a model that explains the nonlinear response observed in the empirical data of technological innovation to various types of investment. The model reveals a regular relationship between patents, R&D funding, and growing markets across technologies, and accurately predicts patenting rates at different stages of technological maturity and market development. We show quantitatively how growing markets have formed a vital complement to public R&D in driving innovative activity; these two forms of investment have each leveraged the effect of the other in driving patenting trends over long periods of time.
💡 Research Summary
The paper tackles a paradox that has emerged in the field of energy technology innovation: despite relatively flat public and private research‑and‑development (R&D) spending since the early 2000s, the rate of patent filings—especially in renewable energy sectors such as solar photovoltaics and wind—has surged dramatically. To resolve this puzzle, the authors construct a comprehensive global database of energy‑related patents spanning 1970 to 2009, covering more than one million patents across thirty countries and ten technology families (solar, wind, bio‑fuels, hydrogen, nuclear, fossil‑based, storage, smart grid, power electronics, and others). Each patent is linked to two macro‑level variables: (1) the amount of R&D investment (public and private) and (2) the market size of the corresponding technology, measured by annual installed capacity, sales, or investment flows.
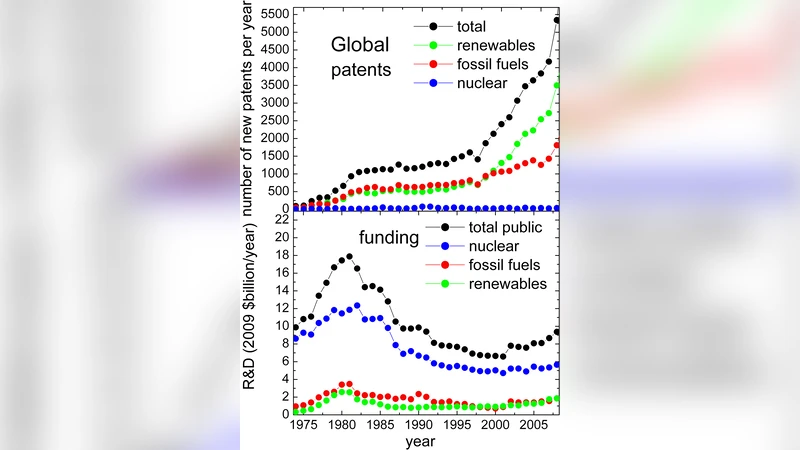
Descriptive analysis shows that patent activity was stagnant throughout the 1980s and 1990s, then entered a period of rapid growth from the early 2000s onward, with average annual growth rates exceeding 12 % and reaching 18 % for solar PV and 16 % for wind after 2005. In contrast, global R&D expenditures, expressed in constant 1995 dollars, rose by less than 2 % per year after 2000, remaining close to the levels of the early 1990s. Market size, however, expanded at an average of over 20 % per year, driven by policy incentives (feed‑in tariffs, renewable portfolio standards) and tightening carbon regulations.
To capture the observed dynamics, the authors propose a non‑linear composite investment model:
\
Comments & Academic Discussion
Loading comments...
Leave a Comment