Time-resolved and spectral-resolved optical imaging to study brain hemodynamics in songbirds
Contrary to the intense debate about brain oxygen dynamics and its uncoupling in mammals, very little is known in birds. In zebra finches, picosecond optical tomography (POT) with a white laser and a streak camera can measure in vivo oxy-hemoglobin (HbO2) and deoxy-hemoglobin (Hb) concentration changes following physiological stimulation (familiar calls and songs). POT demonstrated sufficient sub-micromolar sensitivity to resolve the fast changes in hippocampus and auditory forebrain areas with 250 \mu m resolution. The time-course is composed of (i) an early 2s-long event with a significant decrease in Hb and HbO2, respectively -0.7 \mu Moles/L and -0.9 \mu Moles/L (ii) a subsequent increase in blood oxygen availability with a plateau of HbO2 (+0.3 \mu Moles/L) and (iii) pronounced vasodilatation events immediately following the end of the stimulus. One of the findings of our work is the direct link between the blood oxygen level-dependent (BOLD) signals previously published in birds and our results. Furthermore, the early vasoconstriction event and post-stimulus ringing seem to be more pronounced in birds than in mammals. These results in bird, a tachymetabolic vertebrate with a long lifespan, can potentially yield new insights for example in brain aging.
💡 Research Summary
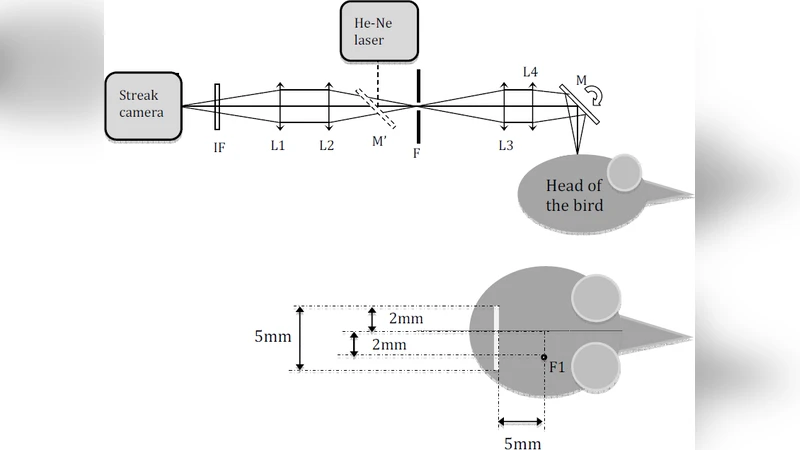
This paper presents a pioneering application of picosecond optical tomography (POT) to investigate the hemodynamic response of the zebra finch (Taeniopygia guttata) brain during auditory stimulation. The authors built a custom POT system that combines a broadband white‑laser source (650–950 nm) with a streak camera capable of sub‑nanosecond temporal resolution. This configuration yields a spatial resolution of approximately 250 µm and a concentration sensitivity better than 0.1 µM L⁻¹, far surpassing conventional near‑infrared spectroscopy (NIRS) and functional NIRS (fNIRS) techniques.
In the experimental paradigm, lightly anesthetized birds were presented with two types of acoustic stimuli: familiar calls and novel conspecific songs, each lasting 5 seconds, followed by a 10‑second post‑stimulus recovery period. Optical probes were positioned over the hippocampus and the higher auditory forebrain nuclei (NCM and CMM), regions known to process complex vocalizations. Baseline recordings were obtained for 5 seconds before stimulus onset. The raw time‑wavelength data were decomposed by multivariate linear regression using the known absorption spectra of oxy‑hemoglobin (HbO₂) and deoxy‑hemoglobin (Hb), allowing the authors to extract absolute concentration changes (µM L⁻¹) for each chromophore at every time point.
Three distinct phases of the hemodynamic response emerged:
-
Early dip (0–2 s) – Both Hb and HbO₂ decreased rapidly, by –0.7 µM L⁻¹ and –0.9 µM L⁻¹ respectively. The authors interpret this as an immediate vasoconstriction that reduces cerebral blood volume and oxygen delivery, analogous to the “initial dip” observed in mammalian BOLD studies but with a larger amplitude and shorter duration.
-
Compensatory plateau (2–5 s) – HbO₂ rises to a modest plateau (+0.3 µM L⁻¹) while Hb remains relatively stable, indicating a rapid increase in cerebral blood flow that restores oxygen availability. This phase reflects neurovascular coupling that matches metabolic demand.
-
Post‑stimulus ringing (0–3 s after offset) – A pronounced vasodilation follows stimulus termination, producing a transient overshoot in Hb concentration. This “ringing” effect is more marked in birds than in mammals and suggests a robust rebound vasodilatory mechanism.
The authors compare these optical findings with previously published BOLD fMRI data in birds, confirming that the BOLD signal is largely driven by the same Hb/HbO₂ dynamics captured by POT. Notably, the magnitude of the early vasoconstriction and the post‑stimulus ringing exceed those reported in rodent studies, highlighting a possible species‑specific vascular phenotype linked to the high metabolic rate (“tachymetabolic”) and long lifespan of avian species.
Methodologically, the study demonstrates that POT can resolve sub‑micromolar hemoglobin changes in small, densely packed avian brain structures, opening the door to real‑time, label‑free monitoring of neurovascular coupling in non‑mammalian models. The authors acknowledge limitations: the use of anesthesia may alter vascular tone, the sample size was modest, and absolute cerebral blood flow was not measured directly. Future work is suggested to integrate Doppler ultrasound or laser speckle imaging for flow quantification, to perform chronic recordings in awake birds, and to explore a broader repertoire of behavioral tasks (e.g., social interaction, learning).
In conclusion, this work establishes picosecond optical tomography as a powerful tool for avian neuroimaging, reveals distinctive hemodynamic signatures in the zebra finch brain, and proposes that these signatures could provide novel insights into brain aging and metabolic regulation across vertebrates. The findings encourage the adoption of birds as complementary models for studying neurovascular physiology and its evolution.
Comments & Academic Discussion
Loading comments...
Leave a Comment