Non-parametric resampling of random walks for spectral network clustering
Parametric resampling schemes have been recently introduced in complex network analysis with the aim of assessing the statistical significance of graph clustering and the robustness of community partitions. We propose here a method to replicate struc…
Authors: Fabrizio De Vico Fallani, Vincenzo Nicosia, Vito Latora
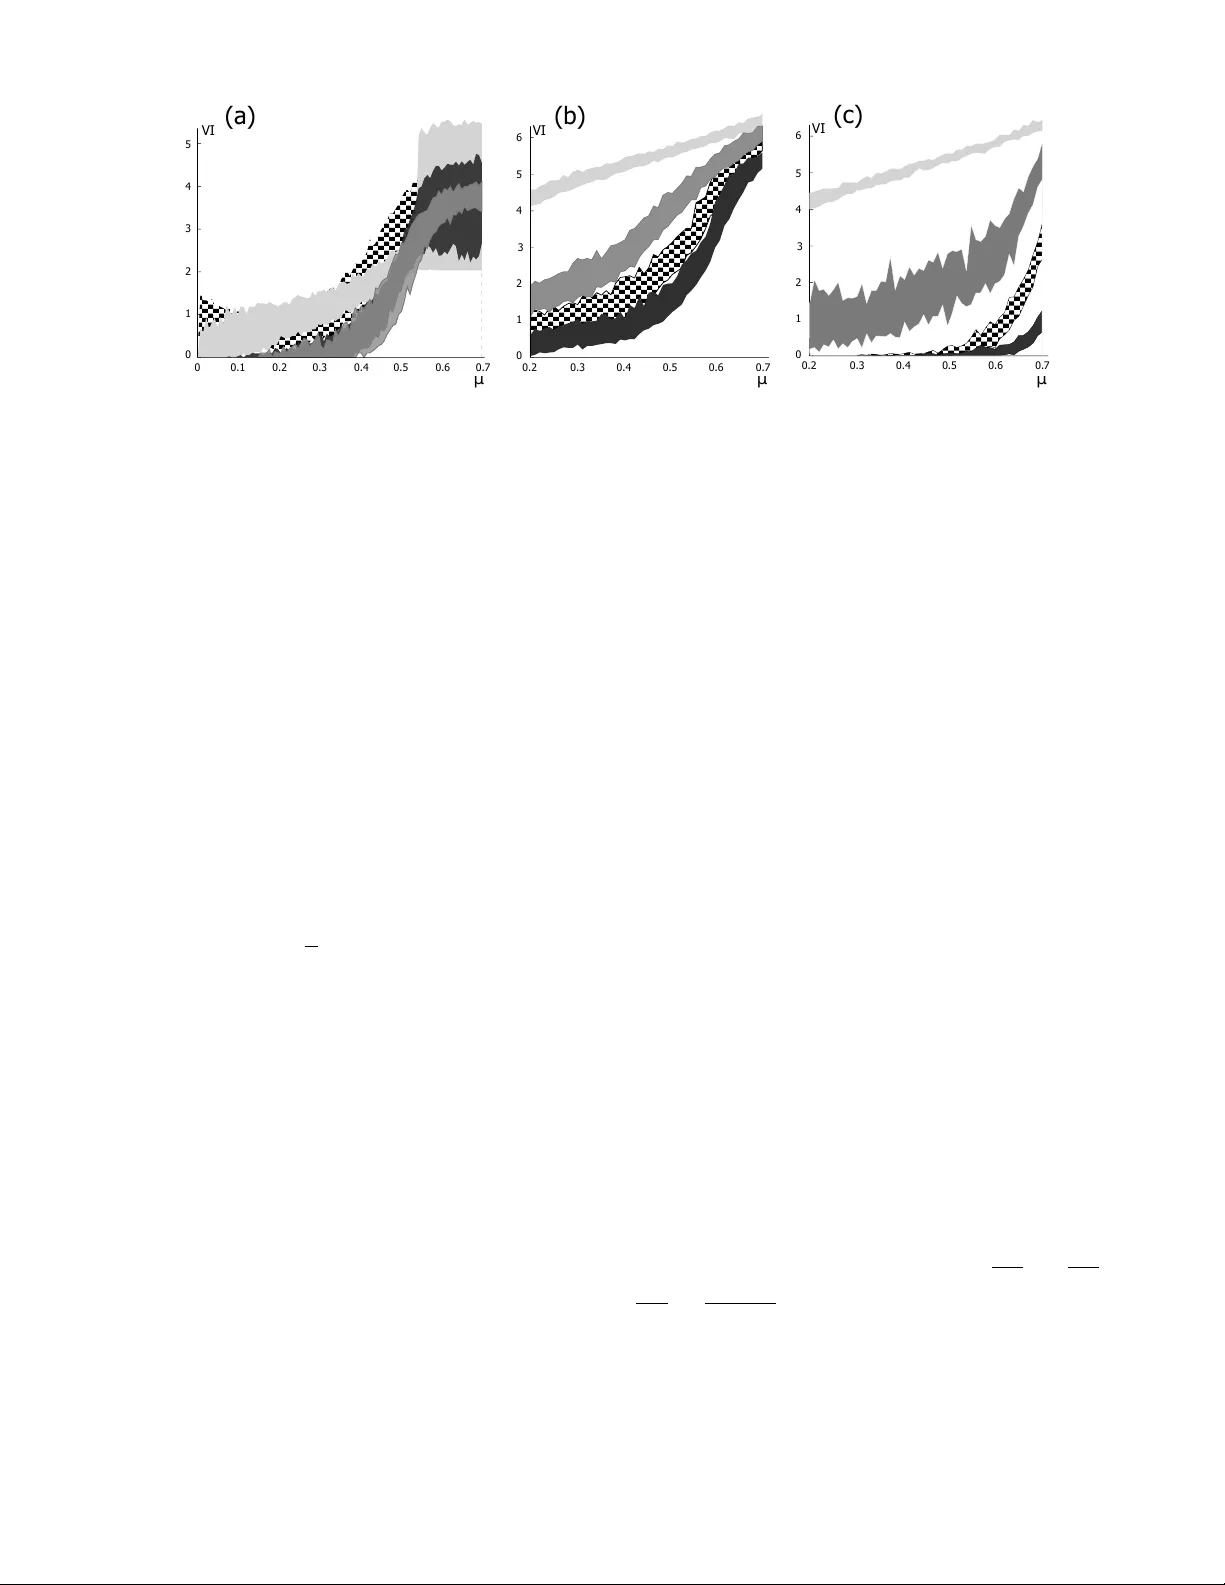
Non-parametric resampling of random w alks for sp ectral net w ork clustering F abrizio De Vico F allani, 1 Vincenzo Nicosia, 2 Vito Latora, 2, 3 and Mario Cha vez 1 1 CNRS UMR-7225, Hˆ opital de la Piti´ e-Salpˆ etri ` er e. Paris, F r anc e 2 Scho ol of Mathematic al Scienc es, Que en Mary University of L ondon, Mile End R o ad, E1 4NS, L ondon (UK). 3 Dip artimento di Fisic a e Astr onomia, Universit´ a di Catania, Via S. Sofia 61, 95123, Catania (Italy) (Dated: No vem ber 11, 2018) P arametric resampling schemes hav e been recen tly introduced in complex net work analysis with the aim of assessing the statistical significance of graph clustering and the robustness of communit y partitions. W e propose here a method to replicate structural features of complex netw orks based on the non-parametric resampling of the transition matrix asso ciated with an unbiased random w alk on the graph. W e test this b ootstrapping technique on synthetic and real-world mo dular netw orks and we show that the ensemble of replicates obtained through resampling can b e used to impro ve the p erformance of standard sp ectral algorithms for communit y detection. P ACS n um b ers: 89.75.-k, 02.50.Ga, 05.10.Ln In the past decade, netw ork science has prov en to be a robust and comprehensiv e framework to inv estigate, mo del and understand the structure and function of the complex interaction patterns observed in div erse biologi- cal, physical, so cial and technological systems [1–4]. One of the most intriguing characteristic of many real-world complex netw orks is the presence of communities, i.e. tigh tly-knit groups of no des which exhibit p o or connec- tivit y with the rest of the graph [5]. As a matter of fact, man y exp erimental evidences hav e confirmed that com- m unities are the meso-scale building blocks of complex net works: they usually corresp ond to functional mo dules in the brain [6, 7], to topical clusters in so cial and com- m unication net works [8], to metab olic reactions and func- tional domains in protein in teraction net w orks [9, 10], to disciplines and research areas in collab oration net- w orks [5]. Consequently , a lot of effort has b een devoted to the identification of efficien t algorithms for comm unit y detection [11]. A t ypical problem in complex net w orks analysis is that a real-wor ld netw ork is just a single observ ation dra wn from an unkno wn distribution of graphs having certain c haracteristics [12]. As a consequence, there is no pre- defined w ay to assess the statistical v ariability of any lo- cal, meso-scale of global netw ork prop ert y , including the presence and composition of comm unities. A widely used approac h to determine the statistical significance of net- w ork observ ables consists in considering random network ensembles , i.e. sets of graphs obtained from the origi- nal netw ork by k eeping fixed some structural prop erties (e.g. the degree sequence or the clustering co efficien t) and rewiring the edges at random [13 – 15]. In the case of comm unity detection, this approac h led to the defi- nition of the mo dularit y function, which quan tifies the significance of a giv en communit y partition of a graph as the deviation from the av erage mo dularity exp ected in an ensemble of random graphs having the same degree sequence [8]. Another p ossibilit y is p ar ametric b o otstr ap- ping , in which the robusteness of a net work prop erty is assessed against small perturbations of the graph con- nectivit y [16 – 18]. This approach relies on the h yp othe- sis that the observed net w ork is representativ e of a set of graphs (a mo del) ha ving a certain ( a-priori kno wn) structure. Consequently , the v ariability of an y net w ork observ able can be estimated as the deviation from the a v- erage of the corresp onding mo del. Many different para- metric resampling schemes ha ve b een used to assess the robustness of netw ork comm unities against small connec- tivit y p erturbations. Ho w ever, all these metho ds require an a-priori hypothesis ab out the mo del to which the net- w ork b elongs, so that the un biased statistical assessment of a net work partition remains an op en challenge [19]. A p ossible solution to this problem is non-p ar ametric b o otstr apping , a data-driven tec hnique for pro viding the statistical confidence of almost an y statistical esti- mate [20, 21], based on the generation of rep eated obser- v ations (replicates) from an unkno wn population using the av ailable data samples (in our case, a single netw ork) as a starting p oin t. This approach has b een successfully emplo yed for sev eral differen t applications, and in partic- ular to impro v e the stabilit y and accuracy of clustering algorithms in metric spaces [22]. In this Brief Rep ort w e prop ose to use non-parametric b ootstrapping to impro ve the performance of sp ectral comm unity detection algorithms. The method is based on the construction of replicates of the transition matrix of the netw ork, and on the estimation of an av erage dis- tance matrix, whose elements correspond to the exp ected sp ectral distances betw een pairs of no des of the graph, a veraged o ver the ensem ble of replicates. Then, the ob- tained distance matrix is fed in to a standard hierarchical clustering algorithm. The idea is that the aggregation of information ab out differen t replicates, representativ e of the unknown ensemble to which the netw ork b elongs, should filter out noise and allow to obtain more accurate and robust partitions than the one found on the original net work. This approac h is in the same line of ensemble or consensus clustering metho ds, which combine several partitions generated b y differen t clustering algorithms — or b y differen t runs of the same algorithm— in to a single, more robust partition [17, 18, 23 – 25]. W e analyze the comm unity partitions obtained b y non-parametric b o ot- 2 strapping in differen t synthetic and real-world mo dular net works, and we sho w that this approach can substan- tially improv e the p erformances of existing sp ectral clus- tering metho ds. Sp e ctr al clustering for c ommunity dete ction.– Let G ( V , E ) be a connected undirected and un weigh ted graph with N = | V | nodes and K = | E | edges, and let A = { a ij } be the adjacency matrix of G , whose entry a ij = 1 if there is an edge connecting node i and node j , while a ij = 0 otherwise. W e consider the problem of finding comm unities of G , i.e. subsets of no des of G whic h are more connected in ternally than with the rest of the graph [8]. Several communit y detection algorithms are based on mapping each no de of G in to a p oint of an appropriate metric space X , so that t w o no des i and j ha ving similar structural properties (e.g., similar set of neigh b ours) are mapp ed to t wo points x i and x j placed relativ ely close to each other in X . Then, the no des are clustered according to the Euclidean distance b et w een their corresp onding images in X , so that nodes whose pro jections are closer in X hav e a higher probability to b e put in the same cluster. A widely adopted metho d to map the nodes of a graph into a metric space mak es use of spectral prop- erties of matrices asso ciated to G , and in particular of the eigenv ectors of the adjacency matrix A or, more fre- quen tly , of the transition matrix P = { P ij } asso ciated to an unbiased random walk on the graph ( P ij = a ij /k i , where k i = P j a ij is the degree of node i ) [6, 26 – 28]. This choice is motiv ated b y the observ ation that both A and P carry information ab out the ov erall structure of the graph. Here w e consider the transition matrix P . This matrix is characterized by a set of eigen v alues { λ 0 , λ 1 , . . . , λ N − 1 } suc h that | λ 0 | ≥ | λ 1 | ≥ . . . ≥ | λ N − 1 | . Eac h eigenv alue λ k is asso ciated to the left and righ t eigen vectors ϕ k and ψ k , which satisfy ϕ | k P = λ k ϕ | k and P ψ k = λ k ψ k , resp ectively . Thus, it is p ossible to map no de i to the p oin t x i ∈ R N whose k th co ordinate is equal to the the i th comp onen t of the k th righ t eigenv ector of P . The distance d ij b et w een tw o p oin ts x i and x j , can b e written in terms of eigen v ectors and eigenv alues of P [29], namely: d ij = q P k ≥ 1 λ 2 k ( ψ k ( i ) − ψ k ( j )) 2 where ψ k ( j ) denotes the j th comp onen t of the k th righ t eigen- v ector. In general, this distance can b e approximated by using only the first β nontrivial eigenv ectors and eigen- v alues of P [30]: d ij ' v u u t β X k =1 λ 2 k ( ψ k ( i ) − ψ k ( j )) 2 . (1) The elements { d ij } of the matrix D obtained from Eq. (1) represen t the distances betw een each pair of p oin ts x i and x j in the lo wer dimensional space X ≡ R β . Since the terms { d ij } represen t distances in a metric space, then we can use the matrix D to detect candidate comm unity partitions of G b y means of hierarchical clus- tering, an iterative aggregation algorithm which starts b y considering each no de as a separate cluster, and succes- siv ely merges the t w o clusters having minimal distance according to D [31]. The algorithm stops when all the no des hav e b een group ed in a single cluster. The hier- arc hical clustering algorithm pro duces a dendrogram H , i.e. a tree where eac h of the N − 1 in ternal nodes rep- resen ts the fusion of tw o clusters. A horizontal cut of H corresp onds to a partition of the graph into a certain n umber of comm unities. The qualit y of eac h partition S can b e quantified using the mo dularit y function [8], whic h compares the abundance of edges lying inside each comm unity with resp ect to a null mo del. In form ula: Q ( S ) = N s X s =1 " m s K − k s 2 K 2 # , (2) where N s is the num ber of clusters in the partition S , K is the total num ber of edges in the netw ork, m s is the num ber of edges betw een vertices in cluster s , and k s is the sum of the degrees of the no des in cluster s . W e assume that the b est partition in communities of the graph G is the cut of the dendrogram H having maxim um mo dularit y . Clustering thr ough non-p ar ametric b o otstr apping.– The main limitation of communit y detection algorithms based on the sp ectral prop erties of the transition matrix is that the obtained partition is prett y sensitiv e to fluctu- ations in the adjacency matrix of the graph. As a matter of fact, the eigenv alues and eigenv ectors of the transition matrix can b e substantially mo dified by adding, deleting or rewiring just a few edges. Therefore, we prop ose to im- pro ve the quality of sp ectral clustering by using informa- tion ab out the av erage sp ectral properties of transition matrices obtained b y a non-parametric b o otstrapping of the observed matrix P . The authors of Ref. [32] hav e prop osed a generic b oot- strap scheme to resample the transition probabilities of a finite state time-inv ariant Mark ov c hain. Starting from a realization χ of the Marko v chain, one constructs the maxim um likelihoo d estimator of the associated transi- tion matrix P as p ij = f ij f i , where f ij is the observed n umber of transitions from state i to state j in χ and f i = P j f ij . Then, replicates of the observ ed transition ma- trix are obtained b y dra wing, for eac h state i , the random v ariables { f ∗ i 1 , . . . , f ∗ iN } ∼ Multinomial( f i ; p i 1 , . . . , p iN ) according to f P ij = f ∗ ij f i . The distribution of e P is then obtained by Monte-Carlo sampling. This approac h w as sho wn to b e asymptotically v alid for approximating the sampling distribution of P [32], and has b een also used to assess the confidence in terv als of transition probabilities in disease mo deling [33]. Since the unbiased random walk on the graph G de- fined b y the transition matrix P is a finite-state time- in v arian t Marko v c hain, we can construct a similar re- sampling sc heme in which replicates of the transition matrix P are obtained b y randomly dra wing the v ari- ables { f ∗ i 1 , . . . , f ∗ iN } from a m ultinomial distribution with probabilities { p i 1 , . . . , p iN } , conditional on the observed 3 5 4 3 2 1 0 6 0 . 7 0 .6 0 .5 0 .4 0 .3 0 .2 VI (b) µ 5 4 3 2 1 0 0 .5 0 .4 0 .3 0 .2 0 .1 0 0 .6 0 . 7 VI (a) µ 5 4 3 2 1 0 6 0 . 7 0 .6 0 .5 0 .4 0 .3 0 .2 VI (c) µ FIG. 1. Benc hmark net works. The v ariation of information V I as a function of the proportion of in ter-mo dules links µ in GN graphs (a) and as a function of the mixing parameter µ in LFR500 (b) and LFR2000 (c) graphs. The region inside each curv e includes the 5 th and the 95 th p ercen tiles of V I across R different runs. The four curv es in each panel corresp ond to the optimal partitions obtained using, resp ectively , the distance matrix D induced by P for β = 1 (light gray) and β = 10 (chec ked pattern), the av erage distance matrix e D ∗ o ver the p opulation of replicates P ∗ for β = 1 (blac k), and mo dularit y optimization on the adjacency matrix A , as describ ed in Refs. [8, 36] (dark-gray). The netw ork order N , the num b er of runs R , and the n umber B of b o otstrap realizations for each run are (a) N = 128, R = 100, and B = 100; (b) N = 500, R = 100, and B = 100; and (c) N = 2000, R = 50, B = 50. degree sequence { k i } of G . It is worth noticing that, in con trast to previous approaches where each link was re- sampled indep endently from the others [16, 18], here the replicas of the transition probabilities for each no de i are dra wn from a multinomial distribution, accounting for the observed transitions to other no des { p i 1 , . . . , p iN } . Giv en the transition matrix P of G , we generate B b ootstrap transition matrices { P ∗ 1 , P ∗ 2 , . . . , P ∗ B } . Then, w e pro ject each matrix P ∗ b in to R β (where β is a tunable parameter), and w e estimate the corresp onding b o ot- strap distance matrices D ∗ b , whose en try d b ij is the Eu- clidean distance betw een x i and x j in R β according to the mapping induced by P ∗ b . Then, we compute the av erage distance matrix e D ∗ = 1 B P b D ∗ b , which is expected to b e the most consistent (similar) with the cen tral tendency of the p opulation of replicates. The matrix e D ∗ = { e d ∗ i,j } effectiv ely quantifies the dissimilarity b et ween an y pair of v ertices of G (the smaller the distance e d ∗ i,j the more similar are i and j ), in terms of the av erage distance b e- t ween their pro jections in R β across several replicas of P . W e notice that, in principle, the sp ectral netw ork de- comp osition based on non-parametric b o otstrapping does not rely on mo dularit y , so that any quality function can b e used to determine the b est partition in the dendro- gram. W e also would lik e to stress that the partitions obtained with resampling-based clustering metho ds do not necessarily pro vide the absolute optimum of a giv en qualit y function. Instead, non-parametric b o otstrapping yields partitions that are the most consistent with the cen tral tendency across different replicates dra wn from the same p opulation. Synthetic networks.– W e hav e tested the p erformance of our approach on t wo classes of synthetic graphs with tunable modular structure. In the first b enc hmark (GN), prop osed by Girv an and Newman [5], eac h netw ork con- sists of N = 128 nodes divided into 4 mo dules of equal size. Pairs of nodes in the same module are connected with probabilit y p in , while nodes b elonging to different mo dules are linked with a probabilit y p out . P arameters are set suc h that the a verage degree is k ept constant h k i = 16. By appropriately tuning p in and p out one can set the percentage µ of edges lying betw een comm unities. The second class of mo dular graphs (LFR), prop osed by Lancic hinetti, F ortunato and Radicchi [34], accounts for the heteroge neit y in the distributions of no de degrees and comm unity sizes. In this case, w e generated mo dular graphs with scale-free degree distribution P ( k ) ∼ k − γ and communit y size distribution P ( s ) ∼ s − η , where γ = 2 and η = 1. An appropriate tuning of the mo del parameters allows to create graphs with a prescrib ed frac- tion µ of inter-comm unit y edges. W e considered graphs ha ving N = 500 and h k i = 7 (LFR500) and graphs with N = 2000 no des and h k i = 28 (LFR2000). Since the real partition in communities of these syn- thetic netw orks is a-priori known, w e can compare the b est partition obtained through sp ectral clustering with the reference one. A widely used measure to compare t wo different partitions is the v ariation of information ( V I ) [35]. In a nutshell, this non-negative metric quan- tifies how m uch information is lost and gained in chang- ing from a partition A to a partition B . It can b e estimated by V I ( A , B ) = − P c A i P c B j ( n AB ij N ) log n AB ij N + n AB ij N log AB ij / N n A i n B j / N 2 , where c A ( c B ) is the total num b er of clusters in the partition A ( B ), n A i ( n B j ) is the num b er of no des in the i th ( j th ) cluster of partition A ( B ), and n AB ij is the n umber of no des shared b y the i th cluster of partition A and the j th cluster of partition B . V alues of 4 d 1 n o d e s ( a ) ( b ) ( c ) 6 1 1 5 7 1 7 1 8 1 3 2 2 1 1 2 8 2 0 2 9 2 9 3 2 2 5 2 8 2 6 2 4 3 0 2 7 1 9 1 5 2 1 1 6 2 3 3 3 3 4 3 1 1 0 3 1 4 4 n o d e s n o d e s 5 1 3 15 34 1 3 15 34 5 1 3 15 34 0.3 0.4 0.2 0.1 0 0.5 0.25 0 0.5 0.25 0 d 3 d 3 4 2 1 . 5 1 0 . 5 0 0 0 . 5 1 1 . 5 2 2 . 5 3 3 . 5 P ( V I ) V I FIG. 2. (a) The b est partition of the Zachary Karate club net work obtained through non-parametric b o otstrap ( B = 20000 replicas) giv es a v alue of mo dularity Q = 0 . 389; (b) the distribution of V I across the replicates with resp ect to the partition induced b y e D ∗ (solid black line) and the parti- tion with maximum mo dularit y (solid grey line); the vertical dotted line indicates the V I betw een the partition with max- im um mo dularit y and the one induced b y e D ∗ ( V I = 0 . 952). Dashed lines indicate the distribution of V I for B = 20000 random partitions, with resp ect to the partition induced by e D ∗ (dashed black line) and the one with maximum mo du- larit y (dashed grey line). (c) Sp ectral distance b et ween no de i = 1, (top) i = 3 (middle), i = 34 (b ottom) and the rest of the no des. Gray regions indicate the 0 . 05 th –95 th p ercen tiles in terv al of the b o otstrap distribution. V I range from 0, when A and B are identical partitions, to log N when b oth A and B are randomly drawn. Fig. 1 sho ws the v ariation of information b et w een the reference partition and the best one obtained through b ootstrap-based sp ectral clustering, as a function of the fraction of inter-comm unit y edges µ . The rep orted re- sults suggest that even when the graphs do not hav e any more a strong comm unity structure, i.e. when for each no de the num b er of neighbours outside its communit y is similar with the num b er of neighbours inside its com- m unity , the accuracy of the prop osed b ootstrap-based metho d remains prett y high. F or GN net works, the accu- racy of the b o otstrap-based metho d is comparable to that of a standard mo dularit y optimization algorithm [8, 36]. F or LFR500 and LFR2000, the non-parametric b o otstrap metho d outp erforms the other algorithms, even when we consider an em bedding with β = 1, and exhibits a smaller v alue of V I up to relatively large v alues of µ . The Zachary’s kar ate club network.– Fig. 2(a) sho ws the b est partition found b y the b o otstrap-based algo- rithm ( B = 20000, β = 1) in the Zachary’s k arate club net work [37], a paradigmatic example of graph with a strong modular structure. The partition consists of three main mo dules (black circles, white circles and grey dia- monds, resp ectiv ely) and a small in terface communit y whic h con tains no des { 3 , 9 , 10 , 31 } (grey ellipses). The distribution of the V I b et ween the partitions obtained through sp ectral clustering on each single replicate and the one found using e D ∗ (rep orted in Fig. 2(b), solid black line) shows that the latter one indeed represents the cen- tral tendency of the population of replicates. Ho w ev er, the typical V I betw een the partition of a single replicate and the one with maximum mo dularity (Fig. 2(b), grey curv e) is higher than that obtained by av eraging ov er all replicates (indicated in Fig. 2(b) by the v ertical line). Notice also that the typical V I b etw een random parti- tions of the graph and, resp ectiv ely , the one obtained a veraging o ver all replicates or the one with maximum mo dularit y (resp ectively the dashed black line and the dashed grey line in Fig. 2(b)) is m uch larger than that obtained through sp ectral clustering. Despite the partition of Fig. 2(a) is not the one with maxim um mo dularity [38], it is worth noticing that most of the nodes put in the interface communit y (namely , 3, 9 and 10) hav e b een ambiguously classified by many dif- feren t communit y detection algorithms [39, 40], mostly b ecause assigning them to either the black or the white mo dule has negligible effects on mo dularit y [16]. A more in-depth analysis of the dissimilarit y matrix e D ∗ pro vides a p ossible explanation for this fact. In Fig. 2(c) w e re- p ort the a v erage spectral distance e d ∗ ij b et w een node 1 (top panel), node 3 (middle panel) and no de 34 (b ottom panel) and all the other no des in the graph. As exp ected, b oth no de 1 and no de 34 exhibit a sensibly smaller dis- tance tow ards the other no des in their rep ective natural comm unities, which is consisten t with the fact that 1 and 34 are kno wn to b e the centers of these t w o groups. Con- v ersely , the distance b etw een node 3 and the no des in the white communit y is comparable to that b et w een 3 and the nodes in the black comm unity . This explains wh y the central tendency of the p opulation of replicates is to place no de 3 in a separate comm unit y , together with other three no des having a similar sp ectral distance pat- tern. Concluding r emarks.– In this w ork w e ha ve sho wn ho w the generation of replicates of the transition matrix as- so ciated to a graph allows to improv e the p erformance of comm unity detection algorithms based on sp ectral clus- tering. In general, w e b eliev e that non-parametric b o ot- strapping techniques, which do not require any assump- tion ab out the ensem ble of graphs to which a given net- w ork b elongs, might b e successfully employ ed also to as- sess the significance of the v ariabilit y of no des attributes defined by differen t random w alk parameters (e.g. hitting times or return times), and for the statistical v alidation of other structural prop erties defined on different flav ors of random w alks [41, 42]. This work was supp orted b y the EU-LASA GNE Pro ject, Contract No.318132 (STREP). F. De Vico F al- lani is financially supp orted by the F renc h program “In- v estissements d’av enir” ANR-10-IAIHU-06. 5 [1] S. Bo ccaletti, V. Latora, Y. Moreno, M. Cha vez, and D.- U. Hwang, Phys. Rep. 424 , 175 (2006). [2] R. Alb ert and A.-L. Barabasi, R ev. Mo d. Phys. 74, , 47 (2002). [3] A. Barrat, M. Barthlemy and A. V espignani, Dynami- c al pr o c esses on c omplex networks Cambridge Universit y Press, Cambridge (2008). [4] M. Newman, Networks: an intr o duction , Oxford Univer- sit y Press, Oxford (2010). [5] M. Girv an and M. E. J. Newman, Pr o c. Natl. A c ad. Sci. USA 99 , 7821-7826 (2002). [6] M. Chav ez, M. V alencia, V. Na v arro, V. Latora, and J. Martinerie, Phys. R ev. L ett. 104 , 118701 (2010). [7] E. Bullmore and O. Sporns, Nat. R ev. Neur osci. 10 , 186– 198 (2009). [8] M. E. J. Newman and M. Girv an, Phys. R ev. E 69, 026113 (2004). [9] P .F. Jonsson, T. Cav anna, D. Zic ha, P .A. Bates, BMC Bioinf. 7, 2 (2006). [10] R. Guimer` a and L. A. N. Amaral, Nature 433 , 895 (2005). [11] S. F ortunato, Phys. R ep. 486 , 75 (2010). [12] S. W asserman and K. F aust, So cial Network Analysis . Cam bridge Universit y Press, Cambridge, (1994). [13] S. Maslov and K. Snepp en, Scienc e 296 , 910 (2002). [14] E. Ziv, R. Koytc heff, M. Middendorf and C. Wiggins, Phys. R ev. E. 71 , 016110 (2005) [15] G. Bianconi, P . Pin and M. Marsili, Pr o c. Natl. A c ad. Sci. USA 106 , 11433 (2009). [16] D. Gfeller, J. C. Chapp elier and P . De Los Rios, Phys. R ev. E. 72 , 056135 (2005) [17] B. Karrer, E. Levina and M.E.J. Newman, Phys. R ev. E. 77 , 046119 (2008) [18] M. Rosv all and C. T. Bergstrom, PL oS ONE 5 , e8694 (2010) [19] A. Mirshah v alad, O. H. Beauchesne, ´ E. Archam bault and M. Rosv all, PL oS ONE 8 , e53943 (2013) [20] B. Efron and R. J. Tibshirani, An Intr o duction to the Bo otstr ap . Chapman and Hall/CRC, New Y ork (1993). [21] B. Efron and R. Tibshirani, Statist. Sci. 1 , 54 (1986) [22] A. Strehl, and J. Ghosh, J. Mach. L e arn. R es. 3 , 583 (2002) [23] Kw ak, H., Choi, Y., Eom, Y.-H., Jeong, H., and Mo on, S., Pr o ce e dings of IMC ’09 , 301–314 (2009). [24] E.-Y. Kim, D.-U. Hw ang, and T.-W. Ko, Phys. R ev. E. 85 , 026119 (2012). [25] A. Lancichinetti and S. F ortunato Sci. R ep. 2 , 336 (2012); [26] D. M. Cv etk ovic, M. Doob, and H. Sac hs, Sp e ctr a of Gr aphs: The ory and Applic ations . Johann Ambrosius Barth V erlag, Heidelb erg, (1995). [27] F. R. K. Ch ung, Sp e ctr al Gr aph The ory . American Math- ematical So ciety , Providence, RI, (1997). [28] D. Gfeller, and P . De Los Rios, Phys. R ev. L ett. 99 , 038701 (2007). [29] R. R. Coifman and S. Lafon, Appl. Comput. Harmon. Anal. 21 5 (2006). [30] The quality of this approximation depends on the distri- bution of λ k . How ever, empirical evidences suggest that the sp ectral densit y of real-world scale-free netw orks is triangular, with pow er-law decaying tails (see for instance Ref. [2] for details), so that the sp ectral distance betw een an y pair of nodes is dominated by the con tributions given b y eigenv ectors asso ciated to the first few largest eigen- v elues. [31] The distance of tw o clusters C p and C q is computed as the a v erage distance betw een an y pair of nodes ( i, j ) suc h that i ∈ C p and j ∈ C q . This policy is also kno wn as aver age linkage . See Sect. 4.2 in Ref.[11] for details. [32] I. V. Basaw a, T. A. Green, W. P . McCormick, and R. L. T aylor, Commun. Stat.-The ory Metho ds 19 , 1493 (1990) [33] P . P . Sendi, H. C. Buc her, B. A. Craig, D. Pfluger, and M. Battega y , J. A c quir. Immune Defic. Syndr. Hum. R etr o- vir ol. 20 , 376 (1999) [34] A. Lancichinetti, S. F ortunato and F. Radicchi, Phys. R ev. E. 78 , 046110 (2008) [35] M. Meil˘ a, J. Multivariate Anal. 98 , 873 (2007). [36] M. E. J. Newman, Pr o c. Natl. A c ad. Sci. USA 103 , 8577 (2006). [37] W. W. Zachary , J. Anthr op ol. R es. 33, 452-473 (1977). [38] J. Duch, A. Arenas, Phys. R ev. E 72 , 027104 (2005). [39] D. Li, I. Leyv a, J.A. Almendral, I. Sendi ˜ na-Nadal, J.M. Buld ´ u, S. Havlin and S. Bo ccaletti, Phys. R ev. L ett. 101 , 168701 (2008). [40] E. Estrada, Chaos 21 , 016103 (2011). [41] C. Allefeld and S. Bialonski, Phys. R ev. E. 76 , 066207 (2007); [42] R. Sinatra, D. Condorelli, and V. Latora, Phys. R ev. L ett. 105 , 178702 (2010).
Original Paper
Loading high-quality paper...
Comments & Academic Discussion
Loading comments...
Leave a Comment