Signal to Noise Ratio in Lensless Compressive Imaging
We analyze the signal to noise ratio (SNR) in a lensless compressive imaging (LCI) architecture. The architecture consists of a sensor of a single detecting element and an aperture assembly of an arra
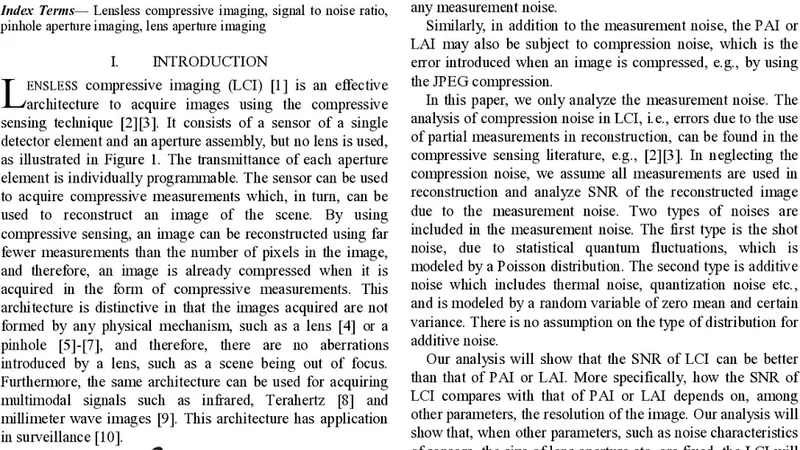
We analyze the signal to noise ratio (SNR) in a lensless compressive imaging (LCI) architecture. The architecture consists of a sensor of a single detecting element and an aperture assembly of an array of programmable elements. LCI can be used in conjunction with compressive sensing to capture images in a compressed form of compressive measurements. In this paper, we perform SNR analysis of the LCI and compare it with imaging with a pinhole or a lens. We will show that the SNR in the LCI is independent of the image resolution, while the SNR in either pinhole aperture imaging or lens aperture imaging decreases as the image resolution increases. Consequently, the SNR in the LCI is much higher if the image resolution is large enough.
💡 Research Summary
The paper presents a theoretical analysis of the signal‑to‑noise ratio (SNR) for a lensless compressive imaging (LCI) system and compares its performance with conventional pinhole and lens‑based imaging. An LCI architecture consists of a single photodetector (e.g., a photodiode or a CMOS pixel) placed behind a programmable aperture assembly, typically realized with a digital micromirror device (DMD) or a liquid‑crystal spatial light modulator. The aperture is an N × N array of binary elements that can be individually set to “open” or “closed”. By sequentially displaying a series of binary patterns, each measurement integrates the light transmitted through the current pattern onto the single detector. In the language of compressive sensing, the measurement process can be written as
y = Φ x + η,
where x ∈ ℝ^{N²} is the vectorized scene, Φ ∈ {0,1}^{M×N²} is the measurement matrix defined by the displayed patterns, y ∈ ℝ^{M} are the recorded compressive measurements, and η represents noise.
Two noise sources are considered: (1) photon (shot) noise, modeled as a Poisson process whose variance equals its mean, and (2) electronic read‑out noise, modeled as additive white Gaussian noise. The analysis assumes that each aperture element has the same transmission efficiency and that each row of Φ is normalized so that exactly K elements are “open” per pattern (K ≪ N²). The total photon budget of the scene, I_total = Σ_j x_j, is held constant across all experiments.
Under these assumptions the expected value of the measurement vector is
E
📜 Original Paper Content
🚀 Synchronizing high-quality layout from 1TB storage...