How have the Eastern European countries of the former Warsaw Pact developed since 1990? A bibliometric study
Did the demise of the Soviet Union in 1991 influence the scientific performance of the researchers in Eastern European countries? Did this historical event affect international collaboration by researchers from the Eastern European countries with tho…
Authors: Marcin Kozak, Lutz Bornmann, Loet Leydesdorff
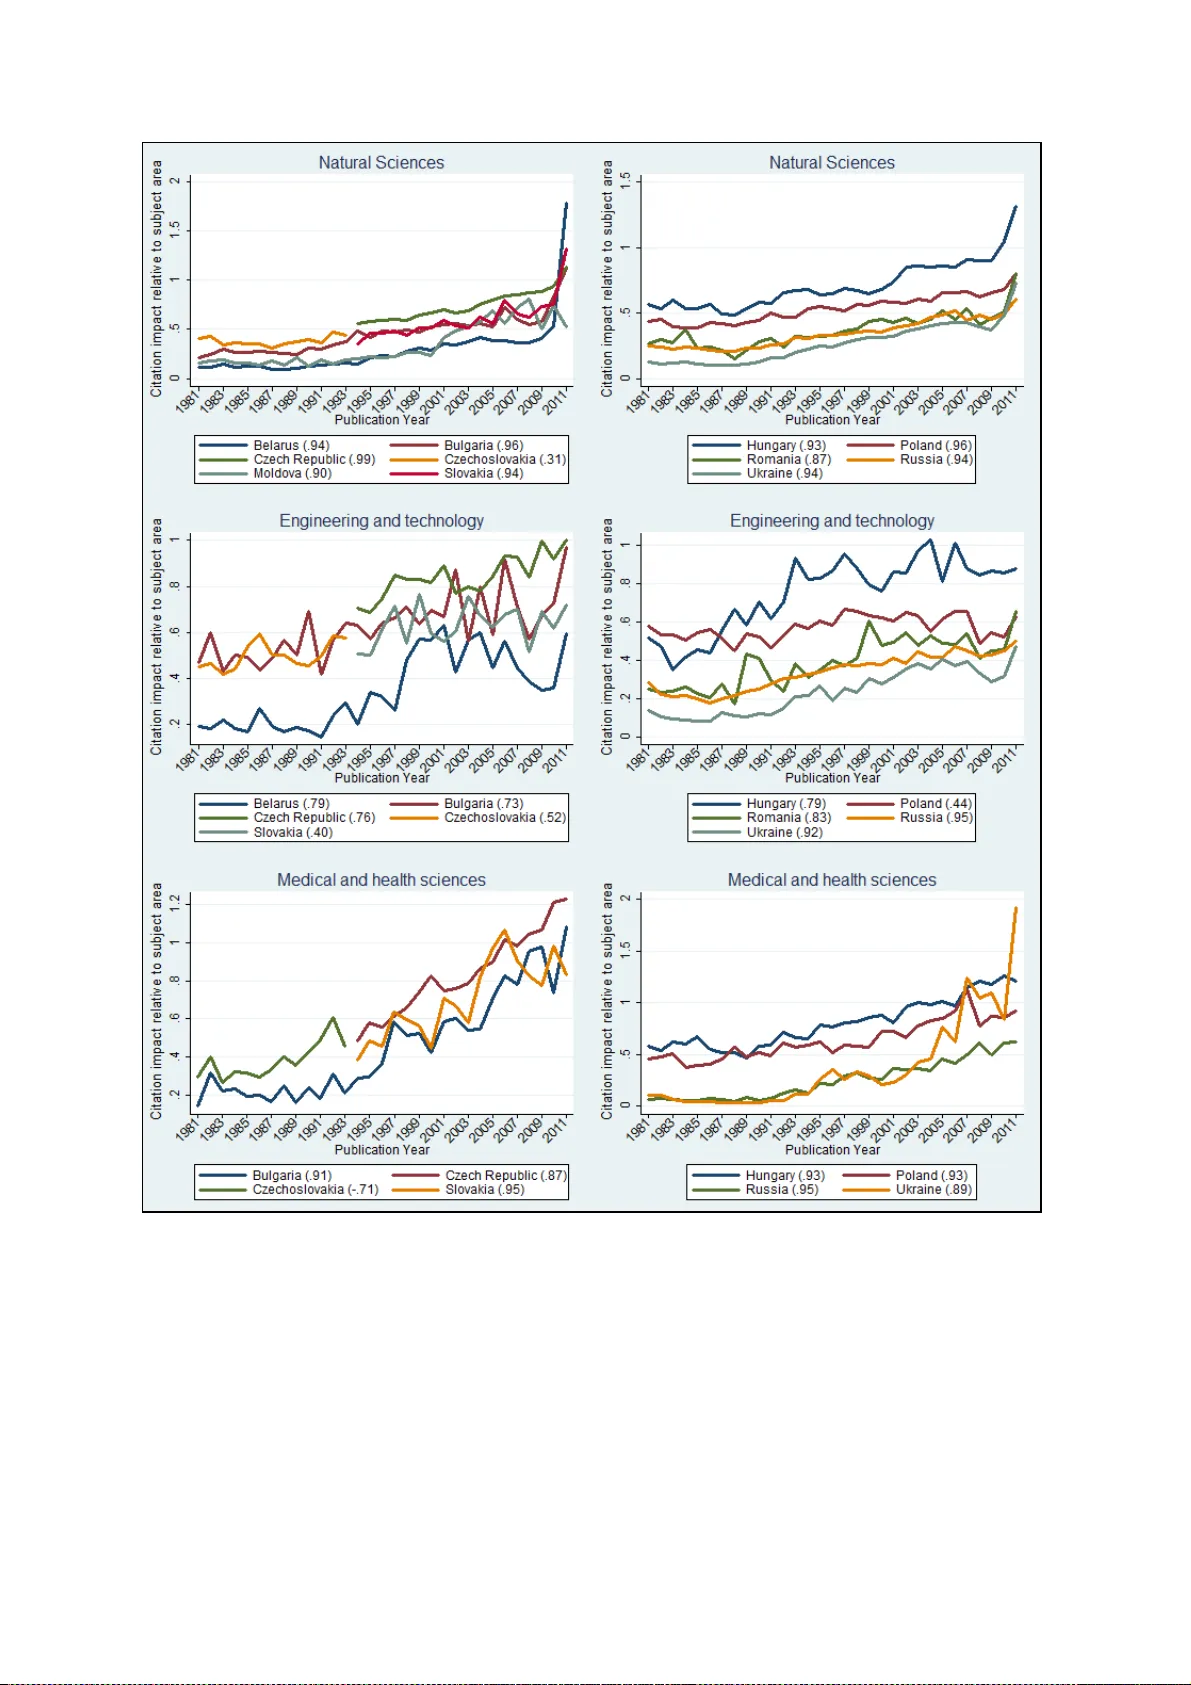
1 How ha ve the Easter n E ur ope an countr ies of t he former Wars aw Pact develop ed since 1990 ? A b ibli o metric study Marcin K ozak & , Lutz Bornm ann,* a nd Loet Le y desdorff # & Depart ment of Quan t i tat iv e Methods in Economics Fac ulty o f Eco nomi cs Unive rsi t y o f Inf or mati on Tec hnology an d Ma na ge m ent in Rz eszow Such arskiego 2, 35-225 Rzes zów, Pol and E-m ail: nyggus@gmail .co m *Divisi o n f o r Science a nd Inn ovat i on St udi es A dmin is t r at iv e Headquart ers of t he Max P l a nck S oci et y Hofgartens tr . 8 80539 Munich , Ger m any E-m ail: bor nmann@ gv. mpg.de # Universi t y o f Am sterda m , Ams t erda m Sc hool of Communication Researc h (A S CoR), Kl o venie rsburgwal 48, 1012 CX Amsterdam, The Netherl a nds E-m ail: l oet @ley d esdor ff . net *Manuscript Click here to download Manuscript: MLL_final.doc 2 Abstr act Di d t he demi se o f the Sovi et Uni o n in 1991 influenc e t he sc ientifi c per f o r mance o f t he researchers in East ern European countri es? D id this his t o ric al e ven t aff ect international coll abor ati on by researchers from t he Eastern European co untries wi th t hose o f West ern countr i es ? D id i t a l so change in t ernational co ll a borat i on a m o ng resea rc he rs f r om the Eastern European countri es? Tr yi ng to answer these quest ions, t his stud y a im s to sh ed li g ht o n in t er nat i o nal co ll abor ati on by researchers f r om the E astern European countr i es (Russ ia, Ukraine , Be larus , Mo l do va, Bulgar i a, th e Czech Republic, Hunga r y, Po l a nd, Rom ania and S l o vakia). The number of publi cat i ons and n or m a lized c i t at i o n im pact values are co m pared f o r t hes e countr i es based on InCi t es (T homs o n Reut ers), f ro m 1981 up to 2011. The in t er nat i o nal co ll abor ati on by researchers a ffi lia t ed to in st i t ut i ons in Eastern Euro pean countr i es at the t im e po in t s of 1990, 2000 an d 2011 was studi ed w i t h t he h e lp o f Paje k a nd VOSvie wer so f t ware, bas ed o n data f r o m t he Sc ienc e Ci t at i on Index ( Tho m so n Reuters) . Our resul ts show t ha t t he brea kdown o f t he comm unist regime di d not l ead, o n av erage, to a huge improvement in t he publicat i o n per f o rmance o f t he Eastern European co untri es a nd t hat t he inc rease in in t ernat i o nal co - aut horshi p r ela t i ons by the researchers affiliated to in st i t ut ion s in t he se countri es was smaller t han expected. M ost of the East ern European countri e s are st ill subj e ct to changes a nd are still await ing thei r boo st in s c ien t ifi c devel o p ment. K ey wor ds Nor m a lized ci t at i o n impac t; nat i o nal co m par ison; InCi t es ; Warsaw pact ; co - au thor shi p 3 1 I n troduction “ For decades, the field of science and techno l o g y in Bu lgaria exi sted as a s ys t em based on imm ora li t y , a vidi t y , u nscrupul o us ness, and poli t ical maneuvering. Lin ks betwee n scienc e a nd in du st ry were broken. The m a in reasons were t he f euda l struct ure in science a nd t ech no l og y […] and the ch aos in t he producti on system . ” T hese stri k ing ly dramati c wo rds, wr i tt en 20 y ears ago by Denchev (1993 , p. 57), describ e t he si t uat i o n in the science an d t ech no l og y syste m in Bu lga r ia, but o ne can ascribe t hem t o t he sci ence sys te ms in a ll t he Eastern Euro pean (EE) countri e s bef o r e t he 1990s. The probl e ms listed by Denchev (1993) were a m o ng t he m a in rea sons f or sci ent ifi c st agnati o n in t he EE countrie s. The negat iv e infl u e nce of the So vi et Uni on (e. g., wi t h i t s centra lly p lanned eco nomy a nd inflexible structur es) on sci ent ifi c devel o p ments in i t s m ember states as well as i ts a lli es in t he Warsa w pact was l arge. S in ce t he breakdown o f t he comm u nist r egim e s in t he ear ly 1990s, however, t he research a nd devel op ment sector in EE countrie s has h ad m o re t han 20 y e ars to recover an d de vel o p. The li t erat ure about sci e nt ifi c devel op ments in t he EE countri e s pro vi des a pess imi st ic vie w. I t poin t s o ut t hat research in EE countries ha s ha d t o fac e many pr oblems, resul t in g in rat he r poor sci ent ifi c per for m a nce, especially dur in g t he y ear s aro und the b r eakdown of the comm unist regim e s (e.g. Egorov 2002; Yego rov 2 009). Of cour se, there were som e ex cept i o ns in the form o f im po rtant sci entific de vel o p men t s, but t hey c a nnot chan g e t he gen eral p icture of poor sc i e nt if ic per f or man ce. Because of the i so la t ion of EE co untri es from W est ern countr i es bac k in t he co mm u nist tim es, res earchers fro m t hese countri es ro utin ely publish ed in j our nal s t ha t were not in de xed in t he W e b o f Sci ence (WoS, Thom so n Re ut ers) , an d accor dingly t he number of papers publi shed in in t ernat i o nal j o urnals was rat her sm a ll . The isolati o n fro m ins t ituti o ns and researchers in W est ern countr i es resul t ed in infrequent coll abor ati ons with author s in t hes e countr i e s (see also Uzun 2002; Teo dorescu and An dr ei 4 2011). Af ter t he f all o f t he comm u nist r egim e, howev er, in ter na t ional co ll a borat i o n ne t works coul d have been w i de ned to ot he r (sci e nt if ically much stro nger) coun tri e s. Internati o na l co -aut horshi p re l at i o n s — especially w i t h countr i e s such as the USA — inc reases visi bil i t y o f resea rc h, thereby improving t he ci t at i on impac t (see Schm o c h & Sch ubert 2008; G l ä nzel, Schube rt & Czerwon 1999; Lancho-Barrantes, Guerrero- B ot e & Moya-Anegón 2013). F o r ex am ple, T eodorescu & An dre i ( 2011) not ed an i nc rease in in t er nat i o nal co ll abor ati on a f t er 1989 for Bul gar ia, t he Cze ch Republic and S l o vakia, Hun gar y , Po l a nd, and Ro m a nia. They also show that f o r EE countri es, in t ernat i o nally co - author ed papers are on av erage cited m o re t han tw ice as o f ten as those wi thout such coll abor ati on; f or Rom a nia this factor i s e ven three tim e s m o re o f t en. Resea rchers f r om EE countr i es co llab or ate m a inly wi t h Ger m a ny and t he USA. Ho wever, Teodorescu & An dr ei (2011) al so sh o wed t hat t he dem ise o f t he co mm unist r egim e in var i o us EE countri e s did not strongly a ffe ct i nter na t ional co - aut hors hip rel at i ons among resea rc he rs f r o m EE countri es. In thi s stud y , we analy se the publicat i o n devel op ment over the l ast 30 y ears o f a ll t he EE coun tri e s. We f o ll o w t he classifica t ion of t he Uni t ed Nat i o ns Statistics Divi s i o n (http://unstat s . un.or g/un sd/default.ht m), which devel oped groupin gs o f countri es and areas, in select in g t he EE co un t ri es. Am o ng t hem are t hose which bel o nged to t he USSR — that is , Russi a, Ukra in e, Belarus and Mo l do va — and in dep en dent countries t hat were par t of t he W arsaw Pact : Bul gar ia, t he Czec h Re public, Hun gar y, Polan d, Ro m a nia a nd Slova kia. Table 1 summa r ises thei r respect iv e si tuat i ons and po li t ica l stat us. We she d li g ht on the in t erna t i o nal co ll a borat i o n o f researchers f ro m t he EE countri es o ver tim e us ing advance d bibli o me t r i c t ech niques: which de vel o p ments are visible at three t im e po in t s (1990, 2000, and 2011) sin ce t he breakdown of t he comm u nist r egim e s? Furtherm o r e, we co m pare t he number o f publica t ion s and norm a lized ci t at i on im pact values cal culated for t he EE countri es ( li st ed in Table 1) durin g t he peri o d bef o re, d uri ng, and after the breakdown . 5 The In Ci te s too l (T homs o n Reuters) o ff ers a unique o ppor tunit y to c onduct bibli o metri c stud ies of the EE co untri es because i t a ll ow s us to ( i ) use a l o ng public at i on win dow (1981 to 2011), (ii ) co ntains categor ie s for diff erentiati on a m o ng b r o ad subject ar eas, an d ( iii ) i s sui t ed for t he use of stat i st i ca l pro cedures in o rder to obtain a n in s ight f ul investi gat i o n o f national c i t at i o n t rends acro ss the ye ars. Using t he bibli o metric dat a, we woul d li ke t o ans wer t he foll o w in g r esearch questions re l at ed to the breakdown of the comm unist regim e: 1. Di d t he brea kdown o f t he comm u nist r egime infl uence t he publi c at ion perf o r man ce ( in t erm s o f number of public at i ons as we ll as ci tat i on im pact re l at iv e to t he w or l d average ) of resea rc he rs in ins titut i o ns w i t h E astern European addresses? 2. Di d t he his t o r i ca l events a ff e ct in t ernat i o nal co llabor a t i o n by researchers fro m t he East e rn European countri es w i t h t hose of t he Western countr i es? 3. Di d t hese e ven t s a ff ect in t ernat i o nal co llab or ati on a m o ng researche rs f r o m the Eastern Euro pean countri e s? 2 Metho ds 2.1 Devel op ments ac ross time using citation and publ icat ion dat a fr om InCites InCi t es (Tho m son Reuters; htt p://i nci t es.thomsonreuters.com /) i s a web - based resea rc h ev aluat i o n t oo l a ll o wing assess men t o f t he productivi t y and citat ion im pact o f in st i t ut i ons and countr i es. T he g l o ba l co m parisons m o du l e pro vi de s c i t at i o n m et r i c s f ro m WoS f o r t he ev aluat i o n o f research out put of ins t i t ut i o ns and countries. The me t r i cs are ge nerated from a dataset of several milli o n W oS papers f ro m 1981 to 2011. T he m et rics for country -specif ic com par is o ns are ba sed o n address cri teria using t he wh o le -co untin g method: a ll t he addresses attr ib ut ed to the papers are counted an d co unts are not weighted by numbers o f author s or numbe rs o f addresses. 6 Country-spe cif ic metri cs can be downl oaded as a nati onal co mpa r is on repo rt in Excel f o r m at. As a subject area schem e f o r t hi s st ud y , t he m ain catego ries for j our nals o f t he Organis at i on f o r Economi c Co -o perati on and Devel o p ment (2007) (OECD) were used. InCi t es pro vi d es six furt he r schemes, e.g. t he 22 su bject areas provi d ed by Tho m so n Reuters in t he Esse ntial Sc ienc e I ndicators. A concordan ce t able between t he OECD cat egori es a nd t he WoS subjec t categori e s is a ls o provi ded (at htt p://i nc i t es. isiknowle dge.co m/comm o n/help/h_fie l d_cat egor y _o ecd.ht ml) . As against the ot he r schem es, t he OECD schem e all o w s f o r t he use of six bro ad subj ect areas for WoS da ta: (1) na tur al sc ien ces, ( 2) en gineering and techno l o gy , (3) m ed ical and heal t h sciences, (4) agr i cu l t ura l sc ience s, (5) soci al sciences, and (6) hum ani t ies. Each subjec t area incor porates sub o r dina te fi e lds. Since bibli o metr i c t rend an a lyses requ i res sufficient publicat i o n numbe r s f o r each co untr y in each publication year, we co nsi dered o nl y the t hree m ain subject areas: (i ) na tur al sci ences, ( ii ) engineering and techno l o g y , and (iii ) medical a nd heal t h scienc es. Us in g t hese t hree subj ect areas, the countr y dat a (In C i t e s TM Tho m son Reuters 2012) were do wnl o aded as an Exc el sheet and im po rt ed in to St a t a (S t a taCorp. 2013) for stati st i ca l an alys is . Accordin g to Marsh a ll & Travis (2011) and Adams (2010), Thomson Reuters cal cu lates t he m ean ci tat i o n rat e for a c ountr y’ s set of publi c at i o ns and then d ivide s t his ci tat i on score by t he mean o f all t he publications ( in t ha t subj e ct area). A v a lue of 1 for a specifi c countr y ( in a specifi c subject area) in d icates t ha t t he ci tat io n im p act of papers publish ed by scient i sts in t his country is t he same as t he worl dw ide average im p act of papers ( in t hi s subject area). For exam p le, if t he nor m a lized value adds up to 1.2, the correspondin g papers were cited on av erage 20 percentage po ints above t he average (in the subj e ct area). Al t hough the divisi o n o f mean s does not provi de a pro per st atis t ic (Opt hof & Leydesdorff 2010; Gin gr as & Lar iviè re 2011), i t can be consi der ed to use the se n or m a lize d c i t at i o n impac t val ues at t he hi gh level o f aggregat i o n o f countr i es (base d o n seve ral hundreds of publica t ion s). 7 Spear m a n’s ran k -o rder c oefficient (r s ) for the correlat i o n between publicati o n yea r a nd t he numbers of publi cat i o ns as well a s c i t at i o n impact are cal culated f o r each co untry (Bor nm a nn & Leydesdo rff 201 3 ; Sheskin 2007). The coe ff ici ents suppo rt t he in t erpr etation o f t he trend resul t s bey o nd visual inspect i o n o f t he curves : a po s i t ive coefficien t indicates an inc reas in g t rend in t he countr y ’s c i t at i on impact or publi c at i o n o utput, respectiv ely, acro ss t he publica t ion years, while a n egat iv e coe fficien t sh o ws a decreasin g t r end. To m easure the va r iabili t y o f ci t at i on im pa ct val ue s acro ss the publi cat i o n years, t he stan dard deviati o n (SD) is calculated in the time series for each country a nd e ach subject area ( see Tabl e 2). Thi s standard devi at i on in d icat es the extent o f deviat i o ns f r o m t he m ea n o f a co untry ’ s citation impac ts acro ss all publicat i on y e ars. A re l at iv e ly small standard devi at i on, for exam p le, indic ates t hat t he se im pact val u es do not devi at e fro m t he m ea n across all years to a l arge ex tent. Wh at sh o u l d be n o t ed here are m ethodo l og i cal concerns related to the da t abases used. InCi t es pro vi d es numbers b ot h f o r the USSR states separately as well as t he USSR al t o gether (a ll being included wi thin fi gures f o r t he USSR) un t il t he beginning of the 1990s . We decided to show the productivi t y and citation impact numbers f o r t he m e mber stat es separately , but incl uded t he USSR in the co -authorshi p re l at i o ns. For t hi s r eason, inf o r m at i o n a bout numbe r of publi cat i ons and ci t at i on im pact r ela tive to wor ld f o r Russia i s visible f o r 1990 in Fi gures 1 an d 2, but Russi a ’s co ll aborat i on networ k i s not visibl e for 1990 in Figures 3 an d 4. 2.2 Co -auth or ship rel ations with author s from other countr ies For the analys es o f co -authorshi p re lat i o ns, we use t he CD- Rom /DVD ve rsi o ns o f the Scien ce Ci t at i on Index (SCI). This v er si o n is not “Expan ded” li ke t he W o S ve rsi on o f t he Scien ce Ci t at i on Index-E xpanded (SCI-E ), but can be conside red as t he m o st poli cy-re levan t se t . It include s the m o st eli te a nd highly-c i t ed re f er eed j our nal s. The CD -Ro m /D VD versi o ns are, for exam p le, used f o r the Sci ence and Engineer in g Indica t ors serie s of the Nat i onal 8 Scien ce Board of the USA (Nati o nal Sc ien ce Board, 2012). In 2011, 3,744 j o ur n a ls were incl uded in SCI as against 8,336 journals in SCI - E. Data for t he y e ars 1990, 2000, and 2011 were downl oaded a nd organised in a re l at i o nal data bas e (see T able 3). Co-authorshi p re lati o ns am o ng countr i e s are co unted on the basis o f in t eger countin g, but o nly o nc e. In ot her w or ds, i f a paper co ntains 3 addresses in countr y A and 2 in co untry B, t hi s is considered as a s in g le co -authorshi p re l at i o n (and not as six ) . The asymme t ri c a l ( 2- m o de) matr ix o f docu m e nts versus countr y names is transf o r me d in t o a symm etr ic al co -authorshi p matrix using Pa jek v3. A detail ed analysis o f t he gl o bal ne two rk in 2011 is pro vi ded by Leydesdorff, Wa gner, P ark & Adam s (2013); see also Leydes do r ff & Wagner (2008) and W agner & Leydesdorff (2005 ). The mem bers o f t he EE countr i es were assigned (w i t hin Pa jek) to a fi r st parti t ion ; t he ten m o st pro lif ic co untr i es in each y ear (o n the basi s o f bot h in t eger and fract i o na l count in g) were assi gned t o a second part i t i o n (e. g. Germany , UK, a nd t he USA ) . (All o ther co untri e s wo rl dwide were categorised in t o a t hi rd part i t i o n, which was not f ur t he r considered in t his study). Both parti t i ons enable us to draw t hree m ap s (for t he three y ears) of the EE na tions and t hree m or e in re lati o n to t en le ading scient ifi c nat i ons at global leve l . S ix map for m at s are then e xported to VOSviewer . VOSvie wer maps are b ased o n runnin g mapping a nd clus ter in g al gor i t hms wi thin VOS viewer (van Eck & W a l t man 2010) . In the an alyses o f t he co - au t horshi p re lati ons, Bel a rus is not prese nt in any year be cause i t s co - authorshi p r elat i ons w i t h t he ot her countr i es were negligible. The Ger m a n Dem ocrat i c Republic ( GDR ) and USSR are o nly p resen t in 1990, becaus e t he se names were ab andoned a f t er 1991. Al t hough the GDR is not clas sified by t he Uni t ed Nat i o ns Stat i st i cs Divisi o n as a n EE country , we incl uded i t in t o the analyses o f t he co-authorshi p re lat i o ns. T he reason i s t he im po rt ant posi t i o n o f t hi s co untry in t he co - aut hors hip n et wo rk of t he EE countr i es. 9 3 Results Figure 1 shows the numbers of publi cat i o ns and ci t at i on im pa ct s cal culated r el at iv e ly to the wor l d av erages for t he 11 EE countri es across t he y ears 1981 -2011. Fi gure 2 sh o ws t he ir nor m alized ci tat i on impact in t he three subject areas (natural sciences, enginee r ing and t ech no l og y , and me dical and health sciences ). Table 2 summarises t h e visualised resul t s f or t he subje ct areas an d co untri e s. I n b o t h fi gur es , Spear m an’s ra nk -or der c o efficien t f or the corre l at i o n b etwee n publicat i o n year and the n umbers o f publi cat i o ns or ci t at i o n im pa ct s, respectively , is g iv e n f o r each co untry . Two poin ts shou l d be co nsi dered in t he in t erpret ation of t he c i t at i o n impact resul t s: (1) la rger c i t at i on im pa ct diff ere nces be tween two f o llowin g years for one countr y ca n b e t he effect of fe wer papers rather t han of significant perf or m a nce d if fere nces; and ( 2) t he l o nger t he c i t at i o n win dow, the more reli able t he perf or man c e estim at i on f o r a paper i s (Researc h Evaluat i o n an d Po li c y Pro ject 2005). There f or e, the m o st recent publi cat i o n ye ars in t he figures should b e interpret ed wi t h care (see, f o r exam p le, t he v er y high nor m a lized ci t at i on impac t value for Be l arus in Fi gure 1 ). As the resul t s in Fi gure 1 show , t he re has been an inc reas ing t rend in t he number of publica t ion s linked to t he Czec h Republic a nd Polan d, and t o a m uch smaller exten t, to S l o vakia, Bul gar ia, Romani a, a nd Hungar y . T h ese co untri es accessed t he EU in 2004 and 2007. For Ukrain e, a not i ceable decrease in t he n u mber o f publicat i o ns w as o bse r ved in t he ye ars 1991-1993; since t his t im e, t he n u mb er o f pu blicat i o ns has not yet reach ed t he l e vel o f t he 1980s . The ci t at i o n im p act of the EE countri e s is smalle r t han the wor l d average (which is represen t ed by t he value o f 1), both for sci e nc e in gene ral (Figure 1 , Tabl e 2 ) and f o r t he diff erent subj ect ar eas consi d ered (Figure 2, T abl e 2) . However, an increasi ng t rend coul d be observ ed f o r t he ci tat i o n impact rel at iv e t o t he worl d f o r all t he EE countri es (F igure 1) , 10 sugges t ing that in sev era l years at l ea st som e o f the EE countri es can be expected to hav e a ci tat i on im pa ct l arger t han t he wor l d average. Two such ve r y pro mi s ing countri es are t he Czech Re public a nd Hun gar y , which ha ve a l r ead y reach ed t he average l e vel f or t he worl d. The countr y w i t h t he l arge st numb er o f papers, Russia, has l o w norm a lized citat i on impac t values , o nly in recent y ears appro aching the v alue of 0.5 (that i s, t w o t im es be l o w t he wor l d average); t his resul t refers to sci e nce in genera l as we ll as t he subjec t areas co nsi dered (Fi gur e 2). Mo l do va ill ust rat es the opposi t e: a very sm a ll co untr y (between 3 and 4 mil lion inhabi t ant s) w i t h a sm all number of publicat i o ns (Figure 1), durin g the l a st 10 y ears i t s nor m a li z ed c i t at i o n impact rel at iv e t o the worl d increased to t he v al ue o f aro und 0.6-0.8. Still bel o w t he average, t h is resu l t is not i cea ble, especially in the light of t he small er nor m a lized ci tat i on im pa ct s of Ro m a nia and Belarus, and similar c i t at i on im p act s o f Bulga r ia, Po l a nd and S l o vakia. Figures 3a- c show t he co-authorshi p re lat i o ns am o ng researchers f ro m t he EE countr i es. T he darker an d t he wi der t he edge, t he cl os er t he coll a borat i o n is am o ng t he researchers f ro m t he countr i e s shown . (Hereaf t er, whereve r we r efer to “c o llab or ation” be twee n authors, we m ea n “co ll a borat i o n t ha t ends up wi th a co mm o n art i c le in a j o ur nal index ed in WoS. ) The edges are co m para ble wi t hin a nd between t he f igures (Fi gure 4 incl uded). In 1990, the cl osest co - authorshi p re lati on wa s between t he USSR and Czechosl o vakia, a nd b et ween t he USSR an d t he GDR . There was al so qu i t e noti ce able coll abor ati on betwee n the USSR and Polan d as we ll as t he USSR and Bul gar ia . The coll abor ati on o f USSR researchers wi t h the n on-EE countri es was l e ss im po rt ant tha n that wi t h coll e agues f r o m the other EE cou ntri es, which is obvi ou s g iv e n t he po li t ical ci rcumstances in E astern Euro pe in 1990 (see above). There was, however, hardly any coll abor ati on betwee n resea rchers f ro m Hungar y and t he USSR, or between Hungar i an and Rom anian researchers. 11 In 2000, the lev el o f in t ernat i onal co - authorship relati o ns by t he EE co untri es had not ch anged, but its structure had. I n Fi gures 3 b-c and 4b-c (so af t er 1991), t he USSR i s represen t ed by Russ ia, Ukra in e , and Mo l dova. As in t he USSR, Russi a n sc ien t is t s coll abor ated cl o sely w i t h collea gues f ro m the ot her EE c ountries , especially Po l a nd and Ukraine , but als o t he Czech Republic. There was hard ly any co ll a borat i o n between S l o vakian an d Russia n resea rchers. In 1990 Hungarian scientis t s scarcely co ll aborated wi t h t he USSR’ s, an d in 2000 t hey scarcely collab or at ed wi t h t hose in Russ ia; t hi s changed in 2011, when an inc rease in t his coll aborat i on was o bse r ve d. The l evel o f in t er na t ion al co -aut horshi p re l at i o ns am o ng sci ent i sts o f t he EE countri e s si g nif ican t ly increased in 2011. Russia st ill made the bigges t co ntri but i on to this coll abor ati on: its scientists continue d to coll a borate with Pol and, Ukra in e, t he Czech Republi c, a nd Hun gary. But in two other countri es , t he level o f in ternat i onal co llab or ati o n wi t h other EE countri es increased: Po l a nd (wh ose r esearche rs also coll a borat ed cl o se ly w i t h Russi a, t he Czech Republic an d Ukra ine, b ut als o qu i t e c l ose ly w i th Hu ngary a nd Rom ania) an d t he Czech Republic ( m ainly w i t h Polan d, Russia, S l o vakia, but also qui te cl ose ly with Hun gar y). Co ll a borat i o n between researchers from Rom a nia and Hun gar y, an d f r o m Russia an d Bulgar ia was negligibl e ( and is not represen t ed in the Figures 3c a nd 4c). Tak in g non-EE countri es also in t o acco unt, res earch ers fro m m o st of t he EE countri e s m o st ly co ll a borated wi t h author s in t he USA (Figure 4a- c) , parti cu larly Russia, Po l a nd, and Hun gar y . Co llab or at i o n between the EE rese arch er s and t hei r UK co lle agues was m uc h weaker t ha n w i t h t hose f ro m t he USA , which – as the leading scient if ic count r y – i s t he m ost in t erest ing co ll a borati on part ner f o r a ll na t ions . Anot her im po rt ant c ount ry in terms of scientifi c co ll abor ati on w i t h researchers f ro m t he EE countri es in 2000 and 2011 was Germany , as coul d be obse r ved es pecially for t he Czech Republic, Po l a nd, Sl o vak ia, but also f o r Rom ania and Bulgar ia (Fi gure 4 b- c). 12 Coll aborat i on a m o ng researchers f ro m t he EE and Western co untri es seems to be simil ar in 1990, 2000 and 2011 (Fi gures 4a- c). Take Rus sia: i t s co ll a borat i o n w i t h t he USA was m or e effi cient (in terms of n u mber o f co - au t hored papers ) in 2000 t han t hat be t ween USSR and USA in 1990, but t hen again , i t was le ss in 2011 t han in 2000. Russia’s coll abor ati on w i th t he UK in 2000 was s imil ar to th at in 2011, but both were sli ghtly stro nger t ha n t hat between t he USSR and t he UK in 1990. Polan d’s co ll a borat i o n w i t h t he USA in 2000 and 2011 was sli g ht ly st ronger than t hat in 1990, but one mi g ht expect a grea t er diff erence. Thes e are j ust t wo exam p les, but clearly no boo s t o f in t ernat i o nal co llab or ation was observed for any o f t he present EE c ount ri es – rather a small increase o r ev e n a l ack of any not i ceable c han ge. Al t hough the number of publi cat i o ns by aut hors f r o m Russia was slig htly larger in 2011 than in 2000 and citat i on im pact s were gr eater in 2011 t han in 2000 (F igure 1), co ll a borat i o n o f Russian researchers wi t h t hose f rom ot her countri e s in 2011 was le ss in t e nsi ve t han in 2000 ( Figures 4b -c). Russi a ba ses i t s science sys te m o n i ts o wn inf r ast ructure, know- how and personn e l , w i t h o nly weak co -author shi p re lat i o ns w i t h ot her countr i es. T his appro ach resu l t s in pu bli c at ion perfo rm a nce which is st able but not in creas in g : t he number of papers w i t h Russian addresses has not chang ed since 1981, and the normali z ed ci tat i on im pa ct i s one o f t he l o west am o ng the EE co untri es despite a co mm on o p ini o n that Russi an science is very stro ng. 4 Discussion Our m ain research quest i o n was w hethe r the breakdo wn of the c ommunis t reg im e affected publi cat i o n per f or m a nce in t er m s o f papers publishe d in j o ur nals indexed in WoS as well as in inter na t iona l co ll a borat i o n by researchers f ro m t he EE countri es wi t h t hose o f t he W est ern countr i es. Base d o n the li terat ure one mi g ht expect that t h e ans wer to this quest i o n sh o u l d be posit iv e. For som e o f t he EE countrie s (Bulga r ia, t he Cze ch Republi c a nd Sl ovak ia, 13 Hun gar y , Po l a nd an d Ro m ania) a n in crea se in inter na t ional co -aut horshi p re l at i o ns was observ ed after 1989 (Teodorescu & A ndrei 2011). The pos i t ive answer might als o be sugges t ed by co mm o n know l edge o f the recent histo ry and socie ta l de vel o pment in t he EE countr i es after t he break down of the comm unist regime . Take Pol and, f or exam p le: opening i t s borders to the W est ern countries ga ve r i s e to quic k econo mic de vel o p men t, bu t als o condi t i o ns for scien t ifi c devel o p ment improved. Coll aborat i ons w i t h Western colleagues start ed to b e accepted ( if not wel co med) by universi t y author i t ies , universi t ies ga in ed much m o re auto nomy fro m t he go v ernment, acces s to We stern li t erat ure was acqui red, o ffi c ial but ill o g ic al a nd quasi - scient if ic ideas an d parad igms (such as t ha t of ly s enko i sm; Gra ham 1974) d i d not bl o ck t he devel o p ment of scien ce, and the li ke. T he pic tur e of Po li s h sc ien ce in the last years of the twen t i eth centur y wa s co m p lete ly d ifferent f ro m t hat during the 1980s. The si t uat i o n o f f o rm er USSR st at es was m uc h m o r e compl e x and difficul t t ha n t hat of Po l a nd. Wh en t hey beca me in d ependent, they a ls o l o st suppo rt f ro m t he USSR, which actually was t he main source o f kn o w l edge a nd f u nd ing f or sci ence and techno l o g y . Fast decentrali sat i o n wit hout an appropri at e p l a n can be dange ro us, caus in g t he who l e sc ien t ifi c system to be crushe d. Pract i ca lly a ll for m er So vi et countr i es suffered from a decrease in funds f o r research and de vel o p men t , som e of which (e.g. Georgia) were dram at i c (Yego rov 2009). For these reasons , science de vel o p ment in t he f or mer USSR states st udi ed in t his paper (Ukraine, Bel ar us and Mo l do va) was sl ower t ha n that in the other EE countri es, includin g a sl o wer devel o pment o f a network o f in t ernati ona l co llab or ators wi t h t he Wes t ern countries wi t h strong scientifi c o utput. In sum , po li t ical o pening of borders between the EE and Western co untri es might inde ed lead to an increas e in in t er na t ional co ll a borat i o n a m o ng researche rs f r o m t he EE and W est ern countr i es. However, this mi g ht be acco mpani ed by de creased in t ernat i ona l coll abor ati on a m o ng t he resea rchers f ro m t he EE countr i es. Our li ne o f thinking was as 14 f o ll o ws: dur in g t he So vi et period, r esearch ers f ro m the EE countri es co ul d co ll aborat e wi t h researchers f ro m t he ot he r E E coun tr i e s, and in many si t uat i o ns co - authorship rel at i o ns w i t h Russi a was even expected. T hus , whil e in t er nat i o na l co ll a borati o n w i t h ot her (especi a lly W est ern) countri e s was hindered and in many cases even impossibl e, in t er na t ion al coll abor ati on a m o ng t he EE countrie s in t he f or mer Warsaw Pact was possibl e and so m et im es f o rced. The drasti c change in t he poli t ical si tuat i on w hich a ll t he EE c ountri e s underwent a f ter t he breakdown of t he comm u nist r egim e might have g iv e n r i se t o a chan g e in sci ent ifi c coll abor ati on patt erns: wha t was so dif ficul t and even f o rbidden bef o re ab andoning t he comm unist rul e was now a ll o wed (a l t hough st ill not necessarily simple). Wh at i s m o re, one kne w t hat the W e st ern scien t is t s pro duced m o re papers, whi c h were m o re frequent ly c i t ed, an d so m a ny researc he rs might have been willing to f o ll ow t he W e stern standards instead o f t he Sovi et ones. All t he se fa cts suggested t h at in t ernat i o nal co - au t horshi p re lat i o ns a m o ng researchers f ro m t he EE and Western co untri es s hou l d ha ve in crea sed, while among researchers f ro m t he EE countr i es t hat was not nece ssa r ily t he case. From o ur r esearch i t does n ot neces sarily f o llow t hat answe r in g t he resea rc h ques t i ons f o r m ulated at the en d o f t he in t r oduction sect i on is sim p le: t he si t uat i o n is m o re complex a nd countr y -spec ific. The number of papers publi s hed by re searchers affiliated to ins t i t ut i o ns l o cated in m ost of the EE countri es d id not in cr ease; signifi c a nt in creases were o bs er ved f o r t w o co untri es o nly – t he Cze ch Republi c a nd Poland. For som e o f t he ot her c ountr i es (such as S l o vakia and Romania) not i cea ble chan ges have been observed o nly recent ly (dur in g t he recen t 5-7 y ears). Escapin g co mm u nist r ul e d i d not seem to ha v e t oo great an im pa ct on t he scientifi c per f o r man ce in these countr i e s. For Ukr ai ne t he si t uat i o n was even th e o pposi t e – after becomi ng an in dep e nden t countr y , Ukra ini a n resea rc he rs published f ewer articles in WoS j o urnals, an d t he n u mber o f publica t ion s published recent ly has not y et reach ed t he l e vel of the 1980s. Based on a study of 15 t he three Bal t i c stat es, na m e ly Estonia, Latvia a nd Li t huania, Alli k (2013) sh owed t ha t diff erent countri e s w i t h t he same start i n g po si t ions co ul d devel o p o ver t he y ears o n com plete ly d iffe rent t raj ect o ri es – dependent o n poli c ies and decisi o ns m ade by t heir poli c y ma kers – to en d up wi t h diff erent scientific perf or manc es. Our resul t s a ls o suggest that a countr y ’s scient ifi c s ys t em a nd poli c y can affect publicat i o n pr oductivi t y . Su ffice to look at Russi a and Ukra ine, which d i d not devel o p m uch ove r t he la st 20 y e ars in t erms of publica t ion effici ency in j o ur nals indexed in WoS ev e n t hough authors from t he se two countr i es pu blish ed t he m o st papers in such j o urnals in t he 1980s. Cl ose co ll a borat i on o f t he EE countrie s wit h t he USA o bvi ou sly resul t s f r o m t he USA’s scient ific prest i g e, b ut al so f r o m t he brain dr ain in t he sci ence sector , whi c h was observ ed in t he la t e 20th centur y , as was not ed for Ukraine by Ego rov (1996, 2010). A ccord in g to the UNESCO Sci e nce Report ( 2010), of t he EE countri es Bulgaria, Mol dova an d Montenegro were still su ff er ing fro m seri ous br ain drain . Po l a nd – a l o ng w i t h India, t he UK a nd Tai wan – is considered one of the f o ur m o st im po rt ant countri es contr ib ut in g to a great in cre ase in the number of sci entists and engineers in t he USA in the 1980s (Sukhat m e 1984). Cl o se co -authorshi p re l at i o ns with Germ a ny co u l d be e xplaine d by i t s re la t ive pro xim i t y t o t he EE countri es (Bor nmann , Le y d esdo rff , Walch-So lim e na, & Ett l 2011) as well as t he earli er histo ry o f Ger many: East Germany ( GD R) was i t se lf under the USSR’s infl u e nce. Coll aborat i on a m o ng researchers f ro m the EE c oun t ries a f t er t he comm u nist r egim e broke down d i d not decrease. For m o st co un t r i e s the si t uat i o n was act ually t he o ppo si t e – coll abor ati on in creased. Russia is an example; i t s li g ht ly increased i t s sc ien t ific co ll a borat i o n wi t h Pol a nd, Hungar y , t he Cze ch Republi c a nd Sl ovakia, and Ro m a nia. O f cour se i t i s diffi cul t to com pare t he se pheno m e na in 1990 a nd in later y ears, s ince the Rus sian netwo rk of in t er nat i o nal co ll a borat i o n was d iff erent f r om that of t he USSR, especi ally w i t h t he in c lusi o n of Ukra in e, f o rmer ly a So vi et st ate. 16 Hun gar y a nd Romania are ex amples o f a d iff ere nt phen o m enon – t hei r co -authorshi p re l at i o ns wi t h t he other EE co un t ri es in creased o nly re cently (w hich can b e o bs er ved f o r 2011 as com par ed t o 1990 and 2000) . It suggests that t he po li t ical a nd soci eta l changes t he se countr i es u nde rwent have ha d a de layed effec t o n these co untri es’ scient ifi c systems. A ge ne ra l p icture o f interna t ional co ll a borat i on a mong research ers f ro m the EE countr i es is that it seems to have been boo s t ed rece n t ly , as can be seen by co mpar in g t he si t uat i on in 2000 a nd 2011. Nonethele ss, in absol ute value s inter na t i o nal co ll a borat i o n o f EE countr i es w i t h some of t he Western co untri es, m a inly US A a nd Germany , is st il l great er than t ha t wi t h t he other EE countri es. Even, Ukra in e ’s co -authorshi p re l at i o ns wi t h t he USA a re at t he sam e level as t hat wi th Russia. 17 Refe r ences A dams, J. ( 2010). Global resear ch repor t: United Kingdom . Leeds , UK: Evidence. Allik, J. (2013). Factors affect in g biblio me t ric in dicato rs of scient ifi c qua li t y . Trames , 17(67/62), 3, 199- 214. Bornmann , L., & Ley de sdor ff , L. (2013). Macro -in dicato rs of ci t at i on im pact s o f six pro li f ic countr i es: InC i t es dat a and the stati st i ca l significance o f t rends . PLoS ONE, 8( 2), e56768. doi : 10.1371/ j our nal .po ne.0056768. Den che v, S. (1993). Sci ence and technol o g y in t he New Bul gar ia. Technology in Science 15(1), 57- 63. Egorov, I. (2002). Perspec tives on t he sci ent ific systems of the post -so vi et states: a pessimis t ic view . P rometheus , 20(1), 59-73. Egorov, I. (1996). Trends in tr ansf o r mi ng R&D pot enti a l in Ru ssia and Ukrain e in t he early 1990s. Science a nd Publi c Po li c y, 23(4), 202 -214. Gin gras, Y., & Lariviè re, V. (2011). Th ere are nei t her ” k in g ” nor ” crown ” in sciento m et r i cs: Comm ents o n a supposed ” al t ernat iv e ” method o f nor m a li z at i o n. Journal of Inf ormetrics , 5 (1), 226-227. Gl änze l , W., Schub ert , A., & Cze rwo n, H. J. (1999 ) . A bibli o metr ic analysis of in t er nati ona l scientifi c coo perati on o f t he Euro pean Uni o n (1985 – 1995). Scientometrics , 45, 185 – 202. Graham , L. R. (1974). Sci e nce and phil oso phy in t he Soviet Uni o n. New Yo rk: Vi ntage Books. InCi t es TM Tho mson Reuters. ( 2012). Report created: 11.02.2013. Data process ed: Dec 31, 2011 . Data So urce : Web o f Sci e nce. T hi s dat a is repro duced under a li ce ns e f r o m Thomson Reuter s. 18 Lanch o -Barrantes, B., Guerr e ro- B ote, V. , & Moy a -Anegón, F. (2013). Ci tat i on increments be twee n coll aborat in g co untri e s. Scientometrics , 94(3), 817 -831. doi : 10.1007/s11192- 012-0797-3. Leydes do r ff , L., & Wagner, C. S. ( 2008). International co llab or ati o n in science and the f o r m at i on o f a co re gro up. Journal of Informetrics , 2 (4), 317-325. Leydes do r ff , L., Wagne r, C. S., Park, H. W., & A dams, J. (2013). Internati o nal Co llab or ation in S cience: T he G l o ba l M ap and the Network. El Profesional de la Información, 22 (1), 87- 94. Marshall , E. , & Travis , J. (2011). UK sci e nt if ic pa pers rank fi r st in c i t at i o ns. Science, 334 (6055), 443- 443. Nati onal Sc ien ce Board. (2012). Science and enginee ring indicators 2012 . A r li ngt o n, VA, USA: Nati o na l Science Foundat i on (NSB 12 - 01). Organis at i on f o r Economi c Co -o perati on and Devel o p ment. (2007). Revised field of science and technology (FOS) class if ication in the Frasc ati manual . Pari s, France: Working Part y o f Nati o nal Expert s on S ci ence and Technolo gy I ndic ato rs, Organisa t ion f or Eco nomi c Co -oper a tion and Devel o p ment (OECD). Opthof, T., & Ley desdor ff , L. (2010) . Caveats f o r the j o urnal and fi eld nor m a lizat i o ns in t he CWTS (“L eiden”) evaluat i o ns of resea rc h perf or man c e. Journal of I nfor metrics , 4 (3), 423-430. Rese arch Evaluat i o n and Po li c y Pro j ect . (2005). Quantitative indicators for rese arch assess ment – a literature review (REPP discussion paper 05/1) . Canberra, Aus tr alia: Rese arch Evaluat i o n and Po li c y Pro j ect , Rese arch Schoo l o f So cial S ciences, The A ust rali an Nat i onal U niversi t y. Schm o ch, U. , & Sch ubert, T. (2008). Are in t ernat ional co -publicati ons an indic ato r f or quali t y of scien t ifi c research? Scientometrics , 74, 361 – 377. 19 She skin, D. (2007). Handbook o f parametric and n onparametric statistical proce dures ( 4th ed.). Bo ca Ra to n, FL, USA: Ch ap man & Hall/CRC. St a t aC o rp. ( 2013). Stata statistic al sof tw are: release 1 3 . Coll ege St ati on, T X, USA: S tat a Corpor a tion. Sukha t me , S . P. (1994). The rea l brain drain . Or ient Bla ckswan. Teo doresc u, D., & A ndrei , T . (2011). The gro wth of in t ernat i o nal co llab or ation in East European schola r ly co mm unit ie s: a bibli o metr i c a na ly sis o f j our nal art i c les published be twee n 1989 and 2009. Scientometrics , 89, 711- 722. UNESCO (2010). UNESCO Sci e nce Report 2010: The Curren t Status of Sc i e nce Around t he W or l d. UNESCO. Uzun , A. (2002) . Lib r ar y a nd inf o r mat i on science research in devel o p ing countr i es a nd Eastern Euro pean countri e s: A br i e f bibli o metr i c perspective. I nternational Inf ormation & Library R eview , 34 , 21- 33. van Eck, N. J., & W a l t man, L. ( 2010). Sof t ware su rvey : VOSviewer, a com put er program f o r bibli o metri c ma pping. Scientometrics , 84(2), 523-538. doi : 10.1007/s11192-009- 0146- 3. W agner, C. S., & Ley de sdor ff , L. (2005). Net work Structur e , Self-Orga nizat i o n and t he Gro wth o f In ter na t ion al Co llab or a t i o n in Sc ience. Research P olicy, 34 (10), 1608- 1618. Yegorov, I. (2009). Post -S o viet sci e nce: Difficul t ies in t he transf o rmation o f t he R& D system s in Russia and Ukraine. Research Policy , 38, 600-609. Yegorov, I. (2010). Pr o bl ems o f Me asure ment of the Real Brain Drain in t he Post -Sovi et St a t es: t he Ukraini a n Case. In: Sc i e nce and Educati o nal Po li cies in Centr al and Eastern Euro pe , Bal ka ns, Caucasus and Bal t ic Countries. Di recto r of Publi cat i o n: Engelbert Ruoss Edi t or s: Iuli a Nechif o r, E l ena Sever in Co ll a borato rs: Gabriela Preda, Rosann a Sa ntesso, Sergi u Po rcescu (2010): 141 -145. 20 Figu re 1. Nu m be r of publicatio ns and citatio n im pac t calcula ted relativ el y to the w o rl d of 11 Easte rn Euro pean co un tri es (B elarus, Bulgaria , The Czec h Re pub lic, Cz ec h os lovakia, H ungary , Moldo va, Poland, Ro mani a, Rus sia , Slo vakia, a n d U kraine). I n pa renthese s, Spearma n’s rank -orde r co effic ient fo r the co rr elation b etw een public atio n y ear and numb er o f pub l icati ons/cita tio n impact i s gi ve n fo r eac h co untr y . A hig h co rrelation coeff icient indic ates a n inc reasing or de creasing trend. Source : InCites TM Thomso n Re ut ers (2012 ) 21 Figure 2. Ci tat i on im p act of 11 E astern European count ri es (Be larus, Bulga r ia, The Czech Republi c, Czechos l o vakia , Hungary, Mo l do va, Po lan d, Romania, Russia, S l o vakia, an d Ukraine ) ca lcula t ed rel at iv e ly to three subj ect ar eas. For each countr y , Spear m a n’s ran k -o rder coefficien t f or the correl at i o n between publi cat i o n year and citation im p act is given . A high corre l at i o n coefficien t in d icates an in crea sing o r de creasing tr en d in citat ion im pact values. So urce : InCi t es TM Tho m son Reuters (2012). In each su bject -specific grap h, o nl y countr ie s are considered wi t h at l east 1 00 publ icat i o ns in each p ublica t ion year. 22 2011 2000 1990 Figure 3. Co- au thor shi p networks of eastern Euro pean countr ies f o r t hree time po in t s . 23 2011 2011 2000 2000 1990 1990 Figure 4. Co- au thor shi p networks of eastern Euro pean countr ies and l e ad in g nat i ons at gl o bal lev el f o r three time po in t s. 24 Table 1. Summ ary o f current si t uat i on in Eastern Euro pean co untri es. EE C ountry Previ o us st atus Member of EU Member of NA TO Eco nomi c stat us (accordin g t o the W or l d Bank) Belarus Part of the USSR; sovereign since 1991 No No Dev el o p ing Mol do va Part of the USSR, s o verei gn since 1991 No No Dev el o p ing Ukraine Part of the USSR, s o verei gn since 1991 No No Dev el o p ing Russi a Part of the USSR, sin c e 1991 t he Russian Federat ion No No Dev el o p ing Bul garia Transi t i o n and accessi o n since 1989 S in ce 2007 S in ce 2004 Dev el o p ing The Czech Republi c Transi t i o n and accessi o n since 1989, in dependent since 1993* Yes, sin ce 2004 Yes, sin ce 1999 Dev el o p ed S l o vakia Formerly a part o f Czec hosl o vakia (breakdown o f t he comm unist regim e in 1989), so ve reign since 1993* Yes, sin ce 2004 Yes, sin ce 2004 Dev el o p ed Hun gar y Breakdown of the comm unist regim e in 1989 Yes, sin ce 2004 Yes, sin ce 1999 Dev el o p ed Po l a nd Breakdown of the comm unist regim e in 1989 Yes, sin ce 2004 Yes, sin ce 1999 Dev el o p ing Rom ania Breakdown of the comm unist regim e in 1989 Yes, sin ce 2007 Yes, sin ce 2004 Dev el o p ing * Czech o s l o vakia was split in t o t he Czech Republic an d S l o vakia in 1993. 25 Table 2. Minim u m, m a ximum, m ea n, and standard deviat i o n of ci t at i on im p act val ue s by subject area an d countr y ( N is t he n u mber o f pu bli c at i o n ye ars included in t he analysis). Belaru s Bulgaria The Cze ch Repu blic Czechos lo- vakia Moldov a Slo vakia Hu ngary Po land Rom ania Ru s sia Ukraine All sub ject areas N 31 31 18 13 31 18 31 31 31 31 31 Minimum 0.09 0.22 0.50 0.30 0.12 0.34 0.48 0.41 0.17 0.18 0.08 Maximum 1.62 1.15 1.19 0.44 0.81 1.18 1.33 0.82 0.81 0.64 0.78 Mean 0.29 0.47 0.75 0.34 0.34 0.59 0.73 0.56 0.39 0.33 0.25 Standa r d dev ia tion 0.28 0.21 0.19 0.04 0.22 0.20 0.22 0.11 0.14 0.12 0.16 Natu ral Sciences N 31 31 18 13 31 18 31 31 31 31 31 Minimum 0.10 0.21 0.56 0.31 0.13 0.36 0.49 0.38 0.15 0.21 0.10 Maximum 1.78 1.12 1.14 0.47 0.81 1.31 1.31 0.80 0.80 0.61 0.73 Mean 0.29 0.46 0.74 0.38 0.34 0.61 0.71 0.53 0.37 0.34 0.27 Standa r d dev ia tion 0.30 0.20 0.16 0.04 0.21 0.21 0.19 0.10 0.13 0.11 0.15 Engineering and Te chnolo gy N 31 31 18 13 18 31 31 31 31 31 Minimum 0.15 0.42 0.69 0.42 0.50 0.35 0.45 0.17 0.18 0.08 Maximum 0.63 0.97 1.00 0.60 0.77 1.03 0.67 0.66 0.50 0.47 Mean 0.35 0.63 0.84 0.50 0.63 0.75 0.57 0.39 0.34 0.23 Standa r d dev ia tion 0.16 0.14 0.09 0.06 0.08 0.19 0.06 0.13 0.09 0.12 Medica l and H ealth Sc iences N 31 18 13 18 31 31 31 31 Minimum 0.14 0.48 0.27 0.38 0.47 0.38 0.05 0.03 Maximum 1.08 1.23 0.61 1.07 1.26 1.13 0.63 1.92 Mean 0.46 0.84 0.38 0.71 0.80 0.64 0.25 0.37 Standa r d dev ia tion 0.27 0.22 0.10 0.20 0.24 0.18 0.19 0.45 26 Table 3. Data f or co- authors hip rel at i ons in 1990, 2000, an d 2011 . Data 1990 2000 2011 A rticles, review s, letters 508,941 623,111 787,001 (in cluding notes fo r 1990) * Add r esse s in t he file 908,783 1,432,401 2,101,384 A ut hors 1,866,821 3,060,436 4,660,500 In t e r nationally co-authored records 51,601 121,432 193,216 Add r esse s on inte rnationally co-author ed re cords 147,411 398,503 825,664 Journ als 3,192 3,745 3,744 Note: * Si nc e 1997, notes are no l onger in c luded a m o ng citable i t e m s in WoS.
Original Paper
Loading high-quality paper...
Comments & Academic Discussion
Loading comments...
Leave a Comment