Une representation en graphe pour lenseignement de XML
Currently, XML is a format widely used. In the context of computer science teaching, it is necessary to introduce students to this format and, especially, at its eco-system. We have developed a model to support the teaching of XML. We propose to represent an XML schema as a graph highlighting the structural characteristics of the valide documents. We present in this report different graphic elements of the model and the improvements it brings to data modeling in XML.—XML est un format actuellement tr`es utilis'e. Dans le cadre des formations en informatique, il est indispensable d’initier les 'etudiants `a ce format et, surtout, `a tout son 'eco-syst`eme. Nous avons donc mis au point un mod`ele permettant d’appuyer l’enseignement de XML. Ce mod`ele propose de repr'esenter un sch'ema XML sous la forme d’un graphe mettant en valeur les caract'eristiques structurelles des documents valides. Nous pr'esentons dans ce rapport les diff'erents 'el'ements graphique du mod`ele et les am'eliorations qu’il apporte `a la mod'elisation de donn'ees en XML.
💡 Research Summary
The paper addresses the pedagogical challenge of teaching XML schemas, which are essential for modern software development, data exchange, and web services. While XML is widely used, students often struggle to grasp the hierarchical and relational aspects of DTD, XSD, or Relax NG schemas through textual specifications alone. Existing XML schema editors (e.g., oXygen, XMLSpy) present schemas as tree structures, but they do not make the complex compositional operators—such as repetition, choice, and sequence—clearly visible, nor do they provide a dedicated graphical view for DTDs.
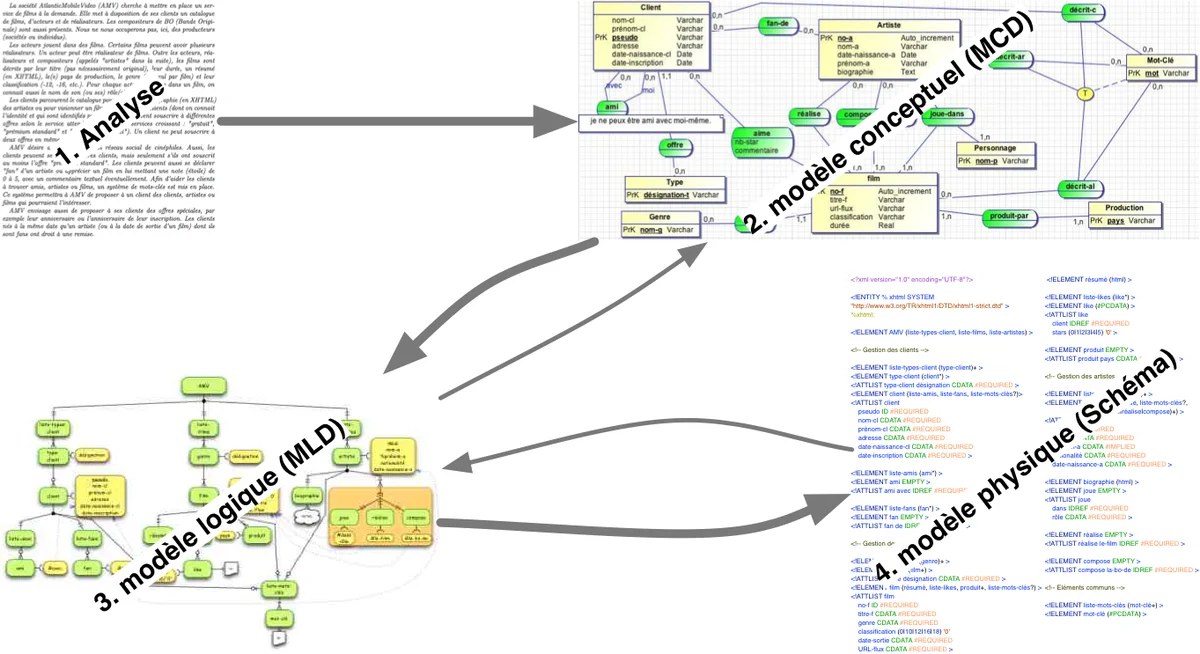
To overcome these limitations, the authors propose a graph‑based visual model that represents any XML schema (DTD, XSD, Relax NG) using a notation inspired by Crow’s Foot diagrams from relational database modeling. The model treats XML elements as graph vertices, attributes as auxiliary nodes, and the structural relationships between elements as edges. Specific visual conventions are introduced:
- Empty elements are shown as plain rectangles; elements that contain only text are displayed as white rectangles with a label indicating the text type.
- Attributes are drawn as yellow rectangles attached to their owning element, with the attribute name, data type, and occurrence constraint (e.g., #REQUIRED, #IMPLIED). ID/IDREF and ID/IDREFS relationships are annotated with dotted arrows, providing a visual cue for reference navigation that is useful when learning XPath functions like id() and idref().
- Complex content operators are represented by symbols taken from Crow’s Foot notation: “*”, “+”, and “?” are rendered as the familiar multiplicity symbols; sequences are indicated by a black dot that orders the connected nodes clockwise; alternatives are shown as a fork. Sub‑groups (nested choice or sequence constructs) are highlighted with an orange shaded region, allowing recursive grouping to be visualized without ambiguity.
- When an external schema (e.g., an imported XHTML DTD) is referenced but not expanded, a cloud‑shaped icon denotes a hidden sub‑graph, preventing the main diagram from becoming overly dense.
The authors illustrate the model with a concrete teaching example: a simplified “video‑on‑demand” service described by a DTD used in a master’s course at the University of Nantes. The example includes elements such as
A discussion section evaluates the model’s strengths and weaknesses. Strengths include: (1) enhanced visual intuition for hierarchical document structures; (2) explicit representation of reference relationships that aids understanding of XPath and API usage; (3) suitability for small‑to‑medium schemas that can fit on a single A4 page, making it a practical teaching aid. Weaknesses are acknowledged: (1) scalability issues—large schemas with many elements or deep nesting become difficult to lay out on a single page; (2) incomplete coverage of all DTD data types (e.g., NMTOKEN, NOTATION, LIST) and lack of support for general entities; (3) the graph alone does not convey detailed attribute constraints such as default values or enumerated lists.
The paper concludes that, despite these limitations, the graph‑based model provides a valuable pedagogical tool for introducing students to XML schema design, XPath navigation, and API interaction (SAX, DOM, XSLT). Future work is suggested to improve automatic layout algorithms for handling larger schemas, to extend the notation to fully support all DTD/XSD/Relax NG data types, and to integrate the visual model into interactive teaching environments.
Comments & Academic Discussion
Loading comments...
Leave a Comment