Measures of radioactivity: a tool for understanding statistical data analysis
A learning path on radioactivity in the last class of high school is presented. An introduction to radioactivity and nuclear phenomenology is followed by measurements of natural radioactivity. Background and weak sources are monitored for days or weeks. The data are analyzed in order to understand the importance of statistical analysis in modern physics.
💡 Research Summary
The paper presents a complete instructional sequence for senior‑year high‑school students that uses radioactivity measurements as a vehicle for teaching modern statistical data analysis. The curriculum is divided into four interconnected phases. First, students receive a concise yet conceptually solid introduction to nuclear phenomena, covering radioactive decay, half‑life, the three main radiation types (alpha, beta, gamma), and the relevant units (becquerel, sievert). Visual aids and simple equations are employed to make these abstract ideas accessible.
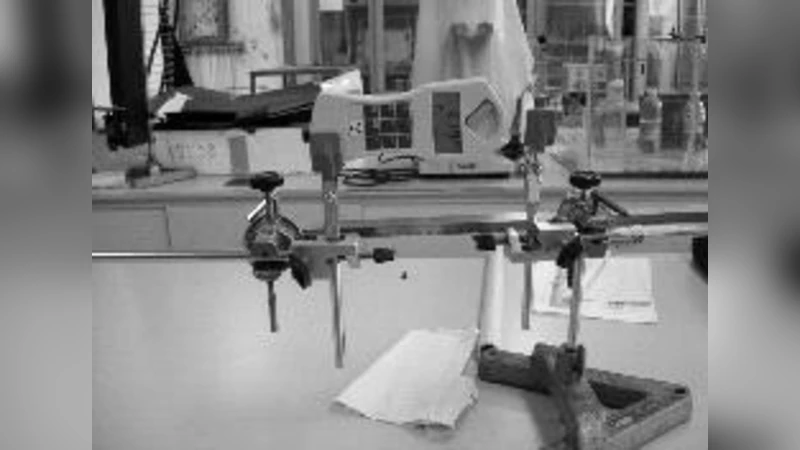
Second, the practical component introduces a low‑sensitivity Geiger‑Müller (GM) counter and a basic sample holder. Students conduct continuous counts of ambient background radiation and of deliberately placed weak sources (e.g., soil containing trace uranium or commercially available radioactive clocks). Measurements are recorded at one‑minute intervals for periods ranging from two days to two weeks, allowing students to observe natural fluctuations, diurnal patterns, and the influence of environmental conditions.
The third phase focuses on statistical treatment of the raw count data. Because radioactive decay follows a Poisson process, the mean count λ and its standard deviation √λ are calculated for each data set. Students then construct 95 % confidence intervals around the mean, perform hypothesis testing to compare different groups (indoor vs. outdoor, source present vs. absent), and decide between parametric (independent‑samples t‑test) and non‑parametric (Wilcoxon rank‑sum) procedures based on normality checks. Normality is examined using histograms and Q‑Q plots, reinforcing the idea that statistical models must be validated before application.
Data preprocessing and visualization are emphasized as essential skills. Moving‑average smoothing, cumulative‑sum plots, and heat‑maps are used to reveal underlying trends that are otherwise obscured by statistical noise. The curriculum also addresses instrumental artefacts: dead‑time correction (N_corrected = N_observed / (1 – τ·N_observed)) and environmental interferences (temperature, humidity, electromagnetic fields) are demonstrated experimentally, showing students how to correct raw measurements and appreciate the limits of their apparatus.
The final phase evaluates pedagogical impact. Pre‑ and post‑instruction questionnaires assess changes in conceptual understanding of radioactivity, statistical reasoning, and scientific inquiry attitudes. Objective tests (multiple‑choice and short‑answer) quantify learning gains. Results indicate statistically significant improvements across all metrics, with the most pronounced growth in students’ ability to formulate and test statistical hypotheses. Participants also report heightened awareness of radiation safety and a deeper appreciation for the role of quantitative analysis in scientific decision‑making.
In conclusion, the study demonstrates that a well‑structured, measurement‑driven learning path can simultaneously teach core physics content and essential statistical methods. By engaging students in authentic data collection, model fitting, hypothesis testing, and error correction, the curriculum cultivates data literacy, critical thinking, and a realistic view of experimental uncertainties. The authors argue that this integrated approach is scalable to other scientific domains, offering a template for curricula that aim to bridge theoretical knowledge with hands‑on, data‑centric inquiry.