Accurate Profiling of Microbial Communities from Massively Parallel Sequencing using Convex Optimization
We describe the Microbial Community Reconstruction ({\bf MCR}) Problem, which is fundamental for microbiome analysis. In this problem, the goal is to reconstruct the identity and frequency of species comprising a microbial community, using short sequ…
Authors: Or Zuk, Amnon Amir, Amit Zeisel
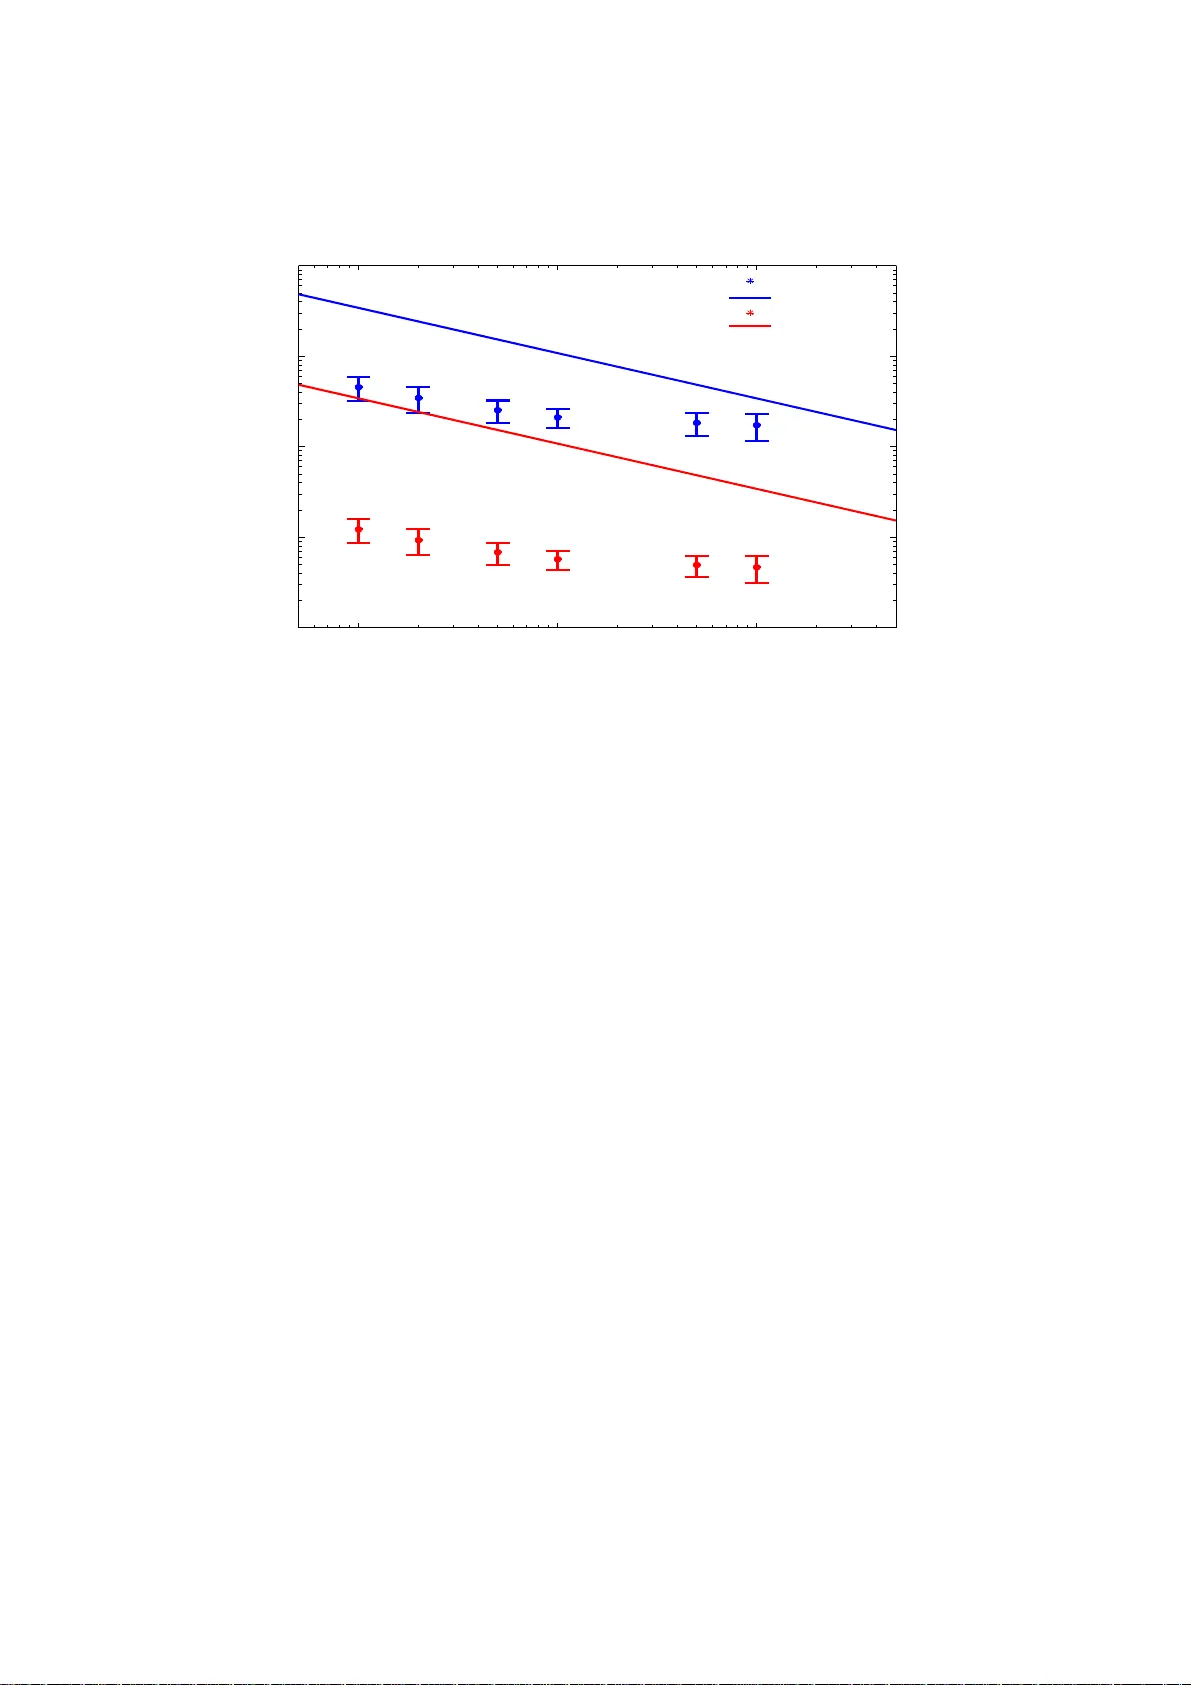
Accurate Profiling of M icrob ial Comm unities from Massiv ely P arall el Sequencing using Con v ex Optimization Or Zuk 1 , 2 , Amnon Amir 3 , Amit Zeisel 3 , Ohad Shamir 4 , and Noam Shen tal 5 1 Broad Institute of MIT and Harv ard; 2 T o yota T ec hnological Institute at Chicago 3 Department of Physics of Complex Systems, W eizmann Institute of Science 4 Microsof t Research, New England 5 Department of Computer S cience, The Open Univ ersit y of Israel Abstract. W e describ e the Microbial Communit y Reconstruction ( MCR ) Problem, which is fund a- mental for microbio me analysis. In this problem, t h e goal is to reconstruct the identity and frequency of sp ecies comprising a microbial comm unity , using short sequence reads fro m Massiv ely Par allel Sequenc- ing (MPS) data obtained for sp ecified genomic regions. W e form ulate the problem math ematically as a conv ex optimization problem and provide sufficient conditions for id enti fiability , n amely the abilit y to reconstruct sp ecies identit y and frequency correctly when th e data size ( number of reads) grow s to infinity . W e d iscuss different metrics for assessing the quality of th e reconstructed solution, including a n o vel phylogenetically-a w are metric based on th e Mahalanobis distance, and give upp er-b ounds on the reconstruction error for a fi nite num b er of reads un der different metrics. W e prop ose a scalable divide-and-conq uer algori thm for the p roblem using conv ex optimization, which enables u s to handle large p roblems (with ∼ 10 6 sp ecies). W e show using numerical sim ulations that for realisti c scenarios, where the microbial communities are sparse , our algori thm gives solutions with h igh accuracy , both in terms of obtaining accurate frequency , and in terms of species p hylog enetic resolution. Keywords: Microbial Comm unity Reconstruction, Massiv ely Parall el S equencing, Short Reads, Conv ex Optimization 1 In tro duction Character iz a tion of the micro -orga nisms present in a micro bial co mm unity is of ma jor biological a nd clinical impo rtance. Since different micro-or ganisms hav e differen t genomes, it is p oss ible to identify species base d o n their DNA sequences, using either whole-geno me sequencing, or sequencing of pr e -sp ecified r egions. The 1 6S rib osomal RNA gene (16S rRNA ) is of particular interest for identifying micro bia l communities via sequencing . It ha s bo th highly conserved regions, present in a lmo st all microbial sp ecies, together w ith v a r iable regio ns. The conser ved r egions allow sequence amplifica tio n using univ ersal PCR primers, while the v ariable reg ions provide infor mation used to distinguish betw een different s pecie s . Large databases [3, 4] with millions of 16S rRNA sequences may enable sp ecies identification b y querying se q uencing results in a database. Previous metho ds aiming to character ize microbia l c o mm unities using micro arrays [7] and Sanger sequenc- ing [2] hav e shown that, in principle, it is p ossible to iden tify sp ecies present in a sample, yet it is not clea r ho w to get a c curate estimation of sp ecies frequencie s from the analog measur e men ts provided b y these technolo- gies. Massively Parallel Seq uencing (MPS) [16], a lso known as Next-Generation Sequencing (NGS), provides high-throughput digital sequence data and ca n a llow a more detailed and accurate picture of the s pecie s in the mixture. In this method, one obta ins a larg e num ber o f short se q uence rea ds from the mixture, and the goal is to reco nstruct the iden tities and quantities of the sp ecies pres en t. Ma n y studies hav e used sho rt reads to characterize micro bia l communities [10], yet they did not demonstrate an a bilit y to identify the sp ecific sp ecies present a nd quant ify their abundance in the mixture - re liable recognition w as typically achieved only at coar s e g enus level [12]. The main drawback of MPS is the relatively short read le ng th (typically around 50-40 0 base-pair s in current technologies), which p oses a problem for specie s re construction; short rea ds do not pr ovide unam biguous ev idenc e in supp or t of the pr esence of a sp ecific specie s, a s t ypically the same read may or iginate from multiple differen t sp ecies, and cannot be uniquely a ligned to the r eference database. 2 Accurate I dentification and Profiling of Microbial Communities Recently , more so phisticated metho ds for quantifying sp ecies abundance were develop e d, for 1 6S rRNA [6, 17] a nd whole metag enome shot-gun seq uencing data [2 5]. These methods take into acco un t read-as signment ambiguit y and enable increased spec ies r esolution, but the questio n of maxima l reco ns truction reso lution achiev ed was not systematically studied. In this pap er, we study mathematically the Microbial Communit y Reconstruction problem ( MCR ) - in whic h we use MP S data to characterize a microbia l co mm unit y . In a nutshell, the computational and statistical problem we face is as follows: giv en a large co llection of short MP S re a ds (strings) sampled fr o m a known databas e of sp ecies’ sequences (longer strings) a ccording to a certain unknown distribution, our goa l is to estimate the sampling fr equencies for each sp ecies in the database, and specifically recover the suppo r t of the distribution, i.e. the list of sp ecies with non-zero sampling pr obabilities. W e mo del the sequencing proces s statistically , pro viding a proba bilistic g e nerative model for the short rea d data at hand. W e prov e conditions for identifiability - namely the ability to reco nstruct precisely the identit y and fr e quency of s pecie s prese n t in the mixture fr o m the short rea d data a s the n um b er of rea ds is increased. W e prov e upp er-b ounds on reconstructio n erro rs fo r a finite num ber of reads. W e pro po se a divide-a nd-conquer algorithm, handling large scale problems with hundreds o f thousands of sp ecies, which is particular ly app ealing for spar se microbial communities - that is , realistic scenario s wher e o nly h undreds or a few thousands of species are present in the mixture, out of the possible millions of species in the da ta base (see e.g . [5, 18]). W e study the reconstructio n per formance in these realistic settings b y sim ulating reads from the Greengenes 16S rRNA database [4]. Our goal here is to formulate a nd study the problem mathematically . Practica l c onsiderations (e.g. ampli- fication and s equencing biases, r estrictions on pr imer s, paired-end r eads) together with exper iment al r esults for real sequencing data are described in a separ ate publica tion [1]. In the s pirit o f r epro ducible research, w e hav e implement ed all of our a lgorithms in the Matlab pack a ge COMP ASS (C onv ex Optimization for Microbia l Pro filing by Aggr egating Shor t Sequence rea ds), which is freely av ailable at gith ub: https: //git hub.com/NoamShental/COMPASS . 2 The MCR Problem F orm ulation W e describ e infor mally and briefly the biolog ic al settings. Our g oal is to iden tify the sp ecies present in a given sample. W e extr a ct DNA , use 16S rRNA univ ersal primes a nd amplify the DNA in this region. W e then assume that DNA is shea r ed randomly and sequence it using MPS. W e assume that the sequence s database contains 1 6S rRNA sequences for al l sp ecies present in the mixture, and recons tr uct the sp ecies in the mix tur e in silic o . A schematic repr esentation of the MCR method is shown in Figure 1 . W e denote by N the num be r of sp ecies in the da tabase. The sp ecies’ 16 S rRNA seq uences are marked S 1 , .., S N , represented as strings ov er the alphab et Υ = { ‘A’, ‘C’, ‘G’, ‘T’ } . W e assume that the S i ’s are distinct sequences. The sequences may hav e differ ent leng ths n 1 , .., n N , with n i the length of the i-th species ’ sequence, i.e. S i ∈ Υ n i . F or the 16S r RNA gene, the lengths n i are ro ughly 1500 base- pa irs. W e define the maximum sequence length as n M AX ≡ max i n i . W e deno te by s i,j the j-th nucleotide in the i- th sp ecies’ sequence S i , and b y s i,j : k the substring containing nucleotides j, j + 1 , .., k in the sequence S i . W e repr esent the pr op o rtion o f each sp ecies in the mixture using a vector x of le ngth N , w ith x i the frequency o f sp ecies i . W e ha ve x ∈ ∆ N , wher e ∆ N is the N -dimensional simplex, ∆ N = { x : x i ≥ 0 , P N i =1 x i = 1 } . W e repres e n t the interior of a set A as i nt ( A ). In par ticular, int ( ∆ N ) is the subset of ∆ N containing vectors with positive en tries, int ( ∆ N ) = { x : x i > 0 , P N i =1 x i = 1 } . W e observe data in the form of R reads o f length L , r 1 , .., r R ∈ Υ L , with L typically ar ound ∼ 50 − 400 , as in the Illumina and 454 se quencing technologies. W e repr esent the data by a vector of r ead frequencies, y ∈ ∆ 4 L , with the j -th co o r dinate g iven b y y j = 1 R P R i =1 1 { lex ( r i )= j } , ∀ j = 1 , .., 4 L . Here l ex ( r ) is the index of r in the lexicogr aphic or dering of all 4 L po ssible reads (i.e. l ex (’AAA ... A’) = 1 , .., l ex (’TTT ... T’) = 4 L ). W e also define the inv erse lexico graphic or dering transfor mation, l ex − 1 , which fo r a given index j gives the corres p onding sequence (e.g. le x − 1 (18) = ’AAA ... A TC’). A c c u r a t e P r o fi l i n g o f M i c r o b i a l C o m m u n i t i e s 3 U n kn o w n M i xt u r e Extr act DNA , PC R A mp li fy M assi v el y Par al l el Seq u en ci ng Sh o r t R ead s Ü Ú L Ù ä Ú á Ü Û L Ù ä ÙÛ á Ü Ü L Ù á ä ä á Ü ü L Ù ä ÚÞ Esti mated Sp ecies A bund an ces: In - Si li c o R eco n str u cti on Seq u en ce D atab ase S 1 $ * &*&* * $ * $* &$ * 7 $* $ * $* $ * $* * $& $* $&& * &* « Y S 2 $ *7 *&* ** $ *& $ *7 $ * $*7 7 $ * $ * $** $* $ &* &7 « S N &$ * 7*& *** $ * &$&& $* $ * $* $ * $7* $ * $& * && 7* $* $ 7*« r 1 =GA G CGCG G A T r 2 =GG A G A CG CTC r N =A G A G A G A TGT Y Fig. 1. The steps p erformed for species reconstruction using the MCR metho d. First, DNA is extracted and amplified using PCR with un iver sal p rimers matching the 16S rRNA gene. The D NA is then sheared and sequenced using MPS, prod ucing millions of short sequence reads. The sequencing data (reads), t ogether with a database of 16S rR NA sequences, are en tered into the comput ational pip eline providing estimated species abundances as outp ut. In the M CR problem, the data vector y and the databa se sequences S 1 , .., S N are given as input. Our goal is to r econstruct the species frequencies vector x from this information. The vector y is of exponential length (4 L ) but very sparse, with only M ≤ R non-zero co ordina tes, where M is the num b e r of unique sequence reads. W e store a nd manipulate only the non-z e ro part of y - therefore the co mputational co mplex it y of all of our algorithms will dep end on M , and not the exp o nent ially larg e 4 L (see Sec tio n 5). In typical MPS exp eriments with curre nt tec hnologies R ma y be on the or der of ∼ 10 5 − 10 8 . 2.1 P robabilisti c Mo del W e formulate a probabilistic generative mo del capturing the sequencing pro cess. W e a ssume that the R reads are sampled iden tically and indep enden tly (i.i.d.) from the set of amplified regions in t wo steps, 1. First, sample a microbial species b from the set of p os s ible specie s { 1 , .., N } , with the proba bilit y of spe c ies j being sampled pr op ortional to the amount of DNA from this species, x ′ j ≡ P r ( b = j ) = x j n j P N i =1 x i n i . 2. Next, sample a r ead r from a distribution given b y the sp ecies b . W e repr e s ent sampling probabilities using a 4 L × N r ead-sampling matrix A = A ( S, L ) whose ( i , j )-th entry is the proba bilit y to o bserve read i given that we know it ca me from species j , A ij = P r ( r = i | b = j ). R emark 1. The vector of sampling proba bilities x ′ from step 1 is obtained b y re-weighting the fr equency vector x acco r ding to the sequence lengths. F o r ease of notation, we disregar d this r e-weigh ting, and denote bo th vectors as x . When all s e quences lengths n j are identical we ha ve indeed x ′ = x . More gener ally , the vectors ar e differen t but w e can easily con vert x to x ′ or x ′ to x using the above relation x ′ j = x j n j P N i =1 x i n i The sa mpling pro cess defines a probabilit y distribution P x = P x ( y ; A, L ) o n the s pa ce of possible frequencies ∆ 4 L , P x ( y ; A, L ) = P N j =1 A ij x j y = e ( i ) 0 otherwise (1) where e ( i ) ∈ ∆ 4 L is the i-th vector in the standard basis, e ( i ) i = 1 , e ( i ) j = 0 ∀ j 6 = i . The data can be represented as R i.i.d. random v ar iables, y (1) , .., y ( R ) ∼ P x ( y ; A, L ), with the sample frequency y repres e nted 4 Accurate I dentification and Profiling of Microbial Communities as, y = 1 R P R i =1 y ( i ) . W e denote the MCR problem with read sampling matrix A by MCR ( L, A ). In its simplest form, A can be constr ucted as fo llows, A ij = P n j − L +1 k =1 1 { lex − 1 ( i )= s j,k : k + L − 1 } n j − L + 1 (2) This ma trix represents uniform sampling o f err or-fr e e reads a long the sequence of the c hosen sp ecies j , assuming L ≤ n j ∀ j . A non- z e ro elemen t A ij means that read i appe a rs in the s equence of spe c ies j . If L > n i we assume that the ‘tail’ of each rea d is sa mpled uniformly from Υ (see Appendix Section A.1). R emark 2. The ab ov e constructio n of A ass umes no read error s and no biases. Incorp or ating more rea lis tic sequencing mo dels with non-uniform read densit y due to a mplification biases, read errors (substitutions and indels), alignments errors etc. can be done b y c hanging the definition of A fro m eq. (2). The same databa se S may th us yield different matr ices A , and the sta tistical and alg orithmic prop erties of a certa in MCR problem depe nd on the da tabase S o nly thr ough the matrix A . The assumption in step 1 is that species DNA frag ment s are sampled according to their DNA frequencies out of the total DNA prese nt in a sample. The model cannot accommo date dev iations from this assumption which may ar ise fr o m amplifica tion biases and limited library complexity , whic h may distort the sp ecies frequencies - tha t is, the fraction o f r eads o riginating from a certain sp ecies may not represe nt the s pecie s ’ true frequenc y in the mixtur e. Accounting a nd corre cting for suc h biases require analyzing mult iple samples together. In s imilar to the read frequencies v ector y , the ma trix A is also hu ge (4 L × N ) but very sparse. In par ticular, the nu mber of non- zero rows in A , deno ted K , is muc h smaller than 4 L , as most o f the rows in A are zero and need not b e stored. In the simple mo del ab ov e, K ≤ P N j =1 ( n j − L + 1), which is r oughly equal to the database size in nucleotides. In more c o mplicated mo dels inv olving rea d err or, K will b e larger, but still m uch smaller than 4 L . The computational complexit y of our algorithms depends on K (see Section 5). An estimato r ˆ x of the freq uency vector x is simply a function fr o m the set of all reads a nd data base, to the n -dimensional s implex, ˆ x : ∆ 4 L × S → ∆ N , ˆ x = ˆ x ( y , S ) (her e S is the set of all p ossible sequences databases, i.e. the space of all ordered finite collections of str ings ov er Υ ). W e can solve the MCR pr o blem by finding an estimator ˆ x minimizing a n e mpir ical los s function. That is, define ˆ y = A ˆ x , the empirical reads distributio n given the estimator ˆ x . W e would like to minimize the loss l ( ˆ y , y ), and define the following estimato r, ˆ x = ar g min x ∈ ∆ N l ( A x , y ) (3) A natural loss function is the Kullback-Leibler divergence l K L ( y , ˆ y ) = D ( P y || P ˆ y ). This for m ulation is equiv- alent to ma ximizing the likelihoo d of the data y , a ccording to the probabilistic mo del in eq. (1). Maximizing the likeliho o d using the EM alg orithm was prop osed in [13] for a very similar likeliho o d for mulation - this approach, howev er, is curr ent ly not sca lable to a large num ber o f species . W e choose instead the l 2 loss l 2 ( y , ˆ y ) = || y − ˆ y || 2 , mainly for co mputational considerations . The l 2 loss leads to a standard optimization problem and many off-the-s helf s olvers can b e used. W e exp e ct r e al mixtures to b e s parse, with o nly a few hundreds to a few tho usands sp ecies pr esent (out of hundreds o f thousands ). it is ther efore app ealing to us e a spars it y-promoting loss in the co st function in eq. (3), for ex ample by p enalizing l 0 norm of x . This is es pecia lly imp orta nt when the num ber of reads is limited, to av oid over-fitting o f the so lution to the randomly sa mpled r eads. The l 0 norm is not convex, leading to an intractable co mputational problem. The most common remedy of r eplacing the l 0 norm by the c onv ex l 1 norm do es not work in our problem since for probability vectors in the simplex x ∈ ∆ N the constraint || x || 1 = 1 trivially holds. Pr omoting sparsity for probability distributio ns in the simplex b y con vex relaxatio n was rece ntly pr op osed [20], but the approach do es not sca le to our pro blem’s size. Instead, we developed a scalable div ide-and-conquer thr e sholding alg orithm (see Section 5) whic h minimizes the l 2 error , while enforcing sparsity implicitly , b y a r e pea ted truncation o f non-zero frequencies. The resulting so lution is guaranteed to b e sparse, while still keeping the l 2 error lo w as desired. Accurate Profiling of Microbial Co mmunities 5 2.2 Ev aluating the Solution: Metri cs T o ev aluate reconstr uctio n accura cy , we nee d a measur e co mparing the re c onstructed so lution ˆ x with the correct so lutio n x . Different applications may require different metrics - for ex a mple, in some applications we may be interested only in the identity of the sp ecies, while in other applications one would w ant to detect changes in fr e quencies . It may b e imp or tant to iden tify the particular species or strain, or one ma y b e s atisfied with coa rser reco nstruction at the genus or family lev el. There are tw o ma jor gr o ups of p erfor mance metrics: 1. Phylogenetically-Unaw are criteria : These metrics tak e into account only the sp ecies identities and frequen- cies. Examples include the l p norm b et ween the t w o v ectors, recall-prec ision and Jacca rd index. W e use the simple l 2 norm as a repres en tative of this gr oup. This metric measures the devia tion in sp ecies fr e quencies betw een the true and reconstructed solutions, D l 2 ( x , ˆ x ) = q P M i =1 ( x i − ˆ x i ) 2 . 2. Phylogenetically-Aware cr iteria: These metrics ta ke in to account the phylogenetic relationship betw een sp ecies. The main in tuition her e is that identifying a sp ecies close to the true sp ecies is in fact a lmost as go o d as r econstructing the cor rect sp ecies. Examples include unifrac [14], weigh ted unifrac [15], and DPCoA [19]. W e prop os e a novel Phylogenetically-aw are criterion, using a Mahalanobis distance, D M A ( x , ˆ x ; D ) = p ( x − ˆ x ) ⊤ D ( x − ˆ x ) = q P i,j D ij ( x i − ˆ x i )( x j − ˆ x j ). The matrix D is constructed to capture the phylogenetic distance b etw een spe c ies (for exa mple, from the sp ecies 1 6S rRNA sequences themselves). Hig h (low) v alues of D ij corres p ond to pair s of spec ies ( i, j ) which are closely-related (r emote). F or concreteness, w e choo se s pecific a lly D = A ⊤ A , whic h repr e sent the similarity betw een sp ecies bas e d on their 16 S rRNA sequences . T he resulting Maha lanobis distance measures the agr eement b etw een the true a nd reconstr ucted solutions , in terms of b oth the sp ecies identities and their frequencies, while taking in to account the similarities b etw een closely related specie s . 3 Sp ecies Iden tifiabilit y In this section we study sp e cies identifiabilit y - that is, the ability to correctly identify the specie s and their frequencies as the n umber of reads, R , go es to infinit y . Definition 1. We say that the pr oblem MC R ( L, A ) is identifiable, if for every x (1) 6 = x (2) ∈ ∆ N , ther e exists y ∈ ∆ 4 L such t hat P x (1) ( y ; A ; L ) 6 = P x (2) ( y ; A ; L ) . Spec ie s iden tifiabilit y captures fundamen tal limits of our abilit y to r econstruct the sp ecies frequency vec- tor fro m the obser ved reads data . If the pr oblem MCR ( L, A ) is identifi able, then in principle it is p os sible to corre c tly reco nstruct the sp ecies frequencies vector x , since different v ectors will gener ate differen t distri- butions on the o bserved r e ads. If the proble m is not iden tifiable, r ecov ering the corre c t frequencies vector x may no t b e p oss ible, regardless of the data size and co mputatio nal resource s av ailable, since other (incor rect) frequency vectors give rise to a n iden tical distribution on the observed reads data. The identifiabilit y question is no t unique to the MCR pro blem, and a r ises more gener ally when recon- structing the identit y of lo ng sequence s in a mixture using short reads. F or example, conditions for the ident ification of isofo rms fr om RNA-seq data were g iven in [11]. The different Is oforms in [11] are analogo us to the differen t species in our problem, y et the precise mo deling as s umptions a nd identifiabilit y criteria are different in the tw o problems . Ident ifiability is determined by bo th the s imilarity b etw een the sequences of different species, and the read length. Longer and more diverse sequenced r egions provide more information on the DNA s equence of different sp ecies in the mixture, and allow to distinguis h b etw een the under lying sp ecies more easily . How ev er, e ven when the seq uenced regions a r e informa tive enough, short sequenced reads obtained from these regio n ma y map to m ultiple sp ecies, thus sp ecies identification can b e hard when rea ds are to o sho r t. W e next formalize this intu ition mathema tically , showing ho w ident ifiability is determined by the input sequence database (and the read length L ) through the ma trix A , which r epresents the rela tion betw een the unknown vector x and the obse rved data y (see App endix for pro ofs of all Prop os itions), 6 Accurate I dentification and Profiling of Microbial Communities Prop ositio n 1. L et A (1) b e the matrix c onstructe d fr om A , c onc atenate d with an al l 1 ’s r ow ve ctor 1 N , A (1) ≡ A 1 N . The r e c onstruction pr oblem MCR ( L, A ) is identifiable if and only if rank ( A (1) ) = N . As the read length increases, it becomes increas ingly e asier to distinguish betw een spec ie s, Prop ositio n 2. Assu me N > 4 . Supp ose t hat the datab ase S is c omp ose d of N distinct se quenc es su ch that no se quenc e is a substring of another se quenc e, i.e. s i,j : k 6 = s i ′ ∀ i 6 = i ′ ∈ { 1 , .., N } , ∀ j, k ∈ { 1 , .., n i } . L et A ( u,L ) b e the s ampling matrix obtaine d by un iform sampling of r e ads with r e ad length L , ac c or ding to e q. (2) . Then ther e is a critic al r e ad length L c , 1 < L c ≤ max i n i such that the pr oblem MCR ( L, A ( u,L ) ) is identifiable if and only if L ≥ L c . R emark 3. W e assume that no seq uenc e in the databa se is a substring of ano ther da tabase sequence fo r mathematical conv enience. This a s sumption usually holds in pr actice provided a long enough region is se- quenced, and can be relax ed while still obtaining similar identifiabilit y results. In addition, we demo ns trated ident ifiability for a uniform r ead sampling distr ibution, but a similar res ult can b e obtained fo r other read sampling distributions. Spec ie s iden tifiabilit y is a worst-case mea sure, as it requires al l sp ecies to b e identified correctly . In practice, w e may settle for a w eaker no tion - for example w e would still consider a r econstruction as success ful if all sp ecies ex cept a small minority were identified corre c tly . W e next define p artial ident ifiability , which is a weak er pro per t y characterizing our ability to correctly reconstruc t identities a nd frequencies of sp ecific sp ecies, while for other species the r econstruction ma y remain am biguous. Definition 2. We say that t he pr obl em MC R ( L, A ) is p artial ly identifiable for sp e cies j , if for any x (1) , x (2) ∈ ∆ N such t hat P x (1) ( y ; A, L ) = P x (2) ( y ; A, L ) ∀ y ∈ ∆ 4 L , we have x (1) j = x (2) j . W e ca n c hec k partial iden tifiabilit y using the following pro po sition, Prop ositio n 3. The pr oblem MCR ( L, A ) is p artially identifiable for sp e cies j , if and only if the standar d b asi s ve ctor e ( j ) ∈ ∆ N is ortho gonal to the nul l-sp ac e of A (1) , that is A (1) x = 0 ⇒ x j = 0 ∀ x ∈ R N . W e present the identifiabilit y properties achiev ed for real 16S rRNA da ta in the Appendix (Section A.5). 4 Reconstruction Error While identifiabilit y ensures that one can in princi ple reconstruct correctly the sp ecies v ector x , it essentially assumes an unlimited n umber of reads and computational p ower. Here we s tudy the recons truction error in more rea listic scenario s, w ith a finite n um b er o f reads. W e prov e g eneral rig orous upper -b ounds on reconstruc- tion err or, in terms of the matrix A and the n um b er of r eads R . In the Appendix (Section A.8) we examine the actual error achiev ed in practice using simulations. The nex t pro po sition gives b ounds on the approximation err or of the true frequency vector x ∗ by the estimator ˆ x , whic h w e obtain using the empirically-obser ved frequencies y , Prop ositio n 4. Consider the pr obl em MCR ( L, A ) with R se quenc e r e a ds, and let ˆ x b e the est imator mini- mizing the l 2 loss, ˆ x = ar g min x ∈ ∆ N l 2 ( A x , y ) . Then, 1. L et λ min ( A ⊤ A ) b e the smal lest eigenvalue of A ⊤ A . The Euclidian l 2 distanc e satisfies: P r D l 2 ( ˆ x , x ∗ ) ≤ 2 + p log(1 /δ ) p Rλ min ( A ⊤ A ) ≥ 1 − δ, ∀ δ ∈ (0 , 1) . (4) Accurate Profiling of Microbial Co mmunities 7 2. The Mahalanobis distanc e with weight matrix A ⊤ A satisfies: P r D M A ( ˆ x , x ∗ ; A ⊤ A ) ≤ 2 + p log(1 /δ ) √ R ≥ 1 − δ, ∀ δ ∈ (0 , 1) . (5) The bound on the c onv ergence rate of the D l 2 error depends on spe ctral proper ties of the matrix A ⊤ A . This is related to the database coherence , o r similarity b etw een the sequences S i , enco ded as simila rity b et ween the rows of A . In particular, when the problem is non-identifiable, the ma tr ix A ⊤ A has a zero eigenv alue and the reconstruction error may b e arbitr a rily lar ge. In contrast, the Mahalanobis bound do e s not dep end on the matrix A or even the dimension N . E ven if the pro blem is non-identifiable, w e still achiev e conv ergence under the Mahalano bis distance - yet the entries in the solution v ector will not conv erge to the cor resp onding en tries in the true frequencies v ector x , i.e. the reconstructio n may assign (part of ) the abundance of a spec ific species to differe n t, yet highly similar sp ecies. 5 Divide-and- Conquer Algorithm Solving a la rge scale MC R problem with hu ndreds of thous ands of s pecie s is co mputationally challenging. Even computing and s toring the matrix A is not trivial, let a lo ne minimizing the loss l ( A x , y ) in eq. (3). W e developed a scalable divide-and-co nquer thresholding appro ach to cop e with la rge problems. In a nut shell, the algorithm divides the sp ecies into distinct blocks, solv es a reduced- size problem within eac h block, setting sp ecies with lo w frequency in the so lution for each block to zero , merges so lutions from different blo cks and iterates to reduce problem size. F o r the r educed s ize s ub-problems we minimize the l 2 loss, r esulting in a conv ex optimization problem in each blo ck which w e solve (exa c tly) using the CVX conv ex optimization softw are pa ck a ge [8, 21]. W e describ e the algorithm in more deta ils in the Appendix (Section A.7). W e implemented the divide- and-conquer algorithm in the COMP ASS Matlab pa ck a ge (with s o me com- putationally de ma nding parts implemented in C). F or a pr oblem of size N ∼ 5 × 10 5 , running time is a few hours on a standard PC. The algo rithm show ed accura te reconstruc tio n per formance on simulated and real sequence data (see Section A.8 and [1]). 6 Discussion W e formulated the MCR problem mathematically , prop osed a n a lgorithm for s o lving la rge scale pro ble ms , and obtained results on reconstruction perfo r mance. W e applied our approach on the 16S rRNA gene. How ever, the a pproach is generic and could b e applied to other g enes o r r egions. T he reco nstruction p erfor mance is determined by prop erties of the geno mic region used (in our case, 16S rRNA ). Different genes or regions will provide different informa tion allowing us to distinguish b et ween different species or stra ins, for example using cla de-sp ecific markers [23]. Extending our metho d to geno me-wide metag enomics s e quencing is p os s ible, although computationally challenging. Our approa ch relies on the presence of a da ta base o f r eference s equences, a nd cannot b e used as is fo r de n ovo discov ery of new species . Currently there ar e ∼ 3 000 whole-genome sequences in the NCBI database [9], co mpared to ∼ 1 0 6 16S rRNA seque nc e s in the Greengenes databa se, thus the curr ent utilit y of the whole-g enome approach is limited, although it ca n b e useful as a firs t filter b efore the remaining rea ds can b e used for de novo discovery (as sembly). Mo r e impo rtantly , as these database are likely to gr ow in the near future, it will beco me increasingly app ealing to use whole-genome sequencing, esp e c ially for ident ifying small v ariations in v ery close strains, or newly b orn a lleles in presen t strains (wher e the 1 6S rRNA seq uences may b e identical a nd not allo w iden tification). Providing efficient a lgorithms for the MCR problem is impo rtant - solving the MC R problem directly for N in the order of h undreds of thousands is currently infeasible due to memory and time is sues. W e used a feasible divide-and- conquer a pproach to co pe with this problem yet ther e is still ro om for algo rithmic improv emen ts, espe cially when coping with read er rors, which increase the size o f the matr ix A . Designing faster algo rithms for handling larger da tabases will b ecome crucial in light of the exp ected growth of micr obial databases, in terms of both the num ber sp ecies a nd the regio ns (including who le-genomes) cov ered. 8 Accurate I dentification and Profiling of Microbial Communities References 1. A. Amir, A. Zeisel, O . Zu k, M. Elgart, S. St ern, O . Sh amir, P .J. T urnbaugh, Y. Soen , and N . Shental. High resolution microbial communit y reconstruction by in tegrating short reads from multiple 16S rRNA regions. In R evision , 2013. 2. A. Amir and O. Zuk. Bacterial communit y reconstruction using compressed sensing. Journal of Computational Biolo gy , 18(11):1723 –1741, 2011. 3. J.R. Cole, Q. W ang, E. Cardenas, J. Fish, B. Chai, R.J. F arris, A.S. Kulam-S yed-Mohideen, D .M. McGarrell, T. Marsh, G.M. Garrit y , et al. The rib osomal database pro ject: impro ved alignmen ts and new to ols for rrna analysis. Nucleic A cids R ese ar ch , 37(suppl 1):D141– D145, 2009. 4. T.Z. DeSantis, P . Hugenh oltz, N. Larsen, M. Ro jas, E.L. Brodie, K. Keller, T. Hub er, D. Dalevi, P . Hu, and G.L. Andersen. Greengenes, a c himera-chec ke d 16S rRNA gene database and workb ench compatible with arb. A pplie d and envir onmental micr obiolo gy , 72(7):5069–5 072, 2006. 5. P .B. Ec kburg, E.M. Bik, C.N. Bernstein, E. Purd om, L. Dethlefsen, M. S argen t, S.R. Gill, K.E. Nelson, and D.A . Relman. Diversit y of the human in testinal microbial flora. Scienc e , 308(5728):1 635–1638, 2005. 6. I. Eskin, F. H ormozdiari, L. Conde, J. Riby , C. Skib ola, E. Eskin, and E. Halperin. eALPS: Estimating abundance leve ls in po oled sequencing using a v ai lable genotyping data. I n R e c omb , pages 32–44. Springer, 2013. 7. T.J. Gen try , G.S. Wickham, C.W. Schadt, Z. He, and J. Zhou. Microarra y applications in microbial ecology researc h. Mi cr obial Ec olo gy , 52(2):15 9–175, 2006. 8. M. Grant and S. Bo yd. Graph implementatio ns for nonsmo oth conv ex p rograms. In V. Blondel, S. Bo yd, and H. Kimura, editors, R e c ent A dva nc es in L e arning and Contr ol , Lecture Notes in Con trol and Information Sciences, pages 95–110. Springer-V erlag Limited, 20 08. http://sta nford.edu/ ~ boyd/graph _dcp.html . 9. D.H. H aft and A. T ovc higrec hk o. High-sp eed microbial communit y profiling. Natur e Metho ds , 9(8):793–79 4, 201 2. 10. M. Hamady and R . Knight. Microbial communit y profiling for human microbiome pro jects: T o ols, techniques, and challenges. Genome R ese ar ch , 19(7):1141– 1152, 2009. 11. D. Hiller, H . Jiang, W. Xu , and W.H. W ong. Identifiabilit y of isoform deconv olution from junction arra ys and rna-seq. Bioi nformatics , 25(23):3056– 3059, 2009. 12. S.M. Hu se, L. Dethlefsen, J.A. Hub er, D.M. W elc h, D.A. Relman, and M.L. S ogin. Exploring microbial div ersit y and taxonomy using S SU rRN A hyperv ariable tag sequencing. PL oS Genet ics , 4(11): e1000255, 2008. 13. D. Kessner, T. T urner, and J. Novem bre. Maxim um likelihoo d estimation of frequencies of known h aplot yp es from p ooled sequence data. M ole cular Bi olo gy and Evolution , 30 (5):1145–115 8, 2013. 14. C. Lozup one and R. Knight. U niFrac: a new ph ylogenetic metho d for comparing microbial communities. Applie d and Envir onmental Micr obiolo gy , 71(12):8228–8 235, 2005. 15. C.A. Lozupone, M. Hamady , S.T. Kelley , and R . Knight. Quantitativ e and qualitativ e β diversit y measures lead to differen t insights into facto rs that structure microbial communities. Appli e d and Envir onmental Micr obiolo gy , 73(5):1576 –1585, 2007. 16. E.R. Mardis. The impact of n ex t-generation sequencing tec hnology on genetics. T r ends in Genetics , 24(3):133–1 41, 2008. 17. P . Meinick e, K.P . Aßhauer, and T. Lingner. Mixture m o dels for analysis of the taxonomic composition of metagenomes. Bioinformatics , 27(12 ):1618–16 24, 2011. 18. B.J. Paster, S.K. Boches, J.L. Galvin, R .E. Ericson, C.N. Lau, V.A. Lev anos, A. Sahasrabud h e, and F.E. Dewhirst. Bacterial diversit y in h uman subgingiv al plaque. Journal of Bacter iolo gy , 183(12):3770–3 783, 2001. 19. S. P a voine, A.B. Dufour, and D. Chessel. F rom dissimilarities among species to dissimilariti es among communities: a doub le principal co ordinate analysis. Journal of The or etic al Biolo gy , 228(4):523 –537, 2004. 20. M. Pilanci, L. El Ghaoui, and V. Chandrasek aran. R eco very of sparse probabilit y measures via con v ex program- ming. In NI PS , 2012. 21. CVX Researc h. CVX: Matlab softw are for disciplined conve x programming, v er. 2.0. http://cvxr.com/cv x , 2012 . 22. R.T. Ro ck afellar. Convex Ana lysis, volume 28 of Princ eton Mathematics Series . Princeton Universit y Press, 1970. 23. N. Segata, L. W aldron, A. Ballarini, V. Narasimhan, O. Jousson, and C. H uttenhow er. Metagenomic microbial comm unity profiling u sing unique clade-sp ecific mark er genes. Natur e Metho ds , 9(8):811–814 , 2012. 24. J. Shaw e-T aylo r an d N. Cristianini. Kernel metho ds f or p attern analysis . Cam bridge Unive rsity Press, 2004. 25. L.C. Xia, J.A. Cram, T. Chen, J.A. F uhrman, and F. Sun. Accurate genome relativ e abundance estimation based on shotgun metagenomic reads. Pl oS One , 6(12):e279 92, 2011. Accurate Profiling of Microbial Co mmunities 9 App endix A.1 Dealing with Sequences Shorter than the R ead Length In ra re cases the read length L might b e lar g er than the sequence length n j for a particular sp ecies j . F or completeness, we adopt a con ven tion o f a rea d having it’s first n i nu cleotides ma tc hing the sequence, and the next n i − L nu cleotides distributed uniformly in Υ L − n i . In this case eq. (2) generalizes to, A ij = 4 min(0 ,n j − L ) P max(1 ,n j − L +1) k =1 1 { lex − 1 ( i ) 1:min( n j ,L ) = s j,k : k + L − 1 } max(1 , n j − L + 1) (6) where l ex − 1 ( i ) 1: k denotes the fir st k nucleotides in the i-th r ead (in lexicogr aphic ordering ). One can adopt different co nv en tions for this case, for example obtaining a shorter read (of length n j ), or using a ‘joker’ symbol fo r the tail (i.e. for example when s e quencing the molecule ‘ AAC GC T ′ a r ead of leng th 1 0 will b e ‘ AAC GC T N N N N ′ ). The choice of different con ven tions do es not ch ange our re s ult significantly - w e chose the ab ov e for mathematical conv enience. A.2 Proof of Prop osi ti on 1 Pr o of. F rom eq. (1), we hav e P x ( e ( i ) ; A, L ) = [ A x ] i , ∀ i = 1 , .., 4 L . Therefor e identifiabilit y holds if and only if A x (1) = A x (2) ⇒ x (1) = x (2) , ∀ x (1) , x (2) ∈ ∆ N . The vector A (1) x is o f size 4 L +1, obtained a s a concatenation of A x with one additional entry , [ A (1) x ] 4 L +1 = P N j =1 x j . F or any x ∈ ∆ N the la st e ntry [ A (1) x ] 4 L +1 is equal to 1 . Therefo r e A (1) x (1) = A (1) x (2) ⇐ ⇒ A x (1) = A x (2) , ∀ x (1) , x (2) ∈ ∆ N . If r ank ( A (1) ) = N , we ha ve A (1) x (1) = A (1) x (2) ⇒ x (1) = x (2) , ∀ x (1) , x (2) ∈ R N . Therefor e in pa rticular the relation is true for an y x (1) , x (2) ∈ ∆ N ⊂ R N and identifiabilit y ho lds . Conv ersely , if r ank ( A (1) ) < N then there exists a non-zer o v ector x ∈ R N , x 6 = 0 N in the n ull-space o f A (1) . Thus A (1) x = 0 and in par ticular [ A (1) x ] 4 L +1 = P N j =1 x j = 0. T ake a vector x (1) ∈ int ( ∆ N ). Then there exists ǫ > 0 such that x (2) ≡ x (1) + ǫ x ∈ ∆ N . But A x (1) = A x (2) and x (1) 6 = x (2) , therefore the problem MCR ( L, S, A ) is not identifiable. A.3 Proof of Prop osi ti on 2 Pr o of. T ake L = 1. Then the vector y simply measures the fraction of ‘A’s, ‘C’s, ‘G’s and ‘T’s in the sa mple, and is of length 4. The matrix A ( u, 1) is of size 4 × N , and r ank ( A ( u, 1) ) ≤ 4. Therefo r e, there exists a non-zero vector x in the null-space of A ( u,L ) , A ( u,L ) x = 0 . Let x (1) ∈ in t ( ∆ N ). Then there exists ǫ > 0 such that x (2) ≡ x (1) + x ∈ ∆ N . But P x ( x (1) ) = P x ( x (2) ) for x (1) , x (2) ∈ ∆ N . Hence the pro ble m MCR (1 , A ( u, 1) ) is not identifi able. T a ke L = n M AX (= max i n i ). F or ea ch sp ecies j define the rea d r ( j ) ≡ [ S j : ′ A ′ ( L − n j ) ] where ′ A ′ ( k ) is a string of k consecutive ′ A ′ s, and [ a : b ] denotes the concatenation of the tw o strings a and b . The read r ( j ) contains the sequence S j , follow ed by a str ing of ‘A’s. Since S j ′ is not a subseque nc e of S j for any j 6 = j ′ , the read r ( j ) cannot app ear when sequencing any other sequence j ′ 6 = j , so A lex ( r ( j ) ) j ′ = 0 ∀ j ′ 6 = j , and the l ex ( r ( j ) )-th row of A is all zero s except for the j-th ter m. This mea ns that A has N independent rows, indexed b y l ex ( r (1) ) , .., lex ( r ( N ) ) and rank ( A ) = N . Therefore rank ( A (1) ) = N and the problem MCR ( n M AX , A ( u,n M AX ) ) is ident ifiable. Suppo se that the pr oblem is MCR ( L, A ( u,L ) ) is identifiable, and le t L ′ > L . By definition, for every x (1) 6 = x (2) ∈ ∆ N , there e xists y ∈ ∆ 4 L such that P x (1) ( y ; A ; L ) 6 = P x (2) ( y ; A ; L ). But the distribution 10 Accurate I dentification and Profiling of Microbial Communities P x ( i ) ( · ; A ; L ) is obtained by a pro jection o f the distribution P x ( i ) ( · ; A ; L ′ ) (for i = 1 , 2), with P x ( i ) ( · ; A ; L ) = P y ′ ,y = y ′ 1: L P x ( i ) ( · ; A ; L ′ ). Therefore, there m ust exist y ∈ ∆ 4 L ′ with P x (1) ( y ′ ; A ; L ′ ) 6 = P x (2) ( y ′ ; A ; L ′ ) and the problem MCR ( L ′ , A ( u,L ′ ) ) is also identifiable for L ′ . A.4 Proof of Prop osi ti on 3 Pr o of. In simila r to Prop ositio n 1, since P x ( e ( i ) ; A, L ) = [ A x ] i , ∀ i = 1 , .., 4 L we have par tial ident ifiability if and only if A x (1) = A x (2) ⇒ x (1) j = x (2) j , ∀ x (1) , x (2) ∈ ∆ N , which holds if and only if A (1) x (1) = A (1) x (2) ⇒ x (1) j = x (2) j , ∀ x (1) , x (2) ∈ ∆ N . Assume that A (1) x = 0 ⇒ x j = 0 ∀ x ∈ R N . Then, for any t w o vectors x (1) , x (2) ∈ ∆ N take x = x (1) − x (2) to get, A (1) x (1) = A (1) x (2) ⇒ A (1) ( x (1) − x (2) ) = 0 ⇒ [ x (1) − x (2) ] j = 0 ⇒ x (1) j = x (2) j . (7) Therefore, MCR ( L, A ) is partia lly iden tifiable for sp ecies j . F or the other direction, assume tha t MCR ( L, A ) is partially identifiable for s pec ie s j . Let x ∈ R N . T ake so me x (1) ∈ int ( ∆ N ) and set x (2) = x (1) + α x with α > 0 small enoug h such that x (2) ∈ ∆ N . Then, A (1) x = 0 ⇒ A (1) x (1) = A (1) x (2) = 0 ⇒ x (1) j = x (2) j ⇒ x j = 0 . (8) A.5 Iden tifiabilit y in the 16S rRNA Database W e c hec ked the ability to identify sp e cies based on their 16S rRNA sequences. W e downloaded the 16S rRNA Greengenes da tabase from greengen es.lbl .gov [4] (file ‘curr en t prokMSA una lig ned.fasta.gz’, version dated 2010). After clustering together spec ies with identical 16 S rRNA s e q uences, we were left with N = 455 , 055 unique sequences o f the 16S r RNA gene, w ith mean sequence leng th 1401 - we r efer to these N unique sequences as the sp ecies. W e assume that the entire 16S rRNA gene is av aila ble - this ca n b e achiev ed for example by shot-g un or RNA sequencing (In pra ctice, the choice of primers used when per forming ta rgeted DNA sequencing may be r e s tricted due to bio chemical considera tions. This will affect the region sequenced and therefore all a spe cts o f the reconstruction p erforma nce including iden tifiability - see [1]). Although the sequences are all distinct when considering the entire 16S rRNA s equences, identifiabilit y is no t g ua ranteed since we only o bserve short reads cov ering pos sibly non-unique p ortions o f the 16S rRNA gene, which ma y cause a m biguities. W e plot in Figure 2 the num ber of uniquely identifiable sp ecies as a function o f the read length L . E ven for very short L , we can identify most spe c ies, since the short reads a ggrega te info r mation from the en tire 1 6S rRNA gene. How ever, even when L is long ( L = 10 0), there is still a sma ll subset o f sp ecies whic h are not iden tifiable. Accurate Profiling of Microbial Co mmunities 11 10 20 30 40 50 60 70 80 90 100 0 0.1 0.2 0.3 0.4 0.5 0.6 0.7 0.8 0.9 1 Read Length Frac. Identifiable Species 10 20 30 40 50 60 70 80 90 100 0.96 0.965 0.97 0.975 0.98 0.985 0.99 0.995 1 16s rand. Fig. 2. P artial identifiabilit y as a function of the read length. The red line shows results for a set of N = 10 , 000 similar sp ecies from the Greengenes database. F or comparison, th e blue line sh o ws results for N = 10 , 000 sequences of the same length, with uniformly drawn i.i .d. chara cters. (i.e. P r ( ′ A ′ ) = P r ( ′ C ′ ) = P r ( ′ G ′ ) = P r ( ′ T ) = 0 . 25 for eac h base). The X-axis is read length used. The y-axis shows th e fraction of identifiable species. A t L = 7 w e see a big jump in identifiabilit y , as exp ected, since this is the p oint at which the n umber of equations 4 L exceeds the num b er of sp ecies N . F or random sequences t h e p roblem is identifiable fo r L ≥ 7 (i.e., 100% of sp ecies are partiall y identifiable). F or the sequences from th e 16S rRNA d atabase, th e v ast ma jorit y ( ∼ 96 . 5%) of sp ecies are partially id entifiable for L = 7. The num b er of partially identifiable sp ecies then increases slo wly with read length (see inset). Even at L = 100 the problem is still not identifiable, bu t ∼ 98 . 5% of sp ecies can b e iden tified. The remaining un-identified species conta in groups of species with very close sequences, whic h can be distinguished only by increasing read length ev en further. A.6 Proof of Prop osi ti on 4 Pr o of. Eq. (3) with a l 2 loss implies that A x is the Euclidean pro jection o f y on the c o nv ex set A ( ∆ N ) ≡ { z : ∃ x ∈ ∆ N , z = A x } (na mely , it is the clo sest p o int to y in A ( ∆ N )). Similarly , A x ∗ is the Euclidean pro jection of y ∗ on A ( ∆ N ). Since pro jections o n conv ex sets can only reduce distances [22], we have, k A x − A x ∗ k 2 = k A x − y ∗ k 2 ≤ k y − y ∗ k 2 . (9) The left hand side above is equal to the Mahalanobis distance, since D M A ( x , x ∗ ; A ⊤ A ) = q ( x − x ∗ ) ⊤ ( A ⊤ A )( x − x ∗ ) = k A x − A x ∗ k 2 . (10) Therefore w e get D M A ( x , x ∗ ; A ⊤ A ) ≤ k y − y ∗ k 2 . (11) Recall that y = 1 R P R i =1 y ( i ) where the y ( i ) are i.i.d. vectors with E [ y ( i ) ] = y ∗ . Using large -deviation bo unds on v ectors [24] w e get, P r k y − y ∗ k 2 ≤ 2 √ R + r log(1 /δ ) R ≥ 1 − δ, ∀ 0 < δ < 1 (12) 12 Accurate I dentification and Profiling of Microbial Communities Combining eqs. (11,12), we get par t 2 o f the prop osition. T o prov e part 1, w e need to conv ert this result to a b ound on the Euclidia n distance betw een x and x ∗ . The con version is p erformed b y first writing an eigen- decomp osition of A ⊤ A , A ⊤ A = U ΛU ⊤ where U is an orthogo nal matrix and Λ a diagonal matrix with the eigenv alues of A ⊤ A . This giv es, D M A ( x , x ∗ ; A ⊤ A ) 2 = ( x − x ∗ ) ⊤ ( U ΛU ⊤ )( x − x ∗ ) ≥ || U ⊤ ( x − x ∗ ) || 2 2 λ min ( A ⊤ A ) = || ( x − x ∗ ) || 2 2 λ min ( A ⊤ A ) = D l 2 ( x , x ∗ ) 2 λ min ( A ⊤ A ) (13) Dividing b oth sides by λ min ( A ⊤ A ), taking the square ro o t and s ubstituting in eq. (5 ) g ives immediately part 1. A.7 Details of Divide- and-Conqour Algorithm Bo x 1: Di vide-and-Conquer Re construction Algorithm Input: S - Set of Sequences, y - read m easuremen ts, Probabilisti c m o del Output: x - v ector of sp ecies frequencies P arameters: B - bl o c k size. τ B - frequency threshol d for eac h blo c k. k B ,j - num b er of partitions into blo c ks i n j -th iteration, k F - final num be r of s p ecies allow ed 1. Partition to blo cks: Set v as a binary vector with one en try p er species. If this is the first partitioning, set iteration num ber j = 1. Repeat k B ,j times: (a) Partition sp ecies r andomly in to non-ov erlapping blo cks of size B . (b) In each blo ck (B) compute the matrix A ( B ) , (where ( B ) denotes the restriction of a vector or a matr ix to a blo ck B ), and solve (exa ctly) the con vex optimization proble m (using CVX), min x ( B ) || A ( B ) x ( B ) − y || 2 s.t., x ( B ) i ≥ 0 (14) (c) Collect all sp ecies with frequency above the threshold: if x ( B ) i ≥ τ B , set v i = 1 . Set j = j + 1. (d) Collect all linear ly dep endent s pecie s : F or each i which is non-identifiable in the block (i.e. sp ecies i is orthogo nal to the null spa ce of A ( B ) ) set v i = 1. 2. Collect r esults from blo cks: Keep only indices i with v i = 1, i.e. species with high enough frequency in at least one block reconstruction. 3. Reduce problem s ize: Keep only species i with v i = 1 . Set V = { i, v i = 1 } and set A = A ( V ) , x = x ( V ) . If | V | > k F , go back to step 1. 4. Solve for the last time the l 2 minimization problem for the reduced matrix, min x ( V ) || A ( V ) x ( V ) − y || 2 s.t., x ( V ) i ≥ 0 (15) Normalize x ( V ) to sum to one, and output the normalized vector as the solution Accurate Profiling of Microbial Co mmunities 13 A.8 Sim ulation Results 10 4 10 5 10 6 10 −4 10 −3 10 −2 10 −1 10 0 # Reads Error L 2 (simulations) L 2 (upper−bound) MA (simulations) MA (upper−bound) Fig. 3. The curves sho w the l 2 (blue) and Mahalanobis (red ) errors in reconstruction for the example d escribed in the text as function of sample size (number of reads used). Error-bars show mean and 1 standard deviation of error ov er 100 sim ulations. Solid curve s sho w the theoretical up p er- b ounds, taken with δ = 1 / 2, giving a bound on the median error. F or both metrics, the p erformance ac hieved in practice is significan tly better than the upp er bound . T o ev aluate the actual re c onstruction p erfor mance in practice, w e have p erfor med a simu lation study . In Figure 3 w e compare the actual reconstructio n p erfor mance using simulations to the general rigo rous bo unds obtained in Section 4. In our simulations, we studied the perfor mance as a function of the num ber of reads using the Gree ng enes 16S rRNA database, with N = 45 5 , 055 unique 16S rRNA sequences . In ea c h simulation we sampled a t random k = 200 species o ut of the total N . W e sampled the sp ecies frequencies from a pow er-law distribution with par ameter α = 1 , with frequencies norma lized to sum to one. W e then sampled sequence read according to the model in eq. (1). Read length was L = 100. The n um ber of rea ds R was v aried from 10 4 to 10 6 . W e perfo r med recons tr uction us ing Algorithm 1 , with the following par ameters: blo ck s ize B = 1000 , threshold frequency τ B = 10 − 3 . The parameter k B ,j represents a trade-o ff b etw een time complexity a nd accuracy , and was initialized to 1 at j = 1, then set to 1 0 when total size | V | was below 150 , 000. Then, set to 20 below 20 , 000. The final blo ck size us ed w as k F = 1 0 00. V er y low e rror ( ∼ 2%) is achieved for R > 500 , 00 0, showing that accurate reconstr uction is p ossible for a feas ible n umber o f r eads. The er ror r ate a chieved in pra ctice is muc h lower than the theor etical b ounds, indicating that tighter b ounds might b e achiev ed. There ar e many re asons for the ga p b etw een o ur bounds and sim ulation results: the co nc e n tration inequalities w e ha ve used may not be tight, the particular frequency distribution chosen may p er fo rm b etter than the worst-case distribution, a nd most imp ortantly , the small nu mber of species pr esent in the sim ulated mixture ma y enable a c curate detection with a smaller sample size. Proving improv ed bounds on reco nstruction per formance which consider a ll these issues including the sparsity of the solution is interesting yet challenging. Standard tech niques (e.g. from compressed s ensing) would nee d to b e mo dified to achiev e improved b ounds s ince they assume incoher ence of the matrix A which do e s not hold in our case, and do not co nsider the pois s on sampling model we use for the rea ds.
Original Paper
Loading high-quality paper...
Comments & Academic Discussion
Loading comments...
Leave a Comment