Empirical Bayes estimation of posterior probabilities of enrichment
To interpret differentially expressed genes or other discovered features, researchers conduct hypothesis tests to determine which biological categories such as those of the Gene Ontology (GO) are enriched in the sense of having differential represent…
Authors: Zhenyu Yang, Zuojing Li, David R. Bickel
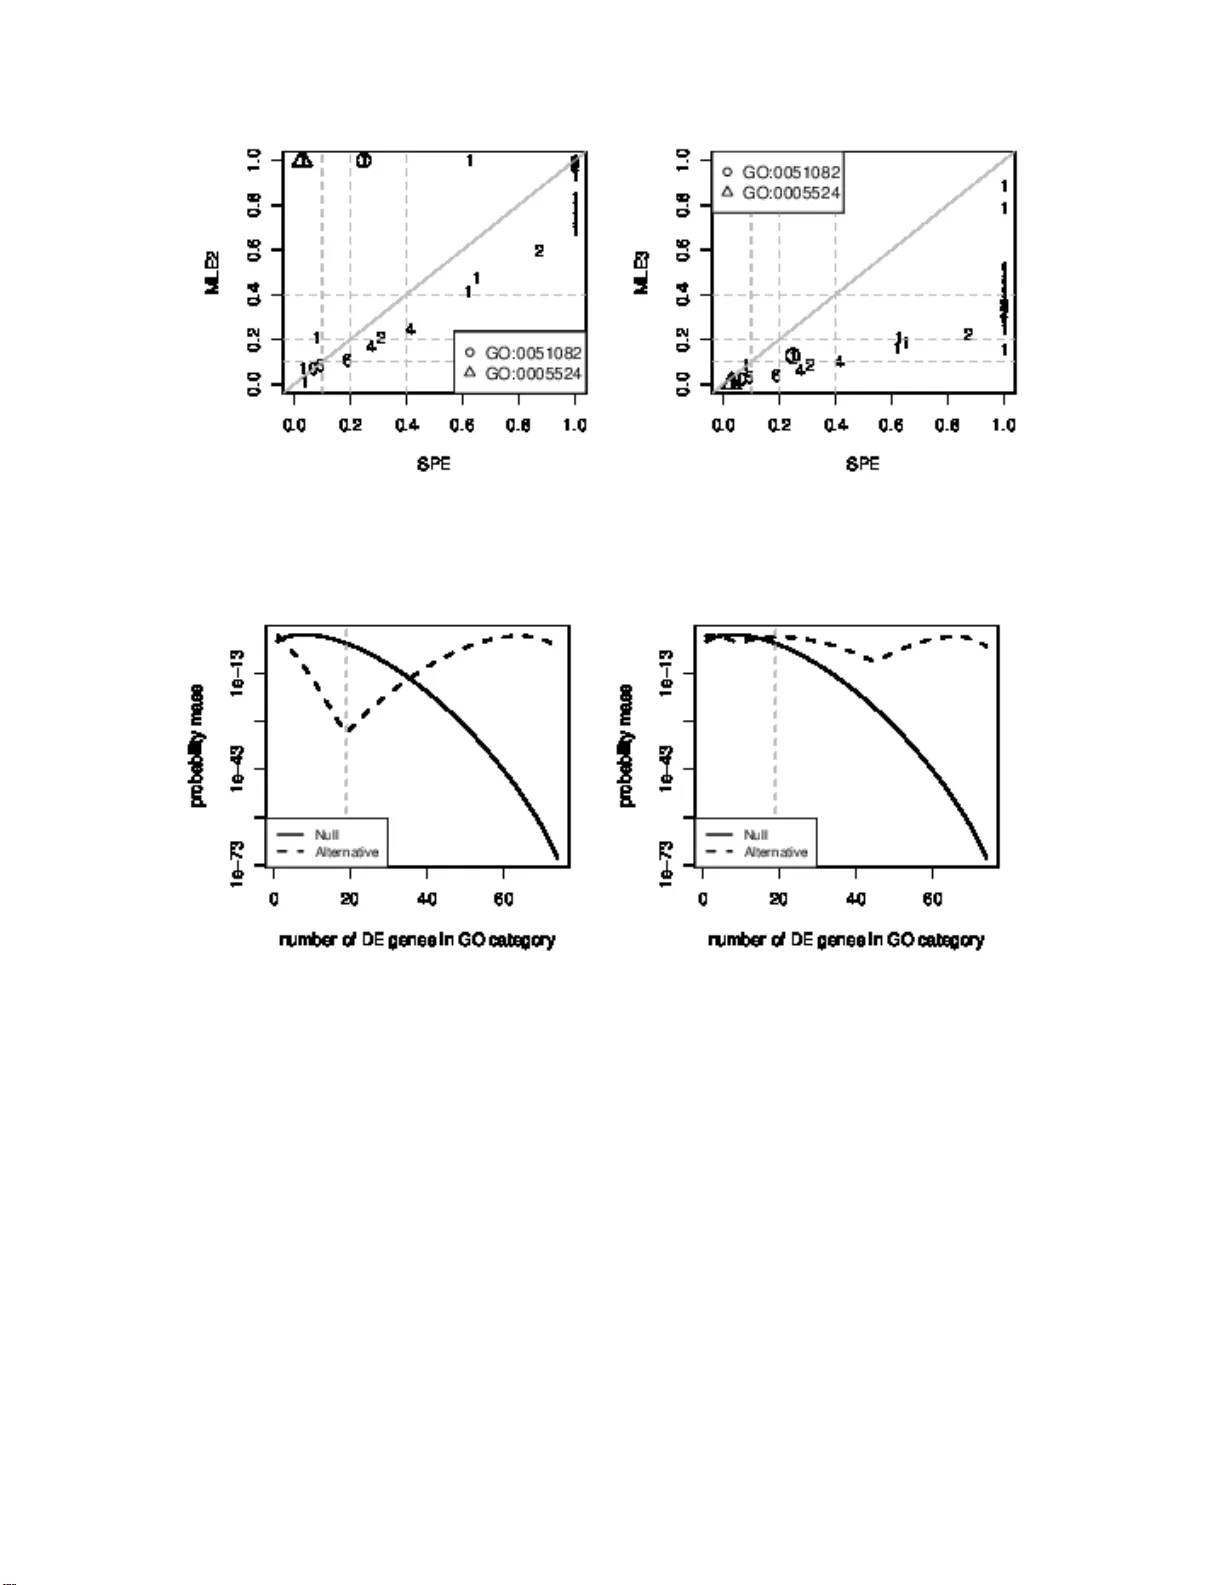
Empirical Ba y es estimation of p osterior probabili ties of enric hmen t Zhen yu Y ang 1 , Zuo jing Li 2 and Da vid R. Bic k el 1 ∗ August 23, 2018 1 Ottaw a Institute of Systems Biolog y , Departmen t of Bio chemistry , Microbiology , and Imm unology , Univ ersity of Ottaw a, 45 1 Smyth Roa d, Ottawa, On tar io, Cana da, K1H 8M5 2 Sch o ol of F o undation, Sheny ang Phar maceutical Univ ersity , No. 103 W enhua Ro a d, Sheny ang, Liaoning, 1 10016 , China E-mail: zy a ng009@ uottaw a.ca; zuo jing1 006@ho tma il.co m; dbic kel@uottaw a.ca ∗ Corresp onding author Abstract Backgr ound: T o interpret differentia lly exp ressed genes or other disco vered features, re- searc hers co nduct hypothesis tests to determine whic h biologic al categories such as those of the Gene Ontol ogy (GO) are enriched in the sense of h aving differen tial rep resentation among the disco vered features. Multiple comparison procedu res (MCPs) are commonly used to prevent excessiv e false p ositiv e rates. T raditional MCPs, e.g., t he Bonferroni correction, go t o the opp o- site extreme of strictly controlling a family-wise error rate, resulting in ex cessiv e false negative rates. Resea rchers generally prefer the more balanced approac h of instead contro lling th e false disco very rate (FDR). Metho ds of FDR control assign q-v alues to biological categories , but q- v alues are t o o lo w to reliably estimate a probabilit y that th e biological category h as equiv alent represen tation among the preselected features. Th u s, we study applicatio n of b etter estimators of that probabilit y , which is technical ly known as the local false disco very rate ( LFD R). Results: W e identified three promising estimators of the LFDR for detecting d ifferen tial represen tation: a semiparametri c estimator (SPE), a n ormalized maxim um likel ihoo d estimator 1 (NMLE), and a m ax imum likelihood estimator (MLE). W e found th at the MLE p erforms at least as wel l as the SPE for on the order of 100 of GO categories even when t he ideal number of components in its underlying mixture mo del is unknown. Ho w ever, the MLE is unreliable when the number of GO ca tegories is small compared to th e number of PMM comp onents. Th us, if the num b er of categories is on the order of 10, the SPE is a more reliable LFDR estimator. The NMLE dep ends n ot only on the d ata but also on a sp ecified v alue of the prior p robability of differential representatio n. It is therefore an app ropriate LFDR esti mator only when the num b er of GO categories is to o small for application of the other metho ds. Conclusions : F or enric hment detection, we recommend estimating the LFDR by the MLE giv en at least a medium num b er ( ∼ 100) of GO categorie s, by th e SPE given a small number of GO categories ( ∼ 10), and by the NMLE giv en a very small num b er ( ∼ 1) of GO categories. Keyw ords: empirical Ba yes, gene enric hment, gene expression, Gene Ontology , lo cal false discov er y rate, minim um descr iption length, multiple compar ison pro cedure, normalize d maximum lik eliho o d, simul taneous inference 2 In tro duction The developmen t of micr o array techniques and high-throughput genomic, proteomic, and bioin- formatics scanning a pproaches (such as microar ray g e ne expressio n pro filing, mass spectrometry , and ChIP-on-c hip) has enabled res earchers sim ultaneously to study tens of thousands of biologi- cal features (e.g., genes, proteins, single-nucleotide p olymo r phisms [SNPs], etc.), and to identif y a se t of features for further inv estigation. How ever, there remains the challenge of in terpreting these features biolog ically . F or a given set o f features, the determination of whether some bio - logical information ter ms ar e differentially represented (i.e., ov errepres e nted or underrepre sent ed), compared to the reference feature set, is termed the fe atur e enrichment pro blem. The biological information term ma y be, for instance, a Gene On tolo gy (GO ) catego ry [1] o r a pathw ay in the Kyoto Encyclop edia o f Genes and Genomes (KEGG) [20]. This problem ha s b een a ddressed using a num b er of high-throu ghput enrichmen t to ols, including D A VID [10], MAPPFinder [11], Onto-Express [21], and GoMiner [31]. Huang et al. [18] reviewed 68 distinct feature enrichmen t analysis to ols. These a uthors further clas s ified feature enrichmen t analysis to ols int o 3 categor ies: s ingular enrichm ent analysis (SEA), gene set enrichmen t analysis (GSEA) a nd mo dular enrichmen t ana lysis (MEA). Here , we inv estiga te the SEA problem us ing gene expres sion as a concrete exa mple. Mo re precise ly , we consider whether some sp ecific biologica l categories are differen tially r e presented a mong the pres elected genes with resp ect to the reference genes. W e call this problem the gene enrichment pr oblem . Existing enrichmen t to ols ma inly address the g e ne enric hment pr oblem using a p-v a lue obtained from an exa ct or approximate s tatistical test (e.g., Fisher’s ex a ct test, or the hypergeometric test, binomial test, χ 2 test, etc.). F or ea ch GO term o r o ther biologica l categor y , the null hypothesis tested and its alternative hypothesis are these: H 0 : the GO categ ory is equiv alently repr esented a mo ng the preselected genes H 1 : the GO categ ory is differentially repr esented among the pr eselected genes (1) The general pro cess beg ins a s fo llows: • F or each GO categ ory , c onstruct T a ble 1 based o n the preselected genes (e.g., differentially expressed (DE) genes) and reference g enes (e.g., all genes m easured in a microa rray exp eri- men t). • Compute the p-v alue for each GO categor y using a statistical test that can detect enrichmen t in the se ns e of differen tia l repr esentation among the pres elected g enes. 3 T able 1: The num b er of differentially ex pressed (DE) and equiv alently expre ssed (EE) genes in a GO categor y . Here, x i ( i = 1 , 2 ) is the num be r of DE ( i = 1 ) o r EE g enes ( i = 2 ) in the GO category ; n is the total num b er of DE genes; N is the tota l num b er of r eference genes. DE genes EE gene T otal In GO category x 1 x 2 x 1 + x 2 Not in GO category n − x 1 N − n − x 2 N − x 1 − x 2 T otal n N − n N Multiple comparison pro cedures (MCPs) a re then applied to the resulting p-v alues to pr even t excessive false-p ositive r ates. The false discovery rate (FDR) [3] is frequently used to control the exp ected prop or tion o f incorr ectly rejected null h yp otheses in gene enr ichm ent studies [22, 25, 2 9] bec a use it has lower false-nega tive rates tha n the Bonferr o ni correction and other metho ds of controlling the family-wise error r a te. Metho ds of FDR control assig n q-v a lues [28] to biologica l categories , but q-v alues are too low to reliably estimate the probability that the biological category has equiv alent repr esent ation among the presele c ted featur es. Thus, w e s tudy application of b etter estimators of that probability , which is technically known a s the lo cal fals e disc overy ra te (LFDR). Hong et al. [17] use d a n L FDR estimator to solve a GSEA problem and p ointed out that this was less biased than the q-v alue for es timating the LFDR, the p osterio r pro babilit y that the null h yp othesis is true. Efron [12, 13] devised relia ble LFDR es timators for a range of applications in microa rray gene expression ana lysis and other problems o f lar g e-scale inference. Ho wever, wherea s microa rray gene expression analys is takes into account tens of thousands of genes, the gene enrichmen t pr oblem t ypically co ncerns a muc h smaller num b er of GO ca tegories. While those metho ds are a ppropriate for microar ray-scale inference , they are less reliable for enrichmen t-scale inference Bick el [4, 9]. Thu s, we will sp ecifically adapt three t yp es of LFDR estimato rs that are appropriate for smaller - scale inference to a ddress the SEA problem. Here we will fo cus on genes and GO categ ories. Nevertheless, the estimators used can b e br oadly applied to o ther feature s (e.g., proteins, SNPs) and bio logical terms (e.g., those featuring metab o lic pathw ays). The sections of this pap er are arr anged as follows. W e will first introduce so me preliminar y concepts in the gene enrichmen t pro blem. Next, 3 LFDR estimato r s will be describ ed. Aft er that, we will compar e the L FDR estimators using breast ca ncer data a nd simulation da ta. Finally , we will draw conclusions and make recommendatio ns on the basis of our results. 4 Prelimina ry concepts The g ene enrichmen t problem descr ib ed in the Introduction i s stated here mo re forma lly for appli- cation of LFDR metho ds of the next section. Lik eliho o d functions Consider T able 1. Let X 1 and X 2 resp ectively denote the rando m num b ers of DE and EE genes in a GO categor y . The r esulting catego ries follow the binomial distribution, i.e., X 1 ∼ Binomial ( n, Π 1 ) and X 2 ∼ Binomial ( N − n, Π 2 ) , where Π 1 is the prop ortion of DE genes in the GO category a nd Π 2 is the prop or tion of EE genes in the GO categor y . Under the assumption that X 1 and X 2 are independent, the u n c onditional likeliho o d is L (Π 1 , Π 2 ; x 1 , x 2 , n, N ) (2) = Pr ( X 1 = x 1 , X 2 = x 2 ; Π 1 , Π 2 , n, N ) = n x 1 N − n x 2 Π x 1 1 (1 − Π 1 ) n − x 1 Π x 2 2 (1 − Π 2 ) N − n − x 2 where 0 ≤ x 1 ≤ n , 0 ≤ x 2 ≤ N − n a nd 0 ≤ Π i ≤ 1 , i = 1 , 2 . If we define λ = ln[Π 2 / (1 − Π 2 )] (3) and θ = ln[Π 1 / (1 − Π 1 )] − λ (4) then θ is the parameter o f interest, repres en ting the lo g o dds r atio of the GO category , a nd λ is a n uisance parameter . Under the new par ametrization, the unc o nditional lik eliho o d function (2 ) is L ( θ , λ ; x 1 , x 2 , n, N ) = n x 1 N − n x 2 × e x 1 ( θ + λ ) e x 2 λ (1 + e θ + λ ) n 1 (1 + e λ ) n 2 (5) where 0 ≤ x 1 ≤ n and 0 ≤ x 2 ≤ N − n . In equation (5), we take the interest par ameter θ a nd also the nu isance parameter λ in to co n- sideration. C o nsider statistics T and S , functions of X 1 and X 2 , such that T ( X 1 , X 2 ) = X 1 and S ( X 1 , X 2 ) = X 1 + X 2 . Thus, T repr esents the n umber of DE genes in a GO categ ory , and S rep- resents the num b er of total genes in a GO categor y . Let t and s be the obser ved v alues of s ta tistic T and S . The probability mass function o f T ( x 1 , x 2 ) = t ev aluated at S ( x 1 , x 2 ) = x 1 + x 2 = s , say Pr ( T = t | S = s ; θ , λ, N , n ) , do es not dep end on the nuisance pa rameter λ [4]. See a lso Example 5 8 . 47 of Severini [27]. Th us, we der ive the conditional probability mass function f θ ( t | s ) = Pr ( T = t | S = s ; θ, n, N ) = n t N − n v − t e tθ P min( s,n ) j =max(0 ,s + n − N ) n j N − n s − j e j θ (6) understo o d a s a function o f t . By eliminating the nuisance parameter λ , we can reduce the o riginal data x 1 and x 2 b y cons id- ering the statistic T = t . How ever, the use of the co nditional pro bability mas s function r equires some justificatio n b eca use of co ncerns ab out losing infor mation during the conditioning pro cess. Unfortunately , in the presence of the nuisance para meter, the statistic S ( X 1 , X 2 ) = X 1 + X 2 is not an ancillary statistic for the par ameter of interest. In o ther words, the probability ma ss func- tion of the conditional v aria ble S ( X 1 , X 2 ) may contain some informatio n ab out the par ameter θ [27]. How ever, following the explanation of B a rndorff-Nielsen and Cox [2, § 2 . 5 ], the exp ectation v alue o f the statistic S ( X 1 , X 2 ) equals the nuisance para meter. Hence, from the o bserv ation o f S ( X 1 , X 2 ) alone, the distribution o f the statistic S ( X 1 , X 2 ) contains little information ab out the parameter θ [2]. The statistic S ( X 1 , X 2 ) satisfies the other 3 conditions of a n ancillar y statistic defined by Barndorff-Nielsen and Cox [2]: parameters θ a nd λ a r e v ariation indep endent; the statis- tic ( T ( X 1 , X 2 ) , S ( X 1 , X 2 ) ) is the minimal s ufficien t statistic; a nd the distribution o f the statistic T ( X 1 , X 2 ) , given S ( X 1 , X 2 ) = s , is indep enden t of parameter of interest, θ , g iven the n uisa nce parameter λ . Therefor e, the proba bility ma ss function of the statistic S ( X 1 , X 2 ) c ont ains little information ab out the v alue of the parameter θ . Hyp otheses and false disco v ery rates Considering GO categ ory i , we denote the T , S , t , s and θ used in equation (6) as T i , S i , t i , s i and θ i . F rom T able 1, the hypothesis compar ison (1) of GO catego ry i is equiv a le nt to θ i = 0 versus θ i 6 = 0 (7) Let S = h S 1 , S 2 , · · · , S m i and s = h s 1 , s 2 , · · · , s m i . Let BF i denote the Bayes factor o f GO c ategory i : BF i = Pr ( T i = t i | S = s , θ i 6 = 0) Pr ( T i = t i | S = s , θ i = 0) (8) 6 It is ca lled the Bay es factor b ecause it y ields the po sterior o dds when m ultiplied by the prior o dds. More precisely , the p osterior o dds of the alterna tiv e hypothesis cor resp onding to GO ca tegory i is ω i = Pr ( θ i 6 = 0 | t i ) Pr ( θ i = 0 | t i ) = BF i × (1 − π 0 ) π 0 (9) where π 0 is the prior c onditional pr ob ability that a GO catego r y is equiv alently represented amo ng the preselected g e nes g iven s , i.e., π 0 = Pr ( θ i = 0 | S = s ) . Thus, (1 − π 0 ) /π 0 is the prior o dds of the alternative hypothesis of differential r epresentation . According to Bay es ’ theorem, the LFDR of GO categor y i is LFDR i = Pr ( θ i = 0 | t i ) = 1 1 + ω i , (10) where ω i is defined in eq uation (9 ). LFDR estimatio n metho ds Semiparam etric LFDR estimator Let α denote any sig nificance level chosen to be b etw een 0 and 1. F or all GO categ ories o f in ter est, the FDR may be estimated by d FDR ( α ) = min mα P m j =1 1 { p j ≤ α } , 1 ! (11) where m is the num b er of GO catego ries, p j is the p-v alue of GO categ ory j , and 1 { p j ≤ α } is the indicator such that 1 { p j ≤ α } = 1 if p j ≤ α is true and 1 { p j ≤ α } = 0 otherwise. Thus, P m j =1 1 { p j ≤ α } represents the n umber of GO categor ie s with discovered differential representation, and mα esti- mates the n umber of such discov er ies that are false. Let r i be the r ank of the p-v alue of GO category i , e.g., r i = 1 if the p-v alue of GO category i is the s ma llest among all p-v alues of m GO categories . Ba sed o n a mo dification of equation (11), the semip ar ametric estimator (SPE) of LFDR of the GO categor y i is d LFDR i = min mp 2 r i 2 r i , 1 , r i ≤ m 2 1 , r i > m 2 (12) It is conserv ative in the sense that it tends to ov e r estimate the LFDR [5]. 7 T yp e I I maxim um lik eliho o d estimator Bick el [5] follows Go o d [15] in calling the maximization of likelihoo d ov er a h y per parameter T yp e II maximum likelih o o d to distinguish it fr o m the usual T yp e I maximum likeliho o d , which p ertains only to models that lack random parameter s . Type I I maxim um likeliho o d has b een applied to parametric mixture mo dels for the analysis o f microarr ay data [24, 23], pro teomics da ta [9 ], and genetic a sso ciation data [30]. In this section, we adapt the a pproach to the gene enric hment pro blem b y using the conditional probability mass function defined a b ove. Let G ( s ) = { g θ ( •| s ); θ ≥ 0 } b e a par a metric family of proba bilit y mass functions with g θ ( •| s ) = 1 2 × [ f θ ( •| s ) + f − θ ( •| s )] (13) where f θ ( •| s ) is defined in equatio n (6 ). W e define the k - c omp onent p ar ametric mixtur e mo del ( k -c omp onent PMM) as g ( •| s ; θ 0 , . . . , θ k − 1 , π 0 , . . . , π k − 1 ) = k − 1 X i =0 π j g θ j ( •| s ) (14) where θ 0 = 0 and θ j 6 = θ J , if j 6 = J . Let T = h T 1 , T 2 , · · · , T m i and t = h t 1 , t 2 , · · · , t m i be vect ors of the T i s a nd t i s used in equation (8). Assuming T i is indep enden t of T j and S j for any i 6 = j , the joint probability mass function is g ( t | s ; θ 0 , . . . , θ k − 1 , π 0 , . . . , π k − 1 ) = m Y i =1 g ( t i | s ; θ 0 , . . . , θ k − 1 , π 0 , . . . , π k − 1 ) (15) = m Y i =1 g ( t i | s i ; θ 0 , . . . , θ k − 1 , π 0 , . . . , π k − 1 ) where s i is the observed v alue of S i for GO category i , and s = h s 1 , s 2 , · · · , s m i . Moreov er, w e a ssume that for given the num b er of genes in GO catego ry i , T i ( i = 1 , . . . , m ) , satisfies the k -compo nen t PMM shown in equation (14). In other words, w e a ssume that the poss ible log o dds r atios o f GO categor y i are the θ 0 , θ 1 , θ 2 , . . . , θ k − 1 of equation (14) if the alternative h yp othesis H 1 in the hypothesis compariso n (7) is true. Therefore, the log-likelihoo d function under the k -comp onent PMM for all GO categories is log L ( θ 0 , . . . , θ k − 1 , π 0 , . . . , π k − 1 ) = log g ( t | s ; θ 0 , . . . , θ k − 1 , π 0 , . . . , π k − 1 ) = m X i =1 log k − 1 X j =0 π j g θ j ( t i | s i ) (16) 8 The LFDR of GO categor y i is estimated by d LFDR ( k ) i = b π 0 g θ 0 ( t i | s i ) g ( t i | s i ; θ 0 , b θ 1 , . . . , b θ k − 1 , b π 0 , . . . , b π k − 1 ) (17) where b θ 1 , . . . , b θ k − 1 and b π 0 , . . . , b π k − 1 are maximum likelih o o d estimates of θ 1 , . . . , θ k − 1 and π 0 , . . . , π k − 1 in equation (16). W e call d LFDR ( k ) i the k -c omp onent maximum likeliho o d estimator (MLE k ). LFDR estimator based on the normalized maxim um likeli ho o d Combining equations (9)-(10), we obtain LFDR i = 1 + BF i × (1 − π 0 ) π 0 − 1 (18) Therefore, given a guessed v alue of π 0 , we may use an estimator of the Bay es factor to estimate the LFDR of a GO category . W e next develop such an estimato r o f the Bayes factor. F or GO category i , let E i stand for the set of all probability mass functions defined on { 0 , 1 , . . . , s i } , the set of all p ossible v a lues of t i . Based o n the hypothesis co mparison (7), the set of log o dds ratios, denoted a s Θ , is { 0 } under the n ull hypothesis and is the s et of all re a l v alues ex cept 0 under the alter native hypothesis. With the assumption that the random v ariable T i is indep endent of the r andom v ar iable S j for any i 6 = j , the r e gr et o f a predictive mass function ¯ f ∈ E i is a measure of how well it predicts the observed v alue t i ∈ { 0 , 1 , . . . , s i } . The regret is defined a s reg ( ¯ f , t i | s i ; Θ ) = log f ˆ θ i ( t i | s i ) ( t i | s i ) ¯ f ( t i | s i ) (19) where ˆ θ i ( t i | s i ) is the Type I MLE with resp ect to the Θ under the observed v alues t i given s i [6, 16]. F or all member s o f E i , the optimal pr e dictive c onditional pr ob ability mass function of GO cate- gory i , denoted a s f † i , minimizes the maximal regret in the s ample s pa ce { 0 , 1 , . . . , s i } in the sense that it satisfies f † i = ar g min ¯ f ∈E i max t ∈{ 0 , 1 ,...,s i } reg ( ¯ f , t | s i ; Θ ) (20) It is w ell known [16] that the predictive probability mass function that satisfies equatio n (20) is f † i ( t i | s i ; Θ ) = max θ ∈ Θ f θ ( t i | s i ) K † i (Θ) (21) 9 where f θ ( t i | s i ) is the conditiona l pro babilit y mass function defined in equation (6), and K † i (Θ) is the constant defined as K † i (Θ) = max θ ∈ Θ f θ ( y | s i ) (22) = min( s i ,n 1 ) X y =max(0 ,s i − n 2 ) max θ ∈ Θ f θ ( y | s i ) = min( s i ,n 1 ) X y =max(0 ,s i − n 2 ) n 1 y n 2 s i − y e y ˆ θ i ( y ) P min( s,n 1 ) j =max(0 ,s i − n 2 ) n 1 j n 2 s i − j e j ˆ θ i ( y ) where ˆ θ i ( y ) = arg max θ ∈ Θ f θ ( y | s i ) (23) W e call f † i ( t i | s i ; Θ ) the normalize d maximum likeliho o d (NML) asso ciated with the hypothesis that θ i ∈ Θ . Thu s, BF i is estimated by c BF † i = f † i ( t i | s i ; θ : θ 6 = 0) f † i ( t i | s i ; 0 ) , (24) which we ca ll the the NML r atio . Ther e fo re, b y combining equations (8) and (9), if we guess the prior probability π 0 , the LFDR estimate of GO catego ry i in the hypothesis comparis o n (7) is d LFDR † i = 1 + 1 − π 0 π 0 × c BF † i − 1 (25) where c BF † i is defined in equatio n (24). W e call this LFDR estimator the normalize d maximum likelih o o d estimator (NMLE). T o assess the p erformance of the NML r atio c BF † i , it will be compa red to the following estimate of the B ay es factor. Equations (1 8) a nd (17) sugg est c BF i = 1 − d LFDR ( k ) i d LFDR ( k ) i × 1 − b π 0 b π 0 (26) as an MLE-based estimator of BF i . 10 Results Breast cancer data analysis The data set used here is from an exp eriment a pplying a n estro gen treatment to cells of a human breast cancer cell line [26]. The data, which is av ailable from the Bio conductor pro ject, contains 8 Affymetrix HG-U95 A v2 CEL files from a n estrog e n r eceptor-p ositive breas t cancer cell line. (F or further infor mation co ncerning the data and also the Bio conducto r pro ject, see Gentleman et a l. [14].) F or s implicit y o f ter minology , we consider prob es in the microar ray ex per imen t as g enes, and use the 12 , 625 genes expr essed in the micro array exp eriment as a reference. W e selected as genes of int erest those that w ere differentially express ed be tw een t wo g r oups according to the following criterion. Using the LFDR as the probability that a gene is EE, we considered ge nes with LFDR estimates b elow 0 . 2 as DE. In other words, w e s e le c ted as DE genes those were differentially e xpressed with es timated po sterior pro babilit y of a t least 80 % . W e used the 2-sample t-test with eq ual v ariances to compute the p-v alue of ea ch gene in the micro array . The LFDR of every gene is estimated using the theoretical null hypothesis metho d of Efron [12, 13]; empirical n ull h y po theses can lea d to excessive bias due to deviations from normality [8]. When we compared g ene expr ession data for the pre s ence a nd absence of estrogen a fter 1 0 hours of expo sure, we obtained 74 DE genes. Defining unre late d pairs o f GO categories as those that do not share an y common ancesto r, we selected for analysis all unrelated GO molecular function categor ie s with a t least 1 DE gene, thereby obtaining a total of 8 2 GO categories of in terest. F or each GO ca tegory , the p-v alue used in SPE to estimate LFDR is co mputed based on the 2-sided Fisher’s exa ct test. Figure 1 compa res the SPE to the MLEs bas e d on the 2 -co mpo nen t (MLE2) and 3 -comp onent (MLE3) PMM. Fig ure 2 displays the probability mas s o f GO : 0005524 under the null and alternative hypotheses of the h yp othesis comparison (7). Figure 3 compares MLE-based es timates of the Bayes facto r g iv en by equation (26) to the NML ratios given by equation (26). 11 Figure 1: Comparison of the LFDR estimated b y the SPE with the LFDR estimated b y the MLE2 (left) and MLE3 (right). Each in teger repres en ts a num b er o f GO categories. Int ergers > 1 indicate ties. Figure 2: The conditional proba bilit y mas s functions given the num b er of genes in GO: 00 05524 under a n ull h yp othesis , and alter native hypotheses bas ed on the 2 -comp o nent PMM (left) a nd 3 -comp onent PMM (right). The grey dashed line is the num ber o f DE genes in GO: 00055 2 4 . Sim ulation studies The aim of the following sim ula tio n studies is to compare the LFDR estimation bias o f SPE, MLE2, and MLE3. The NMLE is not taken into acc o un t beca use its per formance dep ends not only o n the data, but also on the sp ecified prior probability π 0 . The simulation setting inv o lves 10 , 0 00 genes in a micr oarray w ith 200 genes iden tified as DE and 1 00 GO ca tegories. W e conducted a separate simulation study using each of these v alues of π 0 : 50% , 60% , 70% , 80% , 90% , and 94% . Since the PMM b ehind the MLE is o ptimal when the num b er of GO categor ies with ov errepre- 12 Figure 3: Comparison of the Bayes factor estimated by the NML ratio with that es timated by the MLE2 (left) and MLE3 (r ight ). The in teg ers are defined in Figure 1. T he grey dashed lines ma rk commonly used thresholds for strong and ov er whelming evidence [19, 7]. sentation (“enric hment ”) is equa l to the num b er with underreprese ntation (“depletion”), we ass essed the sensitivity of the MLE to that symmetry ass umption by using str ongly asymmetric lo g o dds ratios as well a s thos e that are symmetric. F or ea ch GO categor y , tw o configurations were used in this sim ulation to choo s e log o dds r atios: the asymmetric c onfigur ation shown in equa tion (27) and the symmetric c onfigur ation shown in equatio n (28). θ asymmetric i = 5 i 100(1 − π 0 ) , 1 ≤ i ≤ 10 0(1 − π 0 ) 0 , 100(1 − π 0 ) < i ≤ 100 (27) θ symmetric i = i 10(1 − π 0 ) , 1 ≤ i ≤ 50(1 − π 0 ) 5 − i 10(1 − π 0 ) , 50(1 − π 0 ) < i ≤ 100(1 − π 0 ) 0 , 100(1 − π 0 ) < i ≤ 100 (28) Considering the log o dds ratios o f all 100 GO categories cons tructed by either the asymmetric or the symmetric configura tio n, we generated T able 1 for ea ch GO category a s follows: • x 1 is g enerated fro m a binomial distribution w ith the para meter Π 1 used in equation (2); Π 1 is a r eal v alue r andomly pick ed from 0 to 1 . • x 2 is obta ined from a binomial distr ibution with the parameter Π 2 = h (1 − Π 1 ) × 2 θ i Π 1 + 1 i − 1 , obtained b y solving equation (4 ). The p-v alue of each GO catego r y used in the SPE is obtained fro m 2- sided Fisher’s exac t test. The k -compo nent PMM ( k = 2 or k = 3 ) used in the MLE is shown in equation (14) with π j = 13 Figure 4: The per formance of LFDR estimators for equiv alently (dashed line) or differen tially (so lid line) represented GO categor ies. (1 − π 0 ) / k [ j = 1 , . . . , k ] and g θ i ( •| s ) = g θ i ( t i | s i ) defined in equa tion (13). F o r every log o dd ra tio sequence, we estimated the LFDR 2 0 times using the SPE, MLE2, and MLE3. W e co mpared the p erforma nces of the 3 estimators by means of e s timating the LFDR bias. The true LFDR is computed by equation (10), where f 0 ( t i ) = n t i N − n s i − t i P min( s i ,n ) j =max(0 ,s i + n − N ) n j N − n s i − j and f 1 ( t i ) is computed by 1 J J X j =1 f θ j ( t i | s i ) where f θ ( t | s ) is defined in equation (6). Figure 4 shows the p erforma nce compa risons of the 3 LFDR estimators for simulation data obtained from the sy mmetric a nd asymmetric log o dds ratios. The LFDR biases estimated b y the SPE and MLE2 are similar. The L FDR estimated by the MLE3 provides the lowest bia s among the 3 LFDR estimator s. Moreover, the estimated LFDR biases of the estimator s ar e not strongly affected by whether the log o dds ratios are symmetric or a symmetric. F urthermore, the bias of the LFDR es timated by the SPE decreases as π 0 , the pro babilit y tha t GO categor ie s are equiv alent ly represented, increases. How ever, the LFDR es timate attains a negative bias if π 0 is higher than 80% . In other words, some equiv alently r epresented GO ca tegories a re dec la red as differentially represented GO categor ies. 14 Conclusions Efron’s metho d [12, 13] c a n b e used to estimate GO categories and thus address the gene e nr ich ment problem, provided that thousa nds of GO categor ies a re taken in to acco un t. Howev er, in most g ene enrichmen t studies, resea rchers fo cus on medium- or small-scale num be r s of GO categories, i.e., several hundred, dozens or only one GO categ o ry . Here, we a dapted 3 LFDR estimators (the SPE, MLE, and NMLE) to a ddress the g ene enr ic hment problem with me dium- and small-scale num b ers of GO categor ie s , and compared these using breast cancer and simulation data. The MLE is sensitive to k , the nu mber of PMM comp onents. The MLE is used when considering a medium-scale n umber of GO categories, i.e., 1 00 . In our breast cancer data analysis, the estimated LFDRs of GO: 005 1082 and GO: 00 05524 using MLE2 w ere 100% (Figure 1). How e ver, the LFDRs estimated by MLE3 were very close to 0 . Using the MLE formula shown in e quation (17), and the k -comp onent PMM shown in eq uation (14), we determined that the sensitivit y of the LFDRs of GO category i estimated by MLE2 a nd MLE3 depended mainly on the sensitivity of the B ay es factor, based o n the num b er of PMM comp o nent s. Compar ing the probability masses of GO: 0005524 , based on the 2 - and 3 -co mponent PMMs shown in Figur e 2, we found that the pr obability mas s of GO: 0005 5 24 under the null h yp o thesis is lar ger than that under the alternative h ypo thesis based on the 2 -comp onent PMM (left plot in Figur e 2). B y contrast, the prob a bilit y mass under the null h yp othesis is smaller than that under the alternative hypothesis based o n the 3 -co mponent PMM (right plot in Figure 2 ). Thus, the LFDR es timated by the MLE is stro ngly dep endent on the n umber of PMM comp onents. Nevertheless, the p erfor mance compar is on in Figure 4 indicates that the MLE has low er bias than the SPE when the num b er of GO categor ie s is muc h larger than k even when the ideal v alue of k is unknown. Moreover, MLE3 has lower bias than MLE2 as an LFDR es timator. Howev er, when the num b er of GO ca tegories is not muc h lar ger than k , the estimated prop ortion of GO catego ries equiv alently r epresented b ecome s trongly biased tow ard 0 . In that situation, the false p os itiv e rate increases as the num b er of PMM comp onents. Due to its conserv atism and freedom from the PMM, we reco mmen d using the SPE when the n umber of GO categories of in ter est is to o small for the MLE, e.g., abo ut 10 catego ries. Based on the simul ations rep orted by Bick e l [5], we conjecture that the SPE has acceptably low LFDR-estimation bias when there are at least 3 GO categor ies. Finally , w e reco mmend that the NMLE b e used given only 1 or 2 GO categor ies of in terest. Neither the MLE nor the SPE is a ble to estimate the LFDR for only 1 GO categ o ry of in terest; 15 moreov er, they probably hav e excessive bias when based on only 2 GO c ategories. Thus, the NMLE is the recommended metho d o f addressing the gene enrichmen t pro blem in this sma llest-scale case. The NMLE dep ends not only o n the data but a lso o n a g uess o f the v alue of π 0 , whic h, in the absence of stro ng prior information, is often set to the defa ult v a lue of 50%. A closely rela ted approach is to use the NML r a tio as an estimate o f the Bayes facto r directly without g uessing π 0 . By using 10 and 100 a s thresholds of each estimated Bay es factor to determine whether a GO category is differentially represented, we reached s imilar conclusio ns whether using the NML and or an MLE (Figure 3). Th us, at leas t for our data set, the NML ratio tends to estimate the Bayes factor almost as accura tely as metho ds that simult aneously use information acro ss GO terms. A c kno wledg men ts W e thank b oth Editage and Donna Reeder for detailed copy editing. W e a re g rateful to Corey Y anofsky and Y e Y ang for useful discussions. This work was partially supp orted by the Natural Sciences and Engineering Resear c h C o uncil of Ca nada, by the Canada F oundation for Innov ation, b y the Ministry o f Rese arch and Inno v ation o f On tario, and by the F ac ulty of Medicine of the Univ ersity of Ottaw a. References [1] D. Altsh uler, M. J. Daly , and E. S. La nder. Genetic mapping in human disea se. Scienc e , 322: 881–8 88, 2008. ISSN 0 036-8 075. doi: 10.112 6/science.11 56409. [2] O. E. Barndorff-Nielsen and D. R. Cox. In fer enc e and Asymptotics . CRC Pre s s, Lo ndon, 1994 . [3] Y. Benjamini and Y. Ho ch b erg . Controlling the false discovery rate: A practical and p owerful approach to mu ltiple testing. J ournal of the R oyal Statistic al So ciety B , 5 7:289– 300, 1 995. [4] D. R. Bickel. Minim um description length metho ds of medium-sca le simultaneous inference. T e chnic al R ep ort, O ttawa In stitute of Systems Biolo gy, arXiv:1 009.59 81v1 , 2010 . [5] D. R. Bick el. Simple estimators of false discov er y rates given as few as o ne or tw o p-v a lues without strong par ametric as s umptions. T e chnic al R ep ort, Ot tawa In s t itute of Systems Biolo gy, arXiv:110 6.449 0 , 20 11. 16 [6] D. R. Bick el. A predictive appr o ach to measur ing the strength of statistical ev idence for single and multiple comparisons. Canad ian Journal of St atistics , 3 9:610– 631, 2 011. [7] D. R. Bick el. The s tr ength of s tatistical evidence for comp osite h yp otheses: Inference to the bes t explanation. Statist ic a Sinic a DOI:10.5705 /ss.2009 .125 (online ahe ad of print) , 2 011. [8] D. R. Bick el. Estimating the null distribution to adjust observed co nfidence levels for g enome- scale sc r eening. Biometrics , 67 :363–3 70, 2 0 11. [9] D. R. Bick el. Small-scale inference: Empirical Bay es and confidence metho ds for as few as a single compar ison. T e chnic al R ep ort, Ottawa Institute of Systems Biolo gy, arXiv:1104 .0341 , 2011. [10] G. Dennis, B. T. Sherman, D. A. Ho s ack, J. Y a ng, W. Gao, H. C. L a ne, and R. A. Lempicki. D A VID: data base fo r annota tio n, v is ualization, and int egrated discov er y . Genome Biolo gy , 4 (9), 2 003. [11] S. W. Doniger, N. Salomonis, K . D. Dahlquist, K . V ra nizan, S. C. Lawlor, and B. R. Conklin. MAPPFinder: using gene ontology and GenMAPP to cr eate a globa l gene-expressio n profile from microarr ay data. Genome Biolo gy , 4(1), 2 003. [12] B. Efron. Larg e-scale simu ltaneous h yp othesis tes ting: The choice of a nu ll h yp othesis. Journ al of the Americ an St atistic al Asso ciation , 99 (465):96– 104, 2 004. [13] B. Efron. L ar ge-S c ale Infer enc e: Empiric al Bayes Metho ds for Estimation, T esting, and Pr e- diction . Ca mb ridge University Press, Ca m bridge, 2010 . [14] R. Gentleman, V. Ca r ey , W. Hub er, R. Irizarr y , a nd S. Dudoit, editors. Bioinforma tics and Computational Biolo gy S olut ions Using R and Bio c onductor . Springer, New Y ork, 2 005. [15] I. J . Go o d. How to Estimate Probabilities. IMA Journal of Applie d Mathematics , 2:364 – 383, 1966. doi: 10.10 93/imamat/ 2.4.364. [16] P . D. Grünw ald. The Minimum Description L ength Principle . MIT Press, London, 2007 . [17] W.-J. Hong, R. Tibshira ni, and G. Chu . Lo cal false discov er y rate facilitates comparis on of different microarray exp eriments. Nu cleic A cids R ese ar ch , 37(22 ):7483–7 497, 20 0 9. [18] D.W. Huang, B.T. Sherman, a nd R.A. Lempicki. Bioinformatics enrichmen t to o ls: pa ths tow ard the comprehensive functional analys is of lar ge gene lists. Nucleic A cids R ese ar ch , 37 (1):1–13, 2 0 09. 17 [19] H. Je ffreys. The ory of Pr ob ability . Oxford Univ ersity Press, London, 1948. [20] M. Ka nehisa a nd S. Goto. KEGG: Kyoto Encyclopedia o f Genes and Genomes. Nu cleic A cids R ese ar ch , 28(1):27 –30, 200 0. [21] P . Khatr i, S. Draghici, G. C. Ostermeier , and S. A. Krawe tz. Pro filing ge ne expressio n using onto-express. Genomics , 7 9(2):266– 270, 2 002. [22] J. L. Min, A. Barr ett, T. W atts, F. H. Pettersson, H. E. Lo ckstone, C. M. Lindgre n, J. M. T aylor, M. Allen, K. T. Z onderv an, and M. I. McCarthy . V aria bilit y of gene expression pro files in human blo o d a nd lymphoblastoid c ell lines. BMC Genomics , 1 1(1), 2010. [23] O mk a r Mura lidharan. An empir ic a l Bayes mixture method for effect size and false discov ery rate estimatio n. Annals of Applie d Statistics , 4 :4 22–43 8, 2010. [24] Y. Pa witan, K.R.K. Murthy , S. Michiels, and A. Ploner . Bias in the estimation of false discov e r y rate in micr oarray studies. Bioinformatics , 2 1:3865 –3872 , 2005. [25] F. Reyal, M. H. v an Vliet, N. J. Armstrong, H. M. Horling s, K. E. de Visser, M. Kok, A. E. T eschendorff, S. Mo ok, L. v an ’t V eer, C. Calda s , R. J. Salmo n, M. J. V. D. Vijver, and L. F. A. W essels . A comprehensive a na lysis of pr ognostic signa tur e s r eveals the hig h predictive capacity of the pr oliferation, immune resp onse and RNA splicing mo dules in breast cancer. Br e ast Canc er R ese ar ch , 10 (6 ), 2008 . [26] D. Scholtens, A. Miro n, F. M. Merchan t, A. Miller, P . L. Miron, J. D. Iglehart, and R. Gentle- man. Analyzing factor ia l desig ned microar ray exp eriments. Journal of Multivariate Analy sis , 90(1 SPEC. ISS.):19–43, 2004. [27] T.A. Severini. Likeliho o d Metho ds in Statistics . O xford Univ ersity Press, O xford, 2000. [28] J. D. Stor ey . The p ositive fals e disco very r ate: A Bayesian interpretation and the q-v alue. Annals of Statist ics , 3 1(6):2013 – 2035 , 20 03. [29] R.-L. W ang, D. Bencic, J. Lazo rchak, D. Villeneuve, and G. T. Ankley . T ra nscriptional reg- ulatory dyna mics of the hypothalamic-pituitary-g onadal axis and its pe ripheral pathw ays as impacted by the 3-b eta HSD inhibitor trilo stane in zebrafish ( danio r erio ). Ec otoxic olo gy and Envir onmental Safety , 7 4(6):1461 –1470 , 2011. 18 [30] Y. Y a ng and D. R. Bick el. Minimu m des cription length and empirica l Bay es metho ds o f iden- tifying SNPs asso ciated with diseas e. T e chnic al R ep ort, Ot t awa Institut e of Systems Biolo gy, COBRA Pr eprint Series, Article 74, biostats.b epr ess.c om/c obr a/ps/ art74 , 201 0. [31] B. R. Zeeb erg , W. F eng, G. W ang , M. D. W ang, A. T. F o jo, M. Sunshine, S. Narasimhan, D. W. K ane, W. C. Reinhold, S. Lababidi, K. J. Bussey , J. Ris s , J. C. Bar rett, and J. N. W einstein. Go miner: a r esource for biologica l interpretation of geno mic and proteomic data. Genome Biolo gy , 4(4), 2 003. 19
Original Paper
Loading high-quality paper...
Comments & Academic Discussion
Loading comments...
Leave a Comment