Improving genetic risk prediction by leveraging pleiotropy
An important task of human genetics studies is to accurately predict disease risks in individuals based on genetic markers, which allows for identifying individuals at high disease risks, and facilitating their disease treatment and prevention. Altho…
Authors: Cong Li, Can Yang, Joel Gelernter
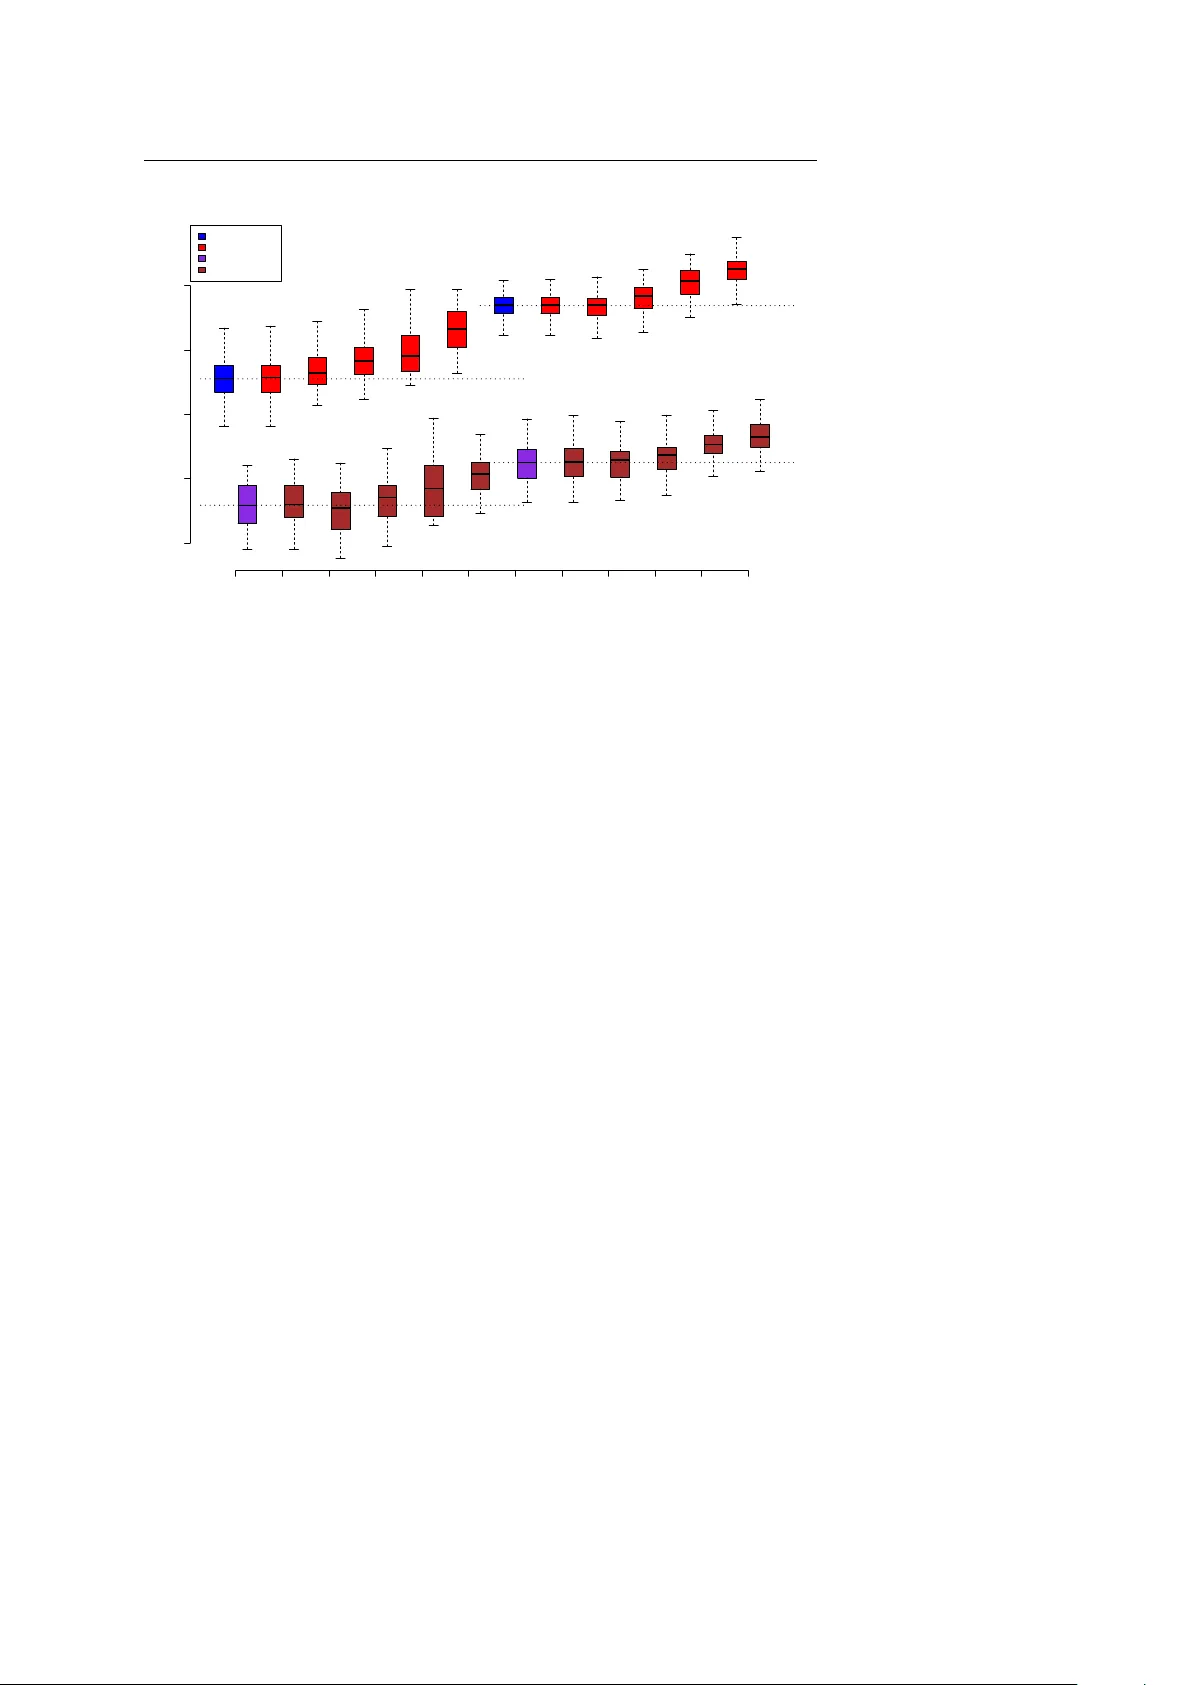
Noname man uscript No. (will b e inserted b y the editor) Impro ving genetic risk prediction b y lev eraging pleiotrop y Cong Li · Can Y ang · Jo el Gelernter · Hongyu Zhao Received: date / Accepted: date Abstract An imp ortant task of human genetics studies is to accurately pre- dict disease risks in individuals based on genetic mark ers, which allo ws for iden tifying individuals at high disease risks, and facilitating their disease treat- men t and preven tion. Although h undreds of genome-wide asso ciation studies (GW AS) ha ve been conducted on many complex human traits in recent years, there has b een only limited success in translating these GW AS data into clini- cally useful risk prediction mo dels. The predictive capabilit y of GW AS data is largely b ottleneck ed by the av ailable training sample size due to the presence of numerous v arian ts carrying only small to modest effects. Recen t studies ha v e sho wn that different human traits may share common genetic bases. There- fore, an attractive strategy to increase the training sample size and hence impro ve the prediction accuracy is to in tegrate data of genetically correlated Cong Li Program in Computational Biology and Bioinformatics, Y ale Universit y , New Haven, Con- necticut 06520, USA E-mail: cong.li@yale.edu Can Y ang Department of Biostatistics, Y ale School of Public Health, Y ale Universit y , New Haven, Connecticut 06520, USA Department of Psychiatry , Y ale Universit y School of Medicine, New Hav en, CT, USA E-mail: can.yang@y ale.edu Joel Gelernter Department of Psychiatry , Y ale Universit y School of Medicine, New Hav en, CT, USA V A CT Healthcare Center, Departments of Genetics and Neurobiology , Y ale Univ. School of Medicine, W est Hav en, Connecticut 06516, USA E-mail: jo el.gelern ter@yale.edu Hongyu Zhao (Corresp onding author) Department of Biostatistics, Y ale School of Public Health, Y ale Universit y , New Haven, Connecticut 06520, USA Program in Computational Biology and Bioinformatics, Y ale Universit y , New Haven, Con- necticut 06520, USA E-mail: hongyu.zhao@yale.edu 2 Cong Li et al. phenot yp es. Y et the utility of genetic correlation in risk prediction has not b een explored in the literature. In this pap er, we analyzed GW AS data for bip olar and related disorders (BARD) and schizophrenia (SZ) with a biv ari- ate ridge regression metho d, and found that join tly predicting the t w o phe- not yp es could substan tially increase prediction accuracy as measured b y the A UC (area under the r e c eiver op er ating char acteristic curve). W e also found similar prediction accuracy impro vemen ts when we jointly analyzed GW AS data for Crohn’s disease (CD) and ulcerative colitis (UC). The empirical ob- serv ations w ere substan tiated through our comprehensiv e sim ulation studies, suggesting that a gain in prediction accuracy can be obtained b y combining phenot yp es with relatively high genetic correlations. Through b oth real data and simulation studies, we demonstrated pleiotropy as a v aluable asset that op ens up a new opp ortunit y to improv e genetic risk prediction in the future. Keyw ords Genetic risk prediction · Genome-wide asso ciation study · Pleiotrop y · Ridge regression 1 Introduction Predicting disease risks in individuals based on genetic markers, which is usu- ally referred to as “genetic risk prediction”, is an imp ortan t task in human genetics studies [5]. Although hundreds of genome-wide asso ciation studies (GW AS) ha ve been conducted and man y thousands of genomic regions hav e b een implicated for v arious h uman traits in recent years, these findings ha ve not been translated in to clinically useful risk prediction models based on ge- netic markers, whic h limits their p otential impact on p ersonalized disease pre- v ention and treatment. Most genetic risk prediction mo dels, including those used b y direct-to-customer genetic testing companies, are constructed based on a few significant (usually v alidated) single nucleotide p olymorphisms (SNPs). Ho wev er, suc h SNPs t ypically accoun t for only a small fraction of the total her- itabilit y and thus cannot pro vide satisfactory prediction accuracy [23]. A large fraction of the genetic v ariances is not accounted by such genetic risk predic- tions b ecause they were “missing” in the SNPwise GW AS results [21]. Several h yp otheses hav e b een put forward to explain the “missing heritability” [7], including epistasis [4, 17], undetected CNVs [10], and rare v ariants [6], among others. Ho w ever, it has also b een suggested that m uc h of the missing heritabil- it y is in fact hidden among the numerous common genetic v arian ts carrying only small to modest effects [11, 33, 24]. Through a p olygenic risk-score an alysis on GW AS data of schizophrenia (SZ) and bip olar disorder (BP), Purcell et al [25] inferred that the genetic risk factors for SZ and BP may inv olv e thousands of common SNPs of v ery individually small effect sizes. Using a linear mixed mo del, Y ang et al [35] estimated that whole-genome common SNPs could ex- plain about 45% of the h uman height v ariance. Lee et al [19] extended this metho d to complex human diseases and also found that a substantial fraction of the phenot ypic v ariances could be explained by genotyped common SNPs. In this man uscript, we refer to the proportion of phenot ypic v ariance explained Improving genetic risk prediction by lev eraging pleiotropy 3 b y all genotyped c ommon SNPs as the “c hip heritability” [36], denoted as h 2 . These results suggest that, instead of building genetic prediction mo dels with only a few significant v arian ts, a more sensible approach would b e to imp ose less stringen t criteria on v ariant selection or even to build prediction mo dels using whole genome v ariants [3]. In this wa y , more v arian ts with weak effects can b e used though at the exp ense of also including many v ariants that do not affect the phenotype one wa y or the other, or even act in the opp osite effect direction. F ollowing Mako wsky et al [22], we refer to this class of meth- o ds as Whole Genome Prediction (WGP) metho ds. How ev er, there is still a significan t gap b etw een the prediction accuracy achiev ed and the genetic v ari- ance accounted by all common SNPs, even for the W GP metho ds [22]. These authors also in vestigated sev eral parameters that affect prediction accuracy and sho wed that a substan tial gain may be achiev ed b y increasing the training sample size, and using training samples that are more related to the testing samples. W ra y et al [34] also pointed out limited sample size as a b ottleneck to ac hieve accurate genetic risk predictions. These studies suggest that, in the presence of numerous weak-effect v ariants for most complex traits , one of the most effective wa ys to develop a more ac- curate risk prediction mo del is to increase the size of the training sample. But sub ject recruitment ma y b e difficult and expensive. Alternativ ely , if another phenot yp e shares some genetic v ariants that affect the primary phenotype of in terest, it might b e possible to incorp orate the av ailable data for this corre- lated phenot yp e in risk mo del developmen ts. In this wa y , we can increase the effectiv e training sample size with the cav eat that the additional samples are not directly related to the primary phenotype of in terest. Appropriate statis- tical methods are needed to join tly analyze these distinct yet related data sets. In fact, there is accum ulating evidence suggesting that different complex h uman traits are genetically correlated, i.e. m ultiple traits share common ge- netic bases, whic h is also formally known as “pleiotrop y”. In a systematic anal- ysis of the op en-access NHGRI catalog, 17% of the trait-asso ciated genes and 5% of the trait-asso ciated SNPs show ed pleiotropic effects [27]. V attikuti et al [32] used a biv ariate linear mixed mo del to analyze the Atherosclerosis Risk in Comm unities GW AS and found significan t genetic correlations betw een sev eral metab olic syndrome traits, including b o dy-mass index, waist-to-hip ratio, sys- tolic blo o d pressure, fasting glucose, fasting insulin, fasting trigylcerides, and fasting high-density lip oprotein. Lee et al [20] extended this biv ariate linear mixed mo del so that it could deal with binary traits, e.g. presence or absence of a disease. Andreassen et al [1] applied a “pleiotropic enrichmen t” metho d on GW AS data of schizophrenia and cardiov ascular-disease and show ed that the p o wer to detect schizophrenia-associated common v arian ts can b e impro ved b y exploiting the pleiotrop y b etw een these tw o phenotypes. More recen tly , a study on genome-wide SNP data for five psychiatric disorders in 33,332 cases and 27,888 con trols identified four significan t lo ci ( P < 5 × 10 − 8 ) affecting m ul- 4 Cong Li et al. tiple disorders, including t wo genes enco ding t wo L-type v oltage-gated calcium c hannel subunits, CACNA1C and CACNB2 [28]. Results from the large scale Collab orativ e Oncological Gene-en vironment Study also highligh ted the exis- tence of “carcinogenic pleiotropy”, i.e. the ov erlap b etw een lo ci that confer genetic susceptibilit y to multiple types of tumor [26]. All these findings are exciting b ecause they imply that genetic correlation are prev alent among complex human diseases and hence lev eraging the genetic correlations b etw een phenotypes migh t b e a promising strategy to impro ve genetic risk prediction in the future. Although genetic correlations ha ve b een extensiv ely studied for asso ciation analyses [18, 16], little atten tion has been paid to their utility in genetic risk prediction. In this pap er, we prop ose to use a biv ariate ridge regression method to lev erage the genetic correlation betw een t wo diseases in genetic risk prediction. W e analyzed real GW AS data sets for t wo pairs of related common diseases. W e p erformed a comprehensiv e simu- lation study on the utility of genetic correlation b y in v estigating the gain of prediction accuracy as a function of the strength of genetic correlation b etw een t wo traits. W e also examined the effects of several other parameters suc h as the “c hip heritability” h 2 , the training sample size and the num ber/prop ortion of causal SNPs. 2 Metho ds In this study , four dbGap data sets were analyzed. W e didn’t obtain the con- sen t from the participants b ecause we downloaded the data indirectly from database. Moreo ver, the data were analyzed anonymously . F or tw o of the db- Gap datasets, we obtained the approv al of the institutional review b oard. F or the other tw o data sets, institutional review b oard approv al is not required to access the data sets. Data Description W e downloaded a GW AS data set of bip olar and related disorders (BARD) and a GW AS data set of schizophrenia (SZ) from the dbGaP database ( https:// dbgap.ncbi.nlm.nih.gov ). All the sub jects were genotyped on the Affymetrix Genome-Wide Human SNP Arra y 6.0 platform. See http://www.ncbi.nlm. nih.gov/projects/gap/cgi- bin/study.cgi?study_id=phs000017.v3.p1 and http://www.ncbi.nlm.nih.gov/projects/gap/cgi- bin/study.cgi?study_ id=phs000021.v3.p2 for more details. W e merged the tw o data sets after re- mo ving redundan t sub jects and collected the genotype data for sub jects with only Europ ean ancestry . The merged data set consists of 653 affected sub jects for BARD, 1170 affected sub jects for SZ and 1403 controls. SNPs with mi- nor allele frequency (MAF) smaller than 0.05 and missing rate greater than Improving genetic risk prediction by lev eraging pleiotropy 5 0.01 were excluded. The remaining missing genotypes were randomly drawn from binomial distributions based on the allele frequencies at the giv en lo ci. SNPs that failed the Hardy-W einberg Equilibrium test ( P < 0 . 0001) in either BARD, SZ or control group were also excluded. W e also p erformed link age- disequilibrium pruning so that every pair of SNPs within a 50-SNP window had an R-squared v alue no greater than 0.8. After these pro cedures, 298,604 SNPs remained. F or the second pair of diseases, w e do wnloaded a GW AS data set of Crohn’s disease (CD) and a GW AS data set of ulcerative colitis (UC). The sub jects in the CD data set w ere genot yp ed on the ILLUMINA HumanHap300v1.1 plat- form. See http://www.ncbi.nlm.nih.gov/projects/gap/cgi- bin/study.cgi? study_id=phs000130.v1.p1 for more details. UC sub jects were genot yp ed on either the ILLUMINA HumanHap300v2 or the HumanHap550v3 platform. See http://www.ncbi.nlm.nih.gov/projects/gap/cgi- bin/study.cgi?study_ id=phs000345.v1.p1 for more details. Since the SNPs on the HumanHap300v1.1 platform are a subset of the SNPs on the other tw o platforms, w e retained only the HumanHap300v1.1 SNPs in all the data sets for further analysis. In the CD data set, only sub jects with non-Jewish, European ancestry w ere included in analysis, which include of 515 unaffected sub jects and 513 af- fected sub jects. The UC data set consists of 902 non-Hispanic, Europ ean an- cestry , affected individuals. T o hav e a genetically matc hed control data set for UC, we downloaded all the Caucasian sub jects that hav e genotypes from the HumanHap300v1.1 SNPs from the ILLUMINA iControl database ( http: //www.illumina.com/science/icontroldb.ilmn ). W e p erformed principal comp onen t analysis on the iControl samples and the UC samples. F or each UC sample, w e selected an iCon trol sample with the smallest Euclidean dis- tance b etw een their first 20 principal comp onents. SNPs that were o v erlapp ed b et ween all these data sets w ere used for analysis after excluding SNPs with minor allele frequency smaller than 0.05 and missing rate greater than 0.01. The remaining missing genotypes were randomly drawn from binomial distri- butions based on the allele frequencies at the given lo ci. SNPs that failed the Hardy-W einberg Equilibrium test ( P < 0 . 0001) in either data set w ere also excluded. W e also p erformed link age-disequilibrium pruning so that every pair of SNPs within a 50-SNP window had an R-squared v alue no greater than 0.8. After these pro cedures, 241,649 SNPs remained. Biv ariate Ridge Regression T o tak e adv antage of the pleiotrop y , w e used a biv ariate ridge regression metho d to predict jointly the status for tw o diseases. In fact, the biv ariate (or multiv ariate) ridge regression was motiv ated as a generalization of univ ari- ate ridge regression to accoun t for the “across regression” correlations when m ultiple linear regressions are sim ultaneously considered [2, 13]. Similar to the relationship b etw een the univ ariate ridge regression and the univ ariate linear 6 Cong Li et al. mixed model, the biv ariate ridge regression is also closely related to the biv ari- ate linear mixed mo del, which has been implemen ted to estimate the genetic correlation b etw een phenotypes recently [20]. Here w e highlight this connec- tion while w e go through the formulation of biv ariate ridge regression. Consider the follo wing biv ariate linear mixed mo del[30]: y ( 1 ) = X ( 1 ) β ( 1 ) + g ( 1 ) + e ( 1 ) , y ( 2 ) = X ( 2 ) β ( 2 ) + g ( 2 ) + e ( 2 ) (1) where y ( 1 ) and y ( 2 ) are the tw o vectors of t w o phenot ypes measured on n 1 and n 2 individuals, respectively . In this study , X ( 1 ) and X ( 2 ) consist of only a column of ones resp ectiv ely , indicating that only the intercept is included as fixed effect. In this case, β (1) and β (2) are simply the means of the tw o phenot yp es. In the rest of this paper, we assume that y ( 1 ) and y ( 2 ) are already mean-subtracted for con venience. g ( 1 ) and g ( 2 ) are the genetic v alues for the t wo phenotypes. e ( 1 ) and e ( 2 ) are the residuals. The genetic v alues g ( 1 ) and g ( 2 ) are treated as random effects: g ( 1 ) = G ( 1 ) u ( 1 ) , g ( 2 ) = G ( 2 ) u ( 2 ) (2) " u ( 1 ) j u ( 2 ) j # ∼ N ( 0 , Σ g ) (3) Σ g = σ 2 g 1 ρ g σ g 1 σ g 2 ρ g σ g 1 σ g 2 σ 2 g 2 (4) where G ( t ) is the standardized genotype matrix for a total of p SNPs of the training samples for the t -th phenotype. Specifically , let B and b be the tw o alleles at the j -th lo cus and f j b e the frequency of the B allele, then G ( t ) ij tak es a v alue of − 2 f j / p 2 f j (1 − f j ) p , (1 − 2 f j ) / p 2 f j (1 − f j ) p or 2(1 − f j ) / p 2 f j (1 − f j ) p if the genotype of the i -th individual at the j -th lo- cus is bb , B b or B B , respectively . u ( 1 ) j and u ( 2 ) j are the random effects of the j -th lo cus for the tw o phenotypes and ρ g measures the strength of genetic correlation b etw een the t w o phenotypes. W e also assume the residuals follow a m ultiv ariate normal distribution: e ( 1 ) e ( 2 ) ∼ N ( 0 , Σ e ) (5) Σ e = σ 2 e 1 I n 1 0 0 σ 2 e 2 I n 2 . (6) In Lee et al.[20], the random effects u ( 1 ) , u ( 2 ) , e ( 1 ) and e ( 2 ) w ere in tegrated out and the a verage information restricted maximum lik eliho o d (AI-REML) algorithm [12] was used to e stimate the v ariance parameters σ 2 g 1 , σ 2 g 2 , ρ g , σ 2 e 1 , σ 2 e 2 . ρ g measures the genetic correlation b etw een the t wo phenotypes whereas Improving genetic risk prediction by lev eraging pleiotropy 7 the other four v ariance parameters can be used to calculate the “c hip” heri- tabilit y or “v ariance explained by SNPs” for the t w o phenot yp es. Ho wev er, our fo cus here is not to estimate the “chip heritability” or the genetic correlation but to predict the phenotypes. Therefore we are more interested in estimating the random effects: u ( 1 ) and u ( 2 ) . Given a certain set of v ariance parameters σ 2 g 1 , σ 2 g 2 , ρ g , σ 2 e 1 and σ 2 e 2 , the posterior means of the random effects u ( 1 ) and u ( 2 ) can b e written out as: ˆ u ( 1 ) ˆ u ( 2 ) = (( Σ g ⊗ I p ) − 1 + G 0 Σ − 1 e G ) − 1 G 0 Σ − 1 e y ( 1 ) y ( 2 ) (7) where G = G ( 1 ) 0 0 G ( 2 ) and ⊗ stands for the Kroneck er pro duct. After some rearrangemen ts, w e can see that this is essen tially equiv alen t to the solution to a biv ariate ridge regression given a certain set of regularization parameters: ˆ u ( 1 ) ˆ u ( 2 ) = ( K ⊗ I p + G 0 G ) − 1 G 0 y ( 1 ) y ( 2 ) (8) where K = (1 − ρ 2 g ) − 1 σ 2 e 1 /σ 2 g 1 − ρ g σ 2 e 2 / ( σ g 1 σ g 2 ) − ρ g σ 2 e 1 / ( σ g 1 σ g 2 ) σ 2 e 2 /σ 2 g 2 is the “ridge ma- trix” as defined in Bro wn and Zidek[2]. W e note that directly calculating Eq. (8) is infeasible because it in v olv es in version of a 2 p b y 2 p matrix where p is total num ber of SNPs, which could b e in the order of 10 6 in a typical GW AS. Therefore we used the matrix inv ersion lemma to rearrange it as: ˆ u ( 1 ) ˆ u ( 2 ) = ( K − 1 ⊗ I p ) G 0 [ I ( n 1 + n 2 ) + G ( K − 1 ⊗ I p ) G 0 ] − 1 y ( 1 ) y ( 2 ) (9) where K − 1 = σ 2 g 1 /σ 2 e 1 ρ g σ g 1 σ g 2 /σ 2 e 1 ρ g σ g 1 σ g 2 /σ 2 e 2 σ 2 g 2 /σ 2 e 2 . No w we only need to ev aluate the inv erse of a matrix of dimension ( n 1 + n 2 ) by ( n 1 + n 2 ), which is usually in the order of 10 3 . Giv en the estimates of the random effects ˆ u ( 1 ) and ˆ u ( 2 ) and t wo sets of v alidation individuals with standardized genot ype matrix G ( 1 ) v and G ( 2 ) v , the predicted v alues for the tw o phenotypes are given by: ˆ y ( 1 ) = G ( 1 ) v ˆ u ( 1 ) , ˆ y ( 2 ) = G ( 2 ) v ˆ u ( 2 ) (10) The solution of the biv ariate ridge regression dep ends on four regularization parameters. T o alleviate the computational burden of tuning the regulariza- tion parameters, we imp ose the constraint that σ e 1 = σ e 2 , which leads to a symmetric “ridge matrix” K and hence a symmetric K − 1 . Then we can repa- rameterize K − 1 as λ 1 ρ g √ λ 1 λ 2 ρ g √ λ 1 λ 2 λ 2 . As a result, we only need to tune three regularization parameters λ 1 , λ 2 and ρ g . λ 1 and λ 2 con trol the shrink age 8 Cong Li et al. lev el of genetic effects for the tw o phenotypes whereas ρ g con trols the correla- tion b etw een the genetic effects b etw een the tw o phenotypes. In order to find the optimal regularization parameters, we p erform grid searches with λ 1 and λ 2 ranging from a very small num ber λ min to a v ery large num b er λ max and ρ g ∈ [0 , 1). In the real data analysis, the parameter v alues that give the highest cross-v alidation mean AUC for each phenot ype were c hosen. In the simulation studies, the parameter v alues that giv e the highest A UC in the v alidation data for eac h phenotype were chosen. W e classify the v alidation individuals into affected ones and unaffected ones b y dichotomizing the predicted v alues with a grid of threshold v alues ranging from the largest predicted v alue to the smallest predicted v alue and obtain the r e c eiver op er ating char acteristic curve b y ev aluating the sensitivity and sp ecificit y at eac h threshold v alue. Then w e ev aluate the area under r e c eiver op er ating char acteristic curv e (AUC) as a measure of the prediction accuracy . In the biv ariate ridge regression, we used cross-v alidation to tune the reg- ularization parameters instead of trying to estimate the parameters from the data as in [20]. There are primarily tw o reasons: 1) the AI-REML algorithm that Lee et al. used in [20] sometimes fails to conv erge, for example on the CD-UC data set. 2) The estimated parameters are based on normality assump- tions and henceforth ma y not b e optimal for predicting binary phenotypes. Sim ulation Study In order to examine the relationship b etw een the gain of predictive p ow er and the level of genetic correlation b etw een tw o diseases, we p erformed the follow- ing sim ulation studies based on the classical liability threshold mo del [8] to sim ulate the case-control data. Sp ecifically , given a desired sample size N , the total n um b er of SNPs p , the proportion of cases in the case-control data P and the disease prev alence Q , genotypes of a cohort of at least N P /Q individuals w ere generated as follows: first, the MAF of p SNPs were uniformly drawn from [0 . 05 , 0 . 5]; then the genotypes (the num b er of minor allele copies) for the N P /Q individuals at each SNP were drawn from a binomial distribution of size tw o and the probabilit y of success b eing the MAF of the corresp onding SNP . After the genot yp es were generated, m casual SNPs were randomly chosen with each causal SNP carrying a p er-minor-allele effect drawn from a normal distribution with zero mean and v ariance of h 2 (1 − h 2 ) f j (1 − f j ) m where h 2 is the desired level of v ariance explained b y all SNPs on the liability scale and f j is the MAF of the corresp onding causal SNP . Then the environmen tal effect on the liability scale for each individual was indep endently dra wn from a stan- dard normal distribution (zero mean and unit v ariance). Then, w e obtained Improving genetic risk prediction by lev eraging pleiotropy 9 the liability for eac h individual b y adding up the genetic effects conferred b y all causal SNPs and en vironmental effect. Once the liabilities were obtained, individuals with liabilities greater than the 1 − Q quantile w ere classified as cases and the others classified as con trols. Then N P cases and N (1 − P ) con- trols were randomly drawn from the cohort. When sim ulating data for tw o diseases simultaneously , the tw o data set were simulated from tw o disjoint co- horts. The MAF for each SNP w as the same for the tw o cohorts. A total of m 0 causal SNPs w ere c hosen to be shared b etw een the t wo diseases to mimic the shared genetic basis b etw een them. W e assume shared causal SNPs hav e a correlation of 0.8 b etw een their liabilit y scale effect sizes in the tw o diseases. In our simulation studies, we set the sample size N at 1,000 or 2,000. The n umber of causal SNPs m was chosen to b e 1,000 or 2,000. P w as fixed at 0.5 and K w as fixed at 0.05. W e assumed the tw o diseases had the same num b er of casual SNPs. W e v aried the prop ortion of the causal SNPs that were shared b et ween the t w o diseases γ = m 0 /m from 0 to 1 to mo del different lev els of ge- netic correlation and inv estigated the gain of predictive p ow er under different settings. W e also inv estigated the effects of unequal sample size and unequal h 2 b et ween the t wo diseases. 3 Results Results from Real Data W e analyzed GW AS data for bip olar and related disorders (BARD) and sc hizophre- nia (SZ) that we do wnloaded from the dbGaP database ( https://dbgap. ncbi.nlm.nih.gov ). After pre-processing (see Metho ds), the com bined data set consisted of 3,226 individuals (653 cases for BARD, 1,170 cases for SZ and 1,403 con trols) with genot yp es at 298,604 SNPs. In order to organize tw o case- con trol data sets for the tw o diseases, w e randomly partitioned the controls in to tw o disjoint sets of individuals and assigned eac h set to one of the dis- eases. W e partitioned the con trol individuals so that the proportions of cases for the tw o data sets w ere appro ximately equal, i.e. w e assigned 505 con trols to BARD and 898 con trols to SZ. The random partitioning was rep eated 50 times. W e then used the biv ariate ridge regression metho d [2] describ ed ab ov e to predict join tly the disease status for BARD and SZ using this data set. Pre- diction p erformance w as ev aluated through five-fold cross-v alidation, i.e., the data w ere randomly partitioned into five equal-sized folds and four of them w ere used as the training set and the other one was used as the v alidation set eac h time. W e calculated the mean AUC (area under the r e c eiver-op er ating- char acteristic curv e) for the fiv e folds to measure prediction p erformance. F or comparison, we also ev aluated prediction p erformance of three other predic- tion methods: univ ariate ridge regression, SVM (supp ort v ector mac hine) [9] 10 Cong Li et al. with linear kernel, and LASSO (least absolute shrink age and selection opera- tor) [31] that treat each disease separately (Figure 1). Note that the biv ariate ridge regression metho d we used is a direct generalization of the univ ariate ridge regression (see Metho ds). Therefore the utility of pleiotropy can b e b est demonstrated through the comparison b etw een the tw o approaches. Indeed, the biv ariate ridge regression metho d p erformed b etter than the univ ariate ridge regression for both BARD and SZ. W e also note that the gain of AUC of BARD (0.041) was muc h larger than that of SZ (only 0.013), probably as a result of the sample size difference b et ween the tw o diseases. SVM also p er- formed better than univ ariate ridge regression, but it w as still outp erformed b y biv ariate ridge regression in BARD (with an AUC of 0.031) although in SZ it performed b etter than biv ariate ridge regression by 0.016. LASSO, whic h prefers a sparse genetic arc hitecture with a small num b er of ma jor (strong effect) SNPs, did not p erform w ell for b oth diseases. BVR(0.587) UVR(0.546) SVM(0.556) LASSO(0.522) 0.50 0.55 0.60 0.65 BARD AUC BVR(0.613) UVR(0.600) SVM(0.629) LASSO(0.541) 0.50 0.55 0.60 0.65 Schizophrenia AUC Fig. 1 Prediction accuracy of different methods on the BARD-SZ data. “BVR” and “UVR” stand for biv ariate ridge regression and univ ariate ridge regression respectively . The n umbers in the brack ets are the mean AUCs ac hiev ed by e ac h metho d in the 50 rep eats. T o ev aluate whether the improv emen t was the result of the genetic correla- tion b etw een BARD and SZ or an artificial effect of the biv ariate ridge regres- sion method, we randomly selected 25%, 50%, 75% and all of the SNPs and sh uffled their iden tities in the BARD samples while k eeping the SNP identities unc hanged in the SZ samples. This led to reduced genetic correlation b etw een BARD and SZ and consequently reduced improv emen t of prediction accuracy for the biv ariate ridge regression (Figure 2). In particular, when all the SNPs w ere shuffled, the p erformance of biv ariate ridge regression was almost the same as univ ariate ridge regression, confirming that the gain of prediction ac- curacy of the biv ariate ridge regression indeed came from specific SNP , and Improving genetic risk prediction by lev eraging pleiotropy 11 th us the genetic correlation b etw een the tw o phenotypes. 0% 25% 50% 75% 100% UVR 0.50 0.55 0.60 0.65 BARD AUC 0% 25% 50% 75% 100% UVR 0.50 0.55 0.60 0.65 Schizophrenia AUC Fig. 2 Prediction accuracy of the biv ariate ridge regression after shuffling the SNP identities and of ridge regression. Red plots represent the results of biv ariate ridge regression and blue plots represen t those of ridge regression. The percentage b elow eac h red plot represents the fraction SNPs that were sh uffled. W e also did the same analysis on a GW AS data set for Crohn’s disease (CD) and a GW AS data set for ulcerative colitis (CD) obtained from the dbGap database. The CD data set consists of 515 unaffected sub jects and 513 affected sub jects with non-Jewis h Europ ean ancestry and the UC data set consists of 902 affected sub jects with non-Jewish Europ ean ancestry . Because there are no con trol samples for the UC data set, w e obtained 902 samples from the Illumina iCon trol database ( http://www.illumina.com/science/icontroldb.ilmn ) that were genetically matched with the UC samples to minimize the con- founding effect of p otential population stratification (see Metho ds). After pre- pro cessing (see Metho ds), we obtained a data set consisting of 513 affected sub jects for CD, 515 unaffected sub jects for CD, 902 affected sub jects for UC and 902 unaffected sub jects for UC with genot yp es for 241,649 SNPs. As op- p osed to the BARD and SZ data set, the control samples for CD and UC w ere fixed instead of b eing randomly partitioned. Prediction accuracies of different metho ds on the CD-UC data set were also ev aluated through five-fold cross-v alidation, with the cross-v alidation re- p eated 50 times. The results are sho wn in Figure 3. Similar to the results for the BARD-SZ data, biv ariate ridge regression p erformed b etter than univ ari- ate ridge regression in b oth diseases. Moreov er, the increase of A UC for CD, whic h has a smaller sample size, was larger than that of UC (0.055 v ersus 0.019). SVM also outp erformed univ ariate ridge regression in b oth diseases 12 Cong Li et al. but w as outp erformed by biv ariate ridge regression in CD. BVR(0.663) UVR(0.608) SVM(0.646) LASSO(0.585) 0.55 0.60 0.65 0.70 CD AUC BVR(0.620) UVR(0.601) SVM(0.635) LASSO(0.635) 0.55 0.60 0.65 0.70 UC AUC Fig. 3 Prediction accuracy of different metho ds on the CD-UC data. “BVR” and “UVR” are defined as in Figure 1. The num bers in the brack ets are the mean AUCs achieved by each metho d in the 50 repeats. Similar to the BARD-SZ data set, we performed random shuffling of the iden tities of the SNPs in the CD samples while k eeping their identities in the UC samples. The results are sho wn in Figure 4. As exp ected, the improv ement of prediction accuracy of biv ariate ridge regression also decreases as the frac- tion of SNPs increases and ev entually diminishes when all SNPs are shuffled. Results from Sim ulation Study W e simulated data sets for tw o genetically correlated diseases to ev aluate the utilit y of genetic correlation in genetic risk prediction. W e simulated a total of p = 20 , 000 SNPs. W e let the sample size N to b e 1000 or 2000. The n um- b er of causal SNPs m was also chosen to b e 1000 or 2000. W e assumed the t wo traits had the same num b er of casual SNPs. W e v aried the prop ortion of the causal SNPs that w ere shared betw een the tw o diseases γ from 0 to 1 to mimic different levels of genetic correlation. W e assumed that the shared causal SNPs had a correlation of 0 . 8 b etw een their effect sizes on the tw o diseases. Our empirical results suggest that the realized genetic correlation is appro ximately 0 . 8 γ under this setup (results not shown). W e sim ulated t w o h 2 lev els (on liability scale, see [19]): 0 . 3 and 0 . 6. Disease prev alence was set to be 0 . 05 and equal num b ers of cases and con trols w ere dra wn from the simulated p opulation. The simulations were rep eated for 25 times in each scenario. In eac h rep eat, a training set and a v alidation set were indep endently generated Improving genetic risk prediction by lev eraging pleiotropy 13 0% 25% 50% 75% 100% UVR 0.55 0.60 0.65 0.70 CD AUC 0% 25% 50% 75% 100% UVR 0.55 0.60 0.65 0.70 UC AUC Fig. 4 Prediction accuracy of the biv ariate ridge regression after shuffling the SNP identities and of ridge regression. Red plots represent the results of biv ariate ridge regression and blue plots represen t those of the ridge regression. The p ercentage below each red plot represents the fraction SNPs that were sh uffled. and were used to ev aluate the prediction accuracies of biv ariate ridge regres- sion and univ ariate ridge regression. W e first considered the scenario where b oth diseases had the same num b er of samples and the same h 2 lev el. The results for m = 1000 are sho wn in Figure 5 and the result for m = 2000 are shown in Figure S1. As exp ected, when the genetic correlation b etw een the t wo diseases w as zero, the prediction accuracy of biv ariate ridge regression was almost the same as univ ariate ridge regression. As the genetic correlation increased, the A UC for biv ariate ridge regression also increased and the improv ement o v er univ ariate ridge regression b ecame quite noticeable as long as γ ≥ 0 . 5, which corresp onds to a genetic correlation of appro ximately 0.4. W e also examined the case when the sample sizes (Figure 6 and Figure S2) or the h 2 lev els (Figure 7 and Figure S3) were di fferent betw een the tw o traits. When the sample sizes were different but the h 2 lev els w ere the same b etw een the tw o diseases, the prediction acc uracy of the disease with the smaller sam- ple size improv ed more than that of the disease with the larger sample size by join t mo deling, which ec ho es with the results from the real data analysis. 4 Discussion Genetic risk prediction is a challenging task due to the existence of n umerous w eak-effect v ariants and is also b ottleneck ed by the a v ailable sample size of 14 Cong Li et al. ● ● ● ● ● ● ● Equal h^2, Equal Sample Size, m = 1000 gamma AUC UVR, h^2 = 0.6 BVR, h^2 = 0.6 UVR, h^2 = 0.3 BVR, h^2 = 0.3 0.60 0.65 0.70 0.75 0.80 N=1000 0 0.25 0.5 0.75 1 N=2000 0 0.25 0.5 0.75 1 Fig. 5 Simulation results for the case when the t w o diseases hav e equal sample sizes and h 2 levels and m = 1000. “BVR” and “UVR” are defined as in Figure 1. Tw o h 2 levels (0 . 3 and 0 . 6) and two sample sizes (1000 and 2000) w ere sim ulated. The prop ortion of shared causal SNPs, γ was v aried from 0 to 1 with an incremen t of 0 . 25. The numbers b elow the UVR box plots are the sample sizes. F ollowing the UVR box plots are the box plots representing the results of BVR with the same sample sizes at differen t γ values (below the BVR box plots). GW AS. A promising y et under-appreciated strategy to increase the effectiv e training sample size and th us to impro ve prediction accuracy is to in tegrate dis- eases that are genetically correlated. In this pap er we p erformed a systematic in vestigation of the utility of genetic correlation in genetic risk prediction using a biv ariate ridge regression method. In the real data analysis, we demonstrated that gain of predictive p ow er can b e achiev ed by using the genetic correlation b et ween phenotypes. In the simulation study , the results confirmed our find- ings in the real data, as well as offered us insights in to the relationship betw een gain of prediction accuracy and the lev el of genetic correlation b et ween t w o phenot yp es. These results can pro vide imp ortant guide for researchers to mak e pro ductiv e use of pleiotropy while developing disease risk prediction mo dels in the future. In the real data and simulation studies, we found that the prediction accu- racy of the disease with the smaller sample size b enefited more from the join t mo deling than that of the disease with the larger sample size. The p ossible reason is that when jointly mo deling the t wo data sets, the larger data set con- tains more information or statistical evidence ab out the genetic effects shared b y the tw o diseases than the smaller data set, and therefore more information can b e b orrow ed from the larger data set to the smaller data set than the op- Improving genetic risk prediction by lev eraging pleiotropy 15 ● ● ● ● ● ● ● ● ● ● ● ● Equal h^2, Unequal Sample Size, m = 1000 gamma AUC UVR, N = 2000 BVR, N = 2000 UVR, N = 1000 BVR, N = 1000 0.60 0.65 0.70 0.75 0.80 h^2=0.3 0 0.25 0.5 0.75 1 h^2=0.6 0 0.25 0.5 0.75 1 Fig. 6 Simulation results for the case when the tw o diseases ha v e unequal sample sizes and equal h 2 levels and m = 1000. “BVR” and “UVR” are defined as in Figure 1. One of the diseases has 2000 samples and the other has 1000 samples. Two h 2 levels (0 . 6 and 0 . 3) were simulated. The prop ortion of shared causal SNPs, γ was v aried from 0 to 1 with an increment of 0 . 25. The numbers b elow the UVR b ox plots are the h 2 levels. F ollo wing the UVR b ox plots are the results of BVR with the same h 2 levels at differen t γ v alues (b elow the BVR b ox plots). p osite wa y . In the sim ulation studies, w e also observed that when the sample sizes were the same but the h 2 lev els w ere different, join t mo deling offered more benefit to the low-heritabilit y disease than that of the high-heritabilit y disease. A similar explanation can b e made: the high-heritability disease data set can pro vide stronger statistical evidence ab out the genetic effects shared b y the tw o diseases than the lo w-heritability disease. Note that the t wo ex- planations are based on the sim ulation setup that the num b er of asso ciated SNPs is the same for the tw o diseases, all the SNPs are indep endent, and the genetic effects are randomly distributed among the causal SNPs. T o our knowledge, only Hartley et al [14, 15] hav e studied pleiotropy in ge- netic risk prediction to date. How ev er, our study is distinct from theirs in tw o asp ects. Firstly , Hartley et al. focused on methodological dev elopmen t whereas our study emphasizes the utility of genetic correlation using real GW AS data sets. In fact, our study is the first one to demonstrate a substan tial contribu- tion of genetic correlation to prediction accuracy on real data. Secondly , their metho d requires that all the phenot ypes of interest are observ ed on all individ- uals, which limits its applications. In contrast, w e consider the case where tw o phenot yp es are observed on tw o disjoint sets of individuals. Not only do es this 16 Cong Li et al. ● ● ● ● ● ● ● ● Unequal h^2, Equal Sample Size, m = 1000 gamma AUC UVR, h^2 = 0.6 BVR, h^2 = 0.6 UVR, h^2 = 0.3 BVR, h^2 = 0.3 0.60 0.65 0.70 0.75 0.80 N=1000 0 0.25 0.5 0.75 1 N=2000 0 0.25 0.5 0.75 1 Fig. 7 Sim ulation results for the case when the tw o diseases hav e equal sample sizes and unequal h 2 levels and m = 1000. “BVR” and “UVR” are defined as in Figure 1. One of the diseases has h 2 = 0 . 6 and the other has h 2 = 0 . 3. Two sample sizes (2000 and 1000) were simulated. The prop ortion of shared causal SNPs, γ was v aried from 0 to 1 with an increment of 0 . 25. The num b ers b elow the UVR b ox plots are the sample sizes. F ollowing the UVR b ox plots are the results of BVR with the same sample sizes at different γ v alues (below the BVR b ox plots). allo w more GW AS data sets to be integrated, we can exp ect m uc h more im- pro vemen t of the predictive abilit y since the sample size is effectiv ely increased b y combining the data for the tw o phenotypes whereas there is no increase in the sample size in the scenario considered by Hartley and colleagues. In addi- tion, even when w e ha ve phenotype information from multiple traits for each study sub ject, the biv ariate mixed effect mo del may not appropriately accom- mo date sp ecific, sometimes complex, ascertainment schemes used to collect the GW AS samples. This may lead to p otential biases and reduced prediction accuracy , e.g. causing some shared genetic effects b etw een the tw o traits to b e cancelled out. Solo vieff et al [29] p ointed out several sources of spurious pleiotrop y . One is sample ascertainment bias. In our real data examples, eac h “case” individual is affected by only one disease and the controls are not shared b y the tw o diseases. Therefore, it is unlikely that our study is affected b y ascertainmen t bias. Another source is misdiagnosis, e.g. p eople with sc hizophrenia ma y b e misclassified as bip olar disorder. How ever they also noted that the misclassi- fication rate has to b e very high to generate a substan tial genetic correlation, whic h suggests the gain of prediction accuracy in our results may still primar- Improving genetic risk prediction by lev eraging pleiotropy 17 ily b e a result of the true genetic correlation b etw een the tw o diseases. The metho d that we used to jointly predict tw o phenotypes is a biv ari- ate generalization to the ridge regression. Although the comparison betw een biv ariate ridge regression and univ ariate suggests that pleiotropy can indeed substan tially contribute to genetic risk prediction, we do note that there is also a need to develop b etter metho ds for joint prediction of multiple pheno- t yp es. F or example, SVM alwa ys do es b etter than univ ariate ridge regression. Dev elopment of such methods that join tly predict m ultiple phenotypes is an imp ortan t future task. In this study , we demonstrated the utility of pleiotropy through tw o pairs of diseases that are known to share a lot of common genetic bases. Another imp ortant future task is to comprehensiv ely examine the ge- netic correlations b etw een other complex human diseases and their utility in risk prediction. Ac knowledgemen ts This study w as supported by NIH grants R01 AA11330, AA017535, DA030976, GM59507, V A Co operative Studies Program 572, and a fellowship from China Scholarship Council. W e also thank Y ale University High Performance Computing Center (funded by NIH RR19895) for the computation resource and data storage. F unding support for the Whole Genome Association Study of Bip olar Disorder was pro- vided by the National Institute of Mental Health (NIMH) and the genotyping of samples was pro vided through the Genetic Asso ciation Information Netw ork (GAIN). The datasets used for the analyses describ ed in this manuscript were obtained from the database of Genotypes and Phenotypes (dbGaP) found at h ttp://www.ncbi.nlm.nih.gov/gap through dbGaP accession num ber phs000017.v3.p1. Samples and associated phenotype data for the Collaborative Genomic Study of Bip olar Disorder were pro vided by the The NIMH Genet- ics Initiativ e for Bipolar Disorder. Data and biomaterials w ere collected in four pro jects that participated in NIMH Bipolar Disorder Genetics Initiative. F rom 1991-98, the Prin- cipal Inv estigators and Co-Investigators were: Indiana University , Indianap olis, IN, U01 MH46282, John Nurnberger, M.D., Ph.D., Marvin Miller, M.D., and Elizabeth Bo wman, M.D.; W ashington Universit y , St. Louis, MO, U01 MH46280, Theo dore Reich, M.D., Alli- son Goate, Ph.D., and John Rice, Ph.D.; Johns Hopkins Univ ersity , Baltimore, MD U01 MH46274, J. Raymond DePaulo, Jr., M.D., Sylvia Simpson, M.D., MPH, and Colin Stine, Ph.D.; NIMH In tramural Research Program, Clinical Neurogenetics Branch, Bethesda, MD, Elliot Gershon, M.D., Diane Kazuba, B.A., and Elizab eth Maxwell, M.S.W. Data and bio- materials w ere collected as part of ten pro jects that participated in the NIMH Bipolar Disorder Genetics Initiative. F rom 1999-03, the Principal Inv estigators and Co-Inv estigators were: Indiana Universit y , Indianap olis, IN, R01 MH59545, John Nurnberger, M.D., Ph.D., Marvin J. Miller, M.D., Elizab eth S. Bo wman, M.D., N. Leela Rau, M.D., P . Ryan Mo e, M.D., Nalini Samav edy , M.D., Rif El-Mallakh, M.D. (at Universit y of Louisville), Husseini Manji, M.D. (at W ayne State Universit y), Debra A. Glitz, M.D. (at W ayne State Uni- versit y), Eric T. Meyer, M.S., Carrie Smiley , R.N., T atiana F oroud, Ph.D., Leah Flury , M.S., Danielle M. Dick, Ph.D., Ho ward Edenberg, Ph.D.; W ashington Universit y , St. Louis, MO, R01 MH059534, John Rice, Ph.D, Theo dore Reich, M.D., Allison Goate, Ph.D., Laura Bierut, M.D. ; Johns Hopkins Universit y , Baltimore, MD, R01 MH59533, Melvin McInnis M.D. , J. Raymond DePaulo, Jr., M.D., Dean F. MacKinnon, M.D., F rancis M. Mondimore, M.D., James B. P otash, M.D., Peter P . Zandi, Ph.D, Dimitrios Avramopoulos, and Jen- nifer Pa yne; Universit y of Pennsylv ania, P A, R01 MH59553, W ade Berrettini M.D.,Ph.D. ; Universit y of California at Irvine, CA, R01 MH60068, William Byerley M.D., and Mark V a wter M.D. ; Univ ersit y of Io wa, IA, R01 MH059548, William Coryell M.D. , and Ra ymond Crow e M.D. ; Universit y of Chicago, IL, R01 MH59535, Elliot Gershon, M.D., Judith Badner 18 Cong Li et al. Ph.D. , F rancis McMahon M. D. , Chun yu Liu Ph.D., Alan Sanders M.D., Maria Caserta, Steven Dinwiddie M.D., T u Nguy en, Donna Harak al; Univ ersit y of California at San Diego, CA, R01 MH59567, John Kelso e, M.D., Reb ecca McKinney , B.A.; Rush Universit y , IL, R01 MH059556, William Sc heftner M.D. , Ho w ard M. Kra vitz, D.O., M.P .H., Diana Marta, B.S., Annette V aughn-Brown, MSN, RN, and Laurie Bederow, MA; NIMH Intramural Researc h Program, Bethesda, MD, 1Z01MH002810-01, F rancis J. McMahon, M.D., Layla Kassem, PsyD, Sevilla Detera-W adleigh, Ph.D, Lisa Austin,Ph.D, Dennis L. Murphy , M.D. F unding support for the Genome-Wide Asso ciation of Schizophrenia Study was provided by the National Institute of Mental Health (R01 MH67257, R01 MH59588, R01 MH59571, R01 MH59565, R01 MH59587, R01 MH60870, R01 MH59566, R01 MH59586, R01 MH61675, R01 MH60879, R01 MH81800, U01 MH46276, U01 MH46289 U01 MH46318, U01 MH79469, and U01 MH79470) and the genotyping of samples was provided through the Genetic Asso- ciation Information Network (GAIN). The datasets used for the analyses described in this manuscript were obtained from the database of Genotypes and Phenot ypes (dbGaP) found at http://www.ncbi.nlm.nih.go v/gap through dbGaP accession number phs000021.v3.p2. Samples and asso ciated phenot ype data for the Genome-Wide Association of Sc hizophre- nia Study were provided b y the Molecular Genetics of Schizophrenia Collab oration (PI: Pablo V. Gejman, Ev anston North w estern Healthcare (ENH) and North western Universit y , Ev anston, IL, USA). The NIDDK IBD Genetics Consortium Crohn’s Disease Genome-Wide Asso ciation Study was conducted by the NIDDK IBD Genetics Consortium Crohn’s Disease Genome-Wide As- sociation Study Inv estigators and supp orted by the National Institute of Diab etes and Diges- tive and Kidney Diseases (NIDDK). The data and samples from the NIDDK IBD Genetics Consortium Crohn’s Disease Genome-Wide Association Study rep orted here were supplied by the NIDDK Central Rep ositories. The datasets used for the analyses describ ed in this manuscript were obtained from the database of Genotypes and Phenot ypes (dbGaP) found at http://www.ncbi.nlm.nih.go v/gap through dbGaP accession number phs000130.v1.p1. This manuscript was not prepared in collab oration with Inv estigators of the NIDDK IBD Genetics Consortium Crohn’s Disease Genome-Wide Asso ciation Study and does not neces- sarily reflect the opinions or views of the NIDDK IBD Genetics Consortium Crohn’s Disease Genome-Wide Asso ciation Study , the NIDDK Central Repositories, or the NIDDK. The NIDDK IBD Genetics Consortium Ulcerative Colitis Genome-Wide Asso ciation Study w as conducted by the NIDDK IBD Genetics Consortium Ulcerativ e Colitis Genome- Wide Asso ciation Study Investigators and supported by the National Institute of Diab etes and Digestiv e and Kidney Diseases (NIDDK). The data and samples from the NIDDK IBD Genetics Consortium Ulcerative Colitis Genome-Wide Association Study reported here were supplied by the NIDDK Central Repositories. The datasets used for the analyses described in this man uscript w ere obtained from the database of Genot ypes and Pheno- types (dbGaP) found at http://www.ncbi.nlm.nih.go v/gap through dbGaP accession num- ber phs000345.v1.p1. This man uscript w as not prepared in collab oration with In v estigators of the NIDDK IBD Genetics Consortium Ulcerative Colitis Genome-Wide Asso ciation Study and does not necessarily reflect the opinions or views of the NIDDK IBD Genetics Consor- tium Ulcerativ e Colitis Genome-Wide Association Study , the NIDDK Central Rep ositories, or the NIDDK. The authors declare that they ha ve no conflict of interest. References 1. Andreassen, O.A., Djurovic, S., Thompson, W.K., Schork, A.J., Kendler, K.S., ODono- v an, M.C., Rujescu, D., W erge, T., v an de Bunt, M., Morris, A.P ., et al.: Impro ved detection of common v arian ts associated with sc hizophrenia by leveraging pleiotrop y Improving genetic risk prediction by lev eraging pleiotropy 19 with cardiov ascular-disease risk factors. The American Journal of Human Genetics 92 (2), 197–209 (2013) 2. Brown, P .J., Zidek, J.V.: Adaptiv e multiv ariate ridge regression. The Annals of Statis- tics 8 (1), 64–74 (1980) 3. de los Camp os, G., Gianola, D., Allison, D.: Predicting genetic predisp osition in h umans: the promise of whole-genome ma rkers. Nature Reviews Genetics 11 (12), 880–886 (2010) 4. Clarke, A.J., Co op er, D.N.: GW AS: heritability missing in action? Europ ean Journal of Human Genetics 18 (8), 859–861 (2010) 5. Collins, F.S., McKusick, V.A.: Implications of the Human Genome Pro ject for medical science. JAMA: the journal of the American Medical Asso ciation 285 (5), 540–544 (2001) 6. Dickson, S.P ., W ang, K., Kran tz, I., Hak onarson, H., Goldstein, D.B.: Rare v arian ts create synthetic genome-wide associations. PLoS Biology 8 (1), e1000,294 (2010) 7. Eichler, E.E., Flint, J., Gibson, G., Kong, A., Leal, S.M., Mo ore, J.H., Nadeau, J.H.: Missing heritabil it y and strategies for finding the underlying causes of complex disease. Nature Reviews Genetics 11 (6), 446–450 (2010) 8. F alconer, D.S.: The inheritance of liability to certain diseases, estimated from the inci- dence among relatives. Annals of Human Genetics 29 (1), 51–76 (1965) 9. F an, R.E., Chang, K.W., Hsieh, C.J., W ang, X.R., Lin, C.J.: Liblinear: A library for large linear classification. The Journal of Mac hine Learning Research 9 , 1871–1874 (2008) 10. F orer, L., Sch¨ onherr, S., W eissensteiner, H., Haider, F., Kluc kner, T., Gieger, C., Wich- mann, H.E., Specht, G., Kronenberg, F., Kloss-Brandst¨ atter, A.: CONAN: copy num b er v ariation analysis softw are for genome-wide asso ciation studies. BMC Bioinformatics 11 (1), 318 (2010) 11. Gibson, G., et al.: Hints of hidden heritability in GW AS. Nature Genetics 42 (7), 558– 560 (2010) 12. Gilmour, A.R., Thompson, R., Cullis, B.R.: Average information REML: an efficient algorithm for variance parameter estimation in linear mixed mo dels. Biometrics 51 (4), 1440–1450 (1995) 13. Haitovsky , Y.: On multiv ariate ridge regression. Biometrik a 74 (3), 563–570 (1987) 14. Hartley , S.W., Monti, S., Liu, C.T., Stein berg, M.H., Sebastiani, P .: Bay esian metho ds for multiv ariate mo deling of pleiotropic SNP asso ciations and genetic risk prediction. F rontiers in Genetics 3 (2012) 15. Hartley , S.W., Sebastiani, P .: PleioGRiP: genetic risk prediction with pleiotrop y. Bioin- formatics 29 (8), 1086–1088 (2013) 16. Huang, J., Johnson, A.D., O’Donnell, C.J.: PRIMe: a metho d for characterization and ev aluation of pleiotropic regions from m ultiple genome-wide association studies. Bioin- formatics 27 (9), 1201–1206 (2011) 17. Huebinger, R.M., Garner, H.R., Barb er, R.C.: Path w ay genetic load allows simultaneous ev aluation of multiple genetic asso ciations. Burns 36 (6), 787–792 (2010) 18. Korte, A., Vilhj´ almsson, B.J., Segura, V., Platt, A., Long, Q., Nordborg, M.: A mixed- model approach for genome-wide asso ciation studies of correlated traits in structured populations. Nature Genetics 44 (9), 1066–1071 (2012) 19. Lee, S., W ray , N., Goddard, M., Visscher, P .: Estimating missing heritability for disease from genome-wide asso ciation studies. The American Journal of Human Genetics 88 (3), 294–305 (2011) 20. Lee, S., Y ang, J., Goddard, M., Vissc her, P ., W ra y , N.: Estimation of pleiotropy between complex diseases using single-nucleotide polymorphism-derived genomic relationships and restricted maximum lik elihoo d. Bioinformatics 28 (19), 2540–2542 (2012) 21. Maher, B.: The case of the missing heritability. Nature 456 (7218), 18–21 (2008) 22. Makowsky , R., Pa jewski, N.M., Klimen tidis, Y.C., V azquez, A.I., Duarte, C.W., Allison, D.B., de los Camp os, G.: Bey ond missing heritability: prediction of complex traits. PLoS Genetics 7 (4), e1002,051 (2011) 23. Manolio, T.A., Collins, F.S., Cox, N.J., Goldstein, D.B., Hindorff, L.A., Hunter, D.J., McCarthy , M.I., Ramos, E.M., Cardon, L.R., Chakrav arti, A., et al.: Finding the missing heritability of complex diseases. Nature 461 (7265), 747–753 (2009) 24. Park, J.H., W acholder, S., Gail, M.H., Peters, U., Jacobs, K.B., Chano ck, S.J., Chat- terjee, N.: Estimation of effect size distribution from genome-wide asso ciation studies and implications for future discov eries. Nature Genetics 42 (7), 570–575 (2010) 20 Cong Li et al. 25. Purcell, S.M., W ray , N.R., Stone, J.L., Visscher, P .M., O’Dono v an, M.C., Sulliv an, P .F., Sklar, P ., Ruderfer, D.M., McQuillin, A., Morris, D.W., et al.: Common polygenic v ari- ation contributes to risk of schizophrenia and bip olar disorder. Nature 460 (7256), 748–752 (2009) 26. Sakoda, L.C., Jorgenson, E., Witte, J.S.: T urning of COGS mov es forward findings for hormonally mediated cancers. Nature Genetics 45 (4), 345–348 (2013) 27. Sivakumaran, S., Agak ov, F., Theodoratou, E., Prendergast, J.G., Zgaga, L., Manolio, T., Rudan, I., McKeigue, P ., Wilson, J.F., Campbell, H.: Abundant pleiotropy in h uman complex diseases and traits. The American Journal of Human Genetics 89 (5), 607–618 (2011) 28. Smoller, J.W., Craddo ck, N., Kendler, K., Lee, P .H., Neale, B.M., Nurnberger, J.I., Ripke, S., San tangelo, S., Sulliv an, P .F., et al.: Identification of risk lo ci with shared effects on five ma jor psychiatric disorders: a genome-wide analysis. Lancet 381 (9875), 1371–1379 (2013) 29. Solovieff, N., Cotsapas, C., Lee, P .H., Purcell, S.M., Smoller, J.W.: Pleiotrop y in complex traits: challenges and strategies. Nature Reviews Genetics 14 (7), 483–495 (2013) 30. Thompson, R.: The estimation of v ariance and cov ariance comp onents with an applica- tion when records are sub ject to culling. Biometrics 29 (3), 527–550 (1973) 31. Tibshirani, R.: Regression shrink age and selection via the lasso. Journal of the Roy al Statistical So ciet y . Series B (Metho dological) 58 (1), 267–288 (1996) 32. V attikuti, S., Guo, J., Chow, C.C.: Heritability and Genetic Correlations Explained by Common SNPs for Metab olic Syndrome T raits. PLoS Genetics 8 (3), e1002,637 (2012) 33. Visscher, P ., Brown, M., McCarth y , M., Y ang, J.: Five y ears of GW AS discov ery . Amer- ican Journal of Human Genetics 90 (1), 7 (2012) 34. W ray , N.R., Y ang, J., Hay es, B.J., Price, A.L., Goddard, M.E., Visscher, P .M.: Pitfalls of predicting complex traits from SNPs. Nature Reviews Genetics 14 (7), 507–515 (2013) 35. Y ang, J., Ben yamin, B., McEv oy , B., Gordon, S., Henders, A., Nyholt, D., Madden, P ., Heath, A., Martin, N., Montgomery , G., et al.: Common SNPs explain a large prop ortion of the heritability for h uman heigh t. Nature Genetics 42 (7), 565–569 (2010) 36. Zhou, X., Carb onetto, P ., Stephens, M.: P olygenic mo deling with Bay esian sparse linear mixed mo dels. PLoS Genetics 9 (2), e1003,264 (2013)
Original Paper
Loading high-quality paper...
Comments & Academic Discussion
Loading comments...
Leave a Comment