Finding the creatures of habit; Clustering households based on their flexibility in using electricity
Changes in the UK electricity market, particularly with the roll out of smart meters, will provide greatly increased opportunities for initiatives intended to change households’ electricity usage patterns for the benefit of the overall system. Users show differences in their regular behaviours and clustering households into similar groupings based on this variability provides for efficient targeting of initiatives. Those people who are stuck into a regular pattern of activity may be the least receptive to an initiative to change behaviour. A sample of 180 households from the UK are clustered into four groups as an initial test of the concept and useful, actionable groupings are found.
💡 Research Summary
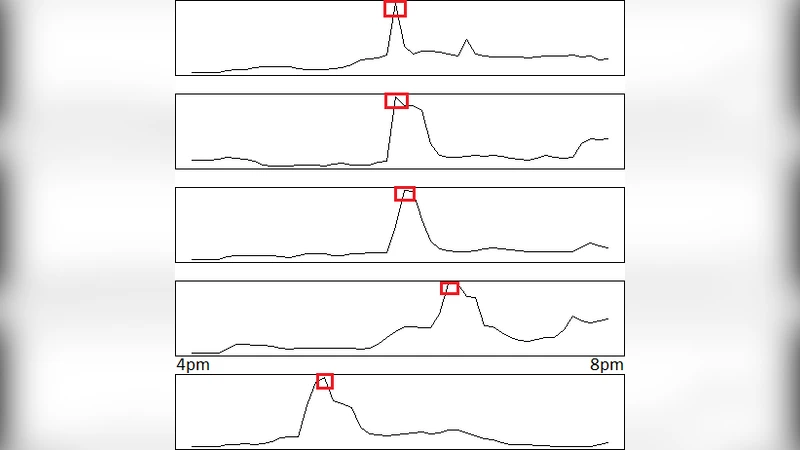
The paper investigates how high‑resolution electricity consumption data, made available by the rollout of smart meters, can be used to segment households according to the flexibility of their daily electricity‑use patterns. Using data from the North East Scotland Energy Monitoring Project (NESEMP), the authors selected 180 households that had complete five‑minute interval readings over a full year. After aligning all measurements to exact five‑minute boundaries by linear interpolation, they focused on the evening peak period (4 pm–8 pm) on working days. For each household and each day, they identified the minute at which the maximum power draw occurred during this window and computed the standard deviation of these times across days – this standard deviation serves as a quantitative “flexibility” metric, reflecting how consistently a household performs its evening activities. The second attribute used for clustering was the average power consumption during the same peak window. These two dimensions (average evening usage and timing variability) were fed into a k‑means algorithm, with multiple random initializations to avoid local minima; the best solution yielded four distinct clusters.
The clusters can be interpreted as follows: (1) high‑usage, low‑variability households (green) – prime candidates for generic demand‑reduction campaigns; (2) high‑variability households (red) – likely to respond positively to price‑responsive or behavioral‑feedback programmes because their routines already shift; (3) low‑usage, low‑variability households (black) – represent a low‑impact segment that may be omitted from active interventions; and (4) low‑usage, moderate‑variability households (blue) – a secondary target after the first two groups. Visualizing the two‑dimensional space makes it easy to draw cut‑off lines for selecting a subset of households for a given programme. When a third attribute – variability of the minimum‑usage time – was added, the cluster boundaries became less obvious, illustrating how multi‑dimensional clustering can aid decision‑making where visual inspection fails.
The authors argue that flexibility‑based clustering provides a cost‑effective way to tailor Demand‑Side Management (DSM) strategies: variable‑pricing schemes could be directed at the high‑variability group, while technological solutions such as home battery storage might be more appropriate for the rigid, high‑usage group that would otherwise resist behavioural change. Limitations include the modest sample size, geographic concentration in North‑East Scotland, and the focus on a single time window. Future work will expand the feature set by automatically detecting recurring “motifs” (e.g., cooking, bedtime) in the meter data, incorporating additional temporal attributes, and validating the clusters against demographic and attitudinal information collected in NESEMP. The ultimate goal is to develop a robust, data‑driven framework that can inform utilities and policymakers on how to deploy DSM interventions efficiently across heterogeneous household populations.
Comments & Academic Discussion
Loading comments...
Leave a Comment