Identification of significant features in DNA microarray data
DNA microarrays are a relatively new technology that can simultaneously measure the expression level of thousands of genes. They have become an important tool for a wide variety of biological experiments. One of the most common goals of DNA microarra…
Authors: Eric Bair
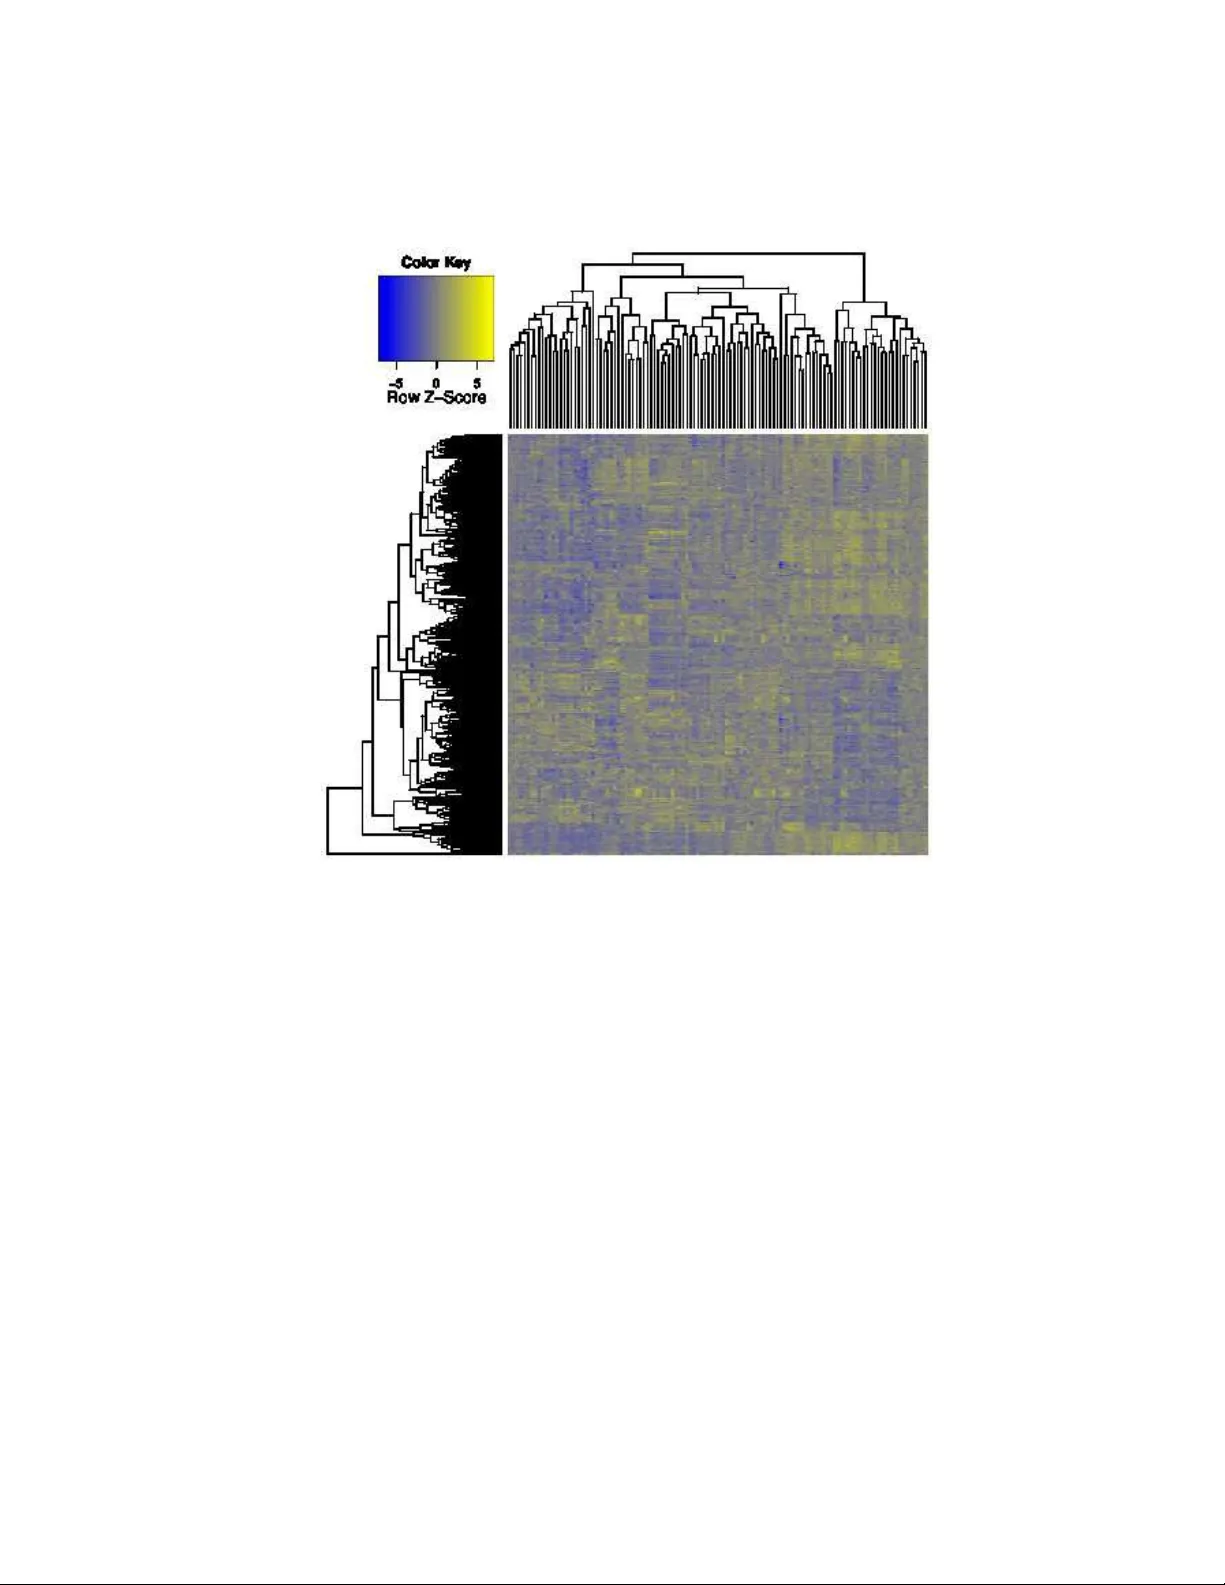
Article type: Ov er view Identification of significant features in DNA micr oarra y data 2DPP Eric Bair Depar tments of Endodontics and Biostatistics Univ . of Nor th Carolina at Chapel Hill Chapel Hill, NC 27599 Ke ywor ds microarra y , genetics, feature selection, multiple testing Abstract DNA microarra ys are a rela tivel y ne w technology that can simulta neously mea- sure the expression lev el of thousands of genes. They ha ve become an im- por tant tool for a wide variety of biological experiments. One of the most c om- mon goals of DNA microarray e xperiments is to identify genes associated with biological pr ocesses of interest. Con venti onal statistical tests often produce poor results when applied to microarray data due to small sample s izes, noisy data, and c orrelation among the expression le v els of the genes. Thus, novel statistical methods ar e needed to identify significant genes in DNA microarray e xperiments. This ar ticle discusses the challe nges inherent in DNA microarray analysis and desc ribes a ser ies of statistical techniques that can be us ed to ov ercome t hese challenges . The problem of multiple h ypothesis testing and its relation to microarray studies is also considered, along with s e ver al possible solutions. High-dimensional biological data sets hav e become increasingly common in recent years. Examples include data collected from DNA microar ra ys, com- parativ e genome h ybridization experiments, mass spectrometr y , genome-wide association studies , a nd DNA/RNA sequen cing. These ne w technol ogies ha ve rev oluti onized our u nderstanding of the genetics o f hu man disease and numer- ous other biological processes. Howe v er , statistical analysis of s uch data sets is challenging for sev eral reasons. These data s ets are high-dimensional, and the sample s izes ar e often s mall. Moreover , many of thes e data sets tend to be “noisy , ” and the corr elation between the features that are measur ed can be comple x. F or these reasons con v entional statistical methods often p roduce un- satisfactory results when applied to modern high-dimensional biological data. The present study focuses on one of the most common probl ems in the analy- sis of high-dimensional biological data, which is the identification of significant 1 genes in DNA microarra y s tudies. This is one of the best-studied problems in the analysis of high-di mensional biol ogical data sets, and man y of the metho ds that are applied to this probl em may also be applied to other types of high- dimensional biological data. In a typical microarra y study , one may wish to identify genes that are assoc iated with a disease or some other biological pro- cess of interest. For example , one mi ght attempt to identify genes as sociated with a disease by collecting a set of biological samples from diseased patients and another set of samples from healthy patients. Genes whose e xpression le vel s diffe r between the diseased s amples and the control s amples may be associated with the disease o f interest. Alternative ly , one might wish to identify genes that ma y be u sed to predict the progn osis of patients with a specific type of c ancer . One might identify such genes by collecting tumor samples from a cohor t of cancer patients and searching f or genes whose e xpression le vel s are associated with the survival times of the patients. Ultimately , this informa- tion may be used f or personali zed treatment of cancer and other diseases. If the gene e xpression profile of a tumor indi cates that the r isk of metastasis is high, then the c ancer should be treated more aggressiv ely than another tumor whose gene expression suggests a low risk of metastasis. This ar ticle consists of three main sections. In the fir st section, we will briefly describe DNA microarra y technology and how DNA microarray data is col- lected. In the second s ection, we will pro vide a brief ov er vie w of some of the methods that have been used to identi fy significant genes in DNA microarray e xperiments. Numerous methods ha ve been proposed in recent years, and space does not per mit a detailed discuss ion of all poss ib le methods. We ha v e attempted to f ocus on s e ver al of the most commonly used approaches, along with an overview of some of the common principles and techniques used in these methods. W e also br iefly describe a f e w more recent methods for com- bining information across genes. In the final section, w e discuss the prob lem of multi ple hypothesis testing, which ine vitab ly aris es when identifying significant fe atures in high-dimension al data sets. DN A Micr oarray Data Overview of Molecular Biology Each o rganism’ s g enetic inf ormation is containe d in a molecule called de oxyribo nu- cleic acid , more common ly kn own as DNA. DNA is a doub le-stranded mo lecule th at is a chain of four possible nucleotides, namely adenine (A), cytosine (C), guanine (G), and thymine (T). T he tw o strands of DN A are joined to one an other by hydrogen bond s between nu cleotides on th e opp osite strands. A al ways pairs with T , and G always p airs with C. Thus, if the sequen ce o f one strand of DNA is kn own, then the sequence of the other stand is also kn own. Each such pair of bon ded nucleotides is k nown as a base pair . 2 There are ap proxim ately 3.2 billion base pairs in the human gen ome ( i.e. the entire sequence of DN A in a g i ven h uman cell) 1 . Different segments of DN A perfor m d iffer - ent functions, and muc h of th e DN A performs no k nown fun ction. The DN A segments of prima ry inter est in m ost studies a re the segments which con tain instructions fo r building proteins. T hese segments are kn own as gen es, and they comp rise about 1.5% of the DNA sequen ce in humans 2 . Pro teins perfor m most of the im portant function s in cells, includ ing metab olism, DN A replication and repair, an d co mmunication with other cells. The informatio n contain ed in DNA is converted to p roteins in a two-step process: In the fir st step, known as transcription , a given sequence of DN A is transcribed into an intermediar y called m essenger ribonu cleic acid (m RN A), which is a single-stran ded molecule that contains a copy of the com plements of th e base sequence of the DN A. The one dif ference is that thymine is replace d by u racil (U). In the second step, kno wn as tr anslation, th e sequen ce of base pairs in the mRNA is tr anslated in to a pro tein, which is compo sed of a seque nce o f amino acids. Each set of thr ee base p airs in the mRN A co rrespond s to one o f 20 amin o acid s, a relationsh ip that is known as the ge- netic cod e. This p rocess by which the infor mation in the sequence of DN A is conv erted to mRNA and then to pro teins is kn own as the fun damental dog ma of mo lecular biol- ogy . See Dudoit et al. 3 for a discussion of this process and its relation ship to DN A microarr ay d ata. DNA Micr oarray T e chnology An important implication of the fundam ental do gma of molecular biology is that there should be a strong association b etween the presen ce o f a given protein in a cell and the presen ce of the mRNA sequ ence th at is transcribed to build tha t p rotein. If a pro - tein is acti ve in a g i ven cell, there should b e a large number of copies of th e mRNA sequence c orrespond ing to that protein . Conversely , if a p rotein is no t active in a cell, there should be few copies of the corre sponding mRN A seque nce. Thus, D N A mi- croarray s attemp t to ev alu ate the presence or absen ce of pro teins in a cell and th eir relativ e a bundance b y measuring the relative abundan ce of th e correspon ding mRNA sequences. DN A micro arrays measur e th e relative abundance o f mRN A seq uences in the cells in a sample by taking ad vantage of complementar y base p airing. Recall that in a DNA (or RNA) sequence, C always pairs with G a nd A always pairs with T (o r U). A DNA microarr ay is typ ically constru cted by placin g an array o f pro bes on a glass micro - scope slide. E ach probe consists o f a sequence of n ucleotides that is comp lementary to the nucleotide seq uence o f a specific mRNA or its corresp onding DN A sequence. Thus, o ne can measure the expr ession level of a given gen e by measuring th e amoun t of mRN A that h ybridizes to the spot on the microarr ay corresp onding to the gene. Different f orms of DNA microarra ys exist, such as olig onucleotid e micro arrays 4 and cDN A microarrays 5,6 , but all of the m ost commo nly used micro arrays are based on this principle. 3 [Figure 1 about here.] Figure 1 illu strates a typical ( cDN A) microarr ay exp eriment. T wo sample s are col- lected, name ly an experimen tal samp le and a con trol sample. For examp le, the ex- perimental sample may contain tissue from a cancero us tumor , and the contr ol sample may con tain non-can cerous tis sue from the same location in the b ody . First, mRN A is extracted from both samples. The e xtracted mRN A is treated with an en zyme called reverse transcriptase to con vert it to a co mplementar y DN A (or cDN A) seq uence. T hen each sample is treated with a fluorescen t dye. T ypically the red dy e Cy5 and the gree n dye Cy3 are used. Equ al amou nts of the two samples are then hybr idized onto an array . T o d etermine wh ich ge nes are expressed at a hig h (or a low) level in the experimen tal group co mpared to the contr ol group , one m ay mea sure the ratio of Cy5 to Cy3 at th e probe on the arr ay corr esponding to that gene. For example, supp ose th at the experi- mental samp le was treated with the r ed d ye and the co ntrol sample was treated wit h the green dye . T hen a red spot on the array ind icates that there was mor e mRN A for that particular gen e produ ced by the exper imental group than th e con trol group, ind icating that this gene is expre ssed at a higher level in the control gro up. An image of a DNA microarr ay slide is shown i n Figure 2. [Figure 2 about here.] Before micro array da ta is analyzed, th e ratio of red d ye to green dye at each spot on the ar ray is m easured using an app ropriate scanner . This ratio is stor ed in a large data matrix. T y pically each row of the data matrix co ntains all the measur ed e xpression lev els for a giv en gene, and each column of the data matrix corr esponds to a particular sample. Such a data set is often visualized in the fo rm of a heat map , as shown in Figure 3. Th e task o f the m icroarray data analyst is to answer the biological question(s) of interest using this data matrix. [Figure 3 about here.] It is impor tant to attempt to remove extraneous variation in microar ray data prior to data analysis. V ariations in design o f the arr ays, sample prepa ration and scan ner reading can produ ce “batch effects” wh ere so me subset of samples exhibit sy stematic differences in gene expression that are unrelated to the bio logical pr ocess of interest. Failure to account for such batch effects can result in spurious findin gs. 7,8 Thus, normalization is often necessary to remove b atch effects. Numerou s meth ods hav e been proposed to n ormalize microar ray data 9–17 . A detailed description o f these n ormalization meth- ods are b eyond the scope of this re v ie w; see th e afore mentioned ref erences for mo re informa tion. 4 Methods f or I dentifying Significant F eature s in DNA Mi- cr oarray Data Perhaps th e most common o bjectiv e of microarray exp eriments is to identify gen es that are associated with a b iological pro cess of interest. For example, one may wish to iden- tify genes assoc iated with a disease of interest by comparin g the expr ession levels of genes in diseased samples to the cor respondin g expression levels in h ealthy samples. Other ou tcomes o f inter est ar e also possible. For exam ple, in cancer studies, on e fre- quently wishes to id entify genes associated with the sur viv al time of c ancer patients. The motiv a tion is that genes that are a ssociated with lower survi val ar e likely to be associated with more serious forms of cancer that require more aggressiv e treatment. In s tatistical terms, o ne has a l arge nu mber o f f eatures (g enes) and an outcome v a riable (e.g. disease versus control, surviv al time, etc.). The objective is to identify genes that are associated with the outcome v ar iable. In principle, this objectiv e can be accom- plished using conventional statistical m ethods. T o compare the expression of g enes between two gro ups, o ne may calcu late a t -test statistic fo r each gen e. If there are three o r m ore gr oups, an ANO V A F-test s tatistic may be used. T o find g enes associated with a continuo us outco me variable, on e may calculate a stand ardized r egression co - efficient, and to find gene s associated with a surviv al ou tcome, on e may c alculate the Cox score for each gene 18,19 . Howe ver, these con ventional m ethods often perfo rm po orly o n m icroarray d ata sets for se veral r easons, which will be discussed in mor e detail below . DN A microarr ay data sets are frequ ently noisy , a nd sample sizes are often small. Mo reover , the g ene ex- pression levels are often high ly correlated with on e ano ther , and failing to acco unt for this fact may result in a loss of power . Also, o ne w ill typically perfor m several thou- sand hypothesis tests in a micro array experime nt, so sp ecialized methods are needed to control for type I error . Throu ghout the rem ainder of this section , we will assume that on e is comparin g two different con ditions using a t - test or a variation o f the con ventio nal t -test. Howe ver, the methods discu ssed below are easily generalized to other test statis tics, such as ANO V A F-tests, standardized regression coef ficients, and Cox scores. Fold Change Methods One simple method f or identif ying differentially expressed features is to co mpute the av erage v alu e of ea ch feature under e ach condition and then compute the ratio of the se av erages. If the ratio exceeds some arbitr ary cu toff, then the difference is called “sig- nificant. ” For example, a ge ne m ay be called “significant” if the av erage exp ression lev el of a gen e is m ore than twice as large ( or less than half as large) in one con dition compare d to the oth er . This approach has the ben efit of simplicity , and it has been used in pre vious m icroarray studies 20,21 . However , this meth od h as some serious shor tcomings. It is not based on 5 a form al statistical test, so th ere is n o simple way to calcu late a p - value or confide nce interval o r other measur e of th e statistical validity of th e association. Moreover , it is easy to see th at this fo ld chang e has higher variance for genes expressed a t lower lev els, which is true of the major ity o f g enes in microarray studies 22–24 . For these reason s fold change method s are gener ally accepted to be inferior to oth er method s for iden tifying differentially expressed features 25–29 . T -T ests An alternati ve approach is to identify sign ificant gen es based on a two-sample t -te st of the nu ll hypoth esis th at the me an expression le vel of the gene is the same und er both cond itions. Th is ap proach h as a lso b een used in microarray studies 30 , an d it has se veral advantages over fold ch ange methods. It is straigh tforward to calculate p - values and confidenc e intervals u sing t -tests, an d for large samp les the distribution of th e t - statistic is indepen dent of the overall expression le vel of the gene. In contrast, fold change statistics have hig her v ariance for genes expressed at lo w levels. Unfortu nately , using t -tests to ide ntify d ifferentially expressed genes can be p roblem- atic wh en the sample size is small, which is co mmonly the case in microarr ay exper- iments. It can be difficult to ob tain accurate estimates of the variances of each gro up when the sample sizes are small. In particular, if the the e stimated variance of a gene is small, which occurs frequently wh en a gene is e xpressed at lo w levels 24 , then the gene may have a large t -statistic ev en if the fold change is small. Alternati ve V ersions of T -T ests Giv en the shortcomin gs of t -tests described above, num erous autho rs hav e proposed alternative versions o f t -tests f or identify ing significant features in g ene expression data. T ypically th ese metho ds combin e data fro m all the genes to obtain a regular ized estimator of the variance of a p articular gene. In general, such variance estimates are biased. Howe ver, since the usual estimato r of the variance has h igh variance when the sample size is low , a biased estimato r of the variance may have lower prediction er ror than an unbiased estimato r , since these b iased estimators have lower v ariance than th e unbiased estimator . This is especially tru e when the sample size is small. See Hastie et al. 31 for a mor e detailed discussion of this phenom enon, which is comm only referred to as the “bias-variance tr ade-off. ” An example of the b ias-variance trade-off is shown i n Figur e 4. Sup pose the objective is to p redict y based o n x given the d ata in the figure. If o ne pred icts y using a linear regression estimato r based on x , the variance will be relatively low , b ut the bias w ill be high, since it cannot model the n onlinear relationship between x and y . At the other extreme, if one p redicts y by interpolatin g the data with a smoothing splin e, the bias will be 0, since the interpolation f unction can model an y arb itrary r elationship b etween x and y . Howe ver , the variance will be high , sinc e th e p redicted values of y may ch ange drastically if such a model is fit to a new data set. 6 [Figure 4 about here.] Figure 5 sho ws how the bia s and variance of a series of mo dels varies as the complexity of the model increases. E ach m odel in this figure repre sents a smo othing spline 32 fit to the data fro m Figu re 4 . As the com plexity of the m odel in creases, the variance of the m odel incr eases a nd th e bias of the model decrea ses. One attempts to ch oose the model co mplexity that minimizes the expected pred iction error or mean squared e rror (MSE), wh ich can be shown to be eq ual to the sum of the variance, th e squa re o f the bias, and an irreducib le err or term due to unexplainable variance in y 31 . [Figure 5 about here.] These figur es illustrate why a regular ized (i.e. biased) estimator of th e variance of the genes may produ ce better results when identify ing significant features based on mi- croarray data. By regular izing the estimates o f th e v ariance, the co mplexity of each individual model is redu ced, incr easing the bias o f the model but decr easing th e vari- ance. If the decrease in variance is suf ficien t to offset the incr ease in bias, the accuracy of the overall model may be increased. One possible approach is to estimate the v a riance of each gene by using the pooled estimator of the variance of all g enes. Although this meth od has bee n used for several microarr ay studies 33–35 , it also h as some serious shortcom ings. T his o bviously assumes that the variance o f the expression lev els of all gen es are approx imately the same, which is unlikely to be true in most situation s. Mor e importantly , sin ce the den ominator of the t -test will be the sam e for all genes, this method is e ssentially eq uiv alen t to the fold change metho d, since it selects the gen es with the largest mea n differences without regard for the v arian ce of an indi vidual gene an d thus suffers f rom the same drawbacks as fold chang e meth ods. In terms of th e bias-variance trade- off, this po oled variance estimate has lo w variance b u t high bias. An alterna ti ve ap proach is to co mbine the variance estima tor of each g ene with some sort of po oled es timator of the variance across the genes. This a voids the high variance that re sults from estimating the variance of each g ene ind i vidually as well as th e h igh bias that resu lts from relying entir ely on a pooled variance estimate. For example, the “Significance Ana lysis of Micr oarrays” (SAM) p rocedur e of Tusher et al. 24 uses the following test statistic: t i = ¯ X i − ¯ Y i s i + s 0 (1) Here t i represents the t -statistic for the i th gene, a nd ¯ X i and ¯ Y i represent the mean e x- pression lev el of the g ene under each e xperimen tal condition. Th e variance is e stimated by summing the estimate d variance of th e i th ge ne (d enoted b y s i ) and a norm alizing constant s 0 . Th is norma lizing constant reduc es the variance of the estimator o f the vari- ance and hence reduces the likelihood of obtaining f alse positi ve findings as a result of genes whose estimated variance is small. T ypically s 0 is chosen to b e some quantile (such as the med ian) of the s i ’ s across all of the genes. The SAM sof tware is publicly 7 av ailable as an add-in for Microsoft Excel (http://www-stat.stanfo rd.edu/ tibs/SAM/). It is also implemented in the “samr” R package. Other n ormalized estimators of the variance of micro array samples have been pro posed. For examp le Hub er et al. 36 apply an ar sinh transformation to the gene expression data that is d esigned to pr oduce stable variance estimates irr espectiv e of the gene’ s ov er- all expression level. This m ethod is im plemented in the “vsn” R package (a vailable throug h the Bioc onductor project at http://www .b ioconduc tor .org). Cui et al. 37 com- bine gene-specific an d between-gene variance estima tes using a James-Stein estima- tor 38 . R code for implementin g th is method is a vailable at http://www .stjuderesear ch.org/depts/biostats/documents/cui-Fstat.R. In gene ral, any method to reduce the variance in the e stimates of the v ar iances of the individual g enes can pro- duce more accurate results when the sample size is small. Bayesian Methods Bayesian methods can also be used to combine in formation ac ross gen es to av o id in- accurate variance estimates as a result of small sam ple sizes. T yp ically these method s impose some typ e of Bayesian p rior distribution on the g ene expression data and es- timate the p osterior distribution f or ea ch gene by combin ing infor mation across all of the genes. For e xample, Baldi and Long 39 impose a prior distrib ution on the v ar iances of the genes to obtain the following regularized t - test: t i = ¯ X i − ¯ Y i q v 0 σ 2 0 +( n − 1) s 2 i v 0 + n − 2 (2) In this expression ¯ X i , ¯ Y i , an d s i are define d as they were in (1). Th e param eter σ 2 0 is an estimator of the pooled variance acro ss genes, which is calculated using d ata from all the gen es, and v 0 is a tun ing p arameter th at controls the relativ e contributions o f the gene-specific variance estimate an d the glob al variance estimate. R code for im ple- menting this method is av ailable at http://molgen51.b iol.rug.nl/cybert/help/index.html. Note that (2) is similar to (1) in that the deno minator of the t -statistic consists of a lin- ear combinatio n of an estimator of the variance of gene i plus a poo led estimate of the variance of all th e genes. Th e similarity between the tw o expressions is not surprising. In general Bayesian methods tend to produce biased parameter es timates, but these es- timators may hav e lo wer variance/mean squared error than unbiased estimators, which is the same moti vation for considering the regularized variance estima tors discussed previously . I ndeed, in so me situations regularized frequentist par ameter estimato rs can be shown to be Bayesian estimators with the appr opriate choice of prior 40 . Other similar Bayesian app roaches h a ve also b een p roposed for d if ferent ty pes of mi- croarray p roblems 41 –45 . In p articular , the “limm a” method o f Smyth 44 uses an empir- ical Bay es test statistic that consistently perf ormed well in a recent study comparing feature selection methods for microarr ay data 46 . 8 Calculating P -V alues If a t -test (or othe r co n ventional p arametric test, such as ANOV A or regression) is used to test th e n ull hy pothesis of no association between the expression level of a given gene and an o utcome, then calcu lating t he p -value for this null h ypothesis is straig htforward if the assump tions of th e test are satisfied. Howev er , it m ay be dang erous to a ssume th at these test statistics are nor mally d istributed when the sam ple size is small. Mor eover , as discussed previously , in many situatio ns it is p referable to u se biased estimators of the variance of a gen e’ s expression level. When a b iased estimator of the variance is used, a t -statistic may no longer have a t distribution. Thus, alternative appro aches may be needed to compute p -values i n these situations. One p ossible alternative is to calcu late p -values b ased on th e p ermutation distribution of the test statistic. Let t j denote the t -statistic (or oth er test statistic) associate d with gene j . Suppose the sample labels are th en pe rmuted K times, and let t j,k denote the test statistic associated with gene j for the k th permu ted data set. Th en on e can estimate the p -value f or gene j (denoted by p j ) as follows: p j = 1 K K X k =1 I ( | t j,k | > | t j | ) (3) Here I ( x ) d enotes an indicator functio n that is equ al to 1 if the con dition is tr ue and 0 other wise. In other words, th e p -value is estimated by coun ting the numb er of times that the permu ted version of the test statistic is “m ore extreme ” than th e o riginal ( unper- muted) version of the test statistic. A very large (or very small) test statistic is unlikely to o ccur by chance, so very few pe rmuted data sets will p roduce a larger test statistic and th e p -value will be small. This ap proach is used by the “SAM” software p ackage 24 to calculate p -values. This approach requires a choice of th e number of permutations K . For small data sets, one may simply ev aluate all possible permuta tions. In the ca se wher e one wishes to compare n 1 samples from one co ndition to n 2 samples from anoth er co ndition u sing a t -test (o r variant ther eof), th ere ar e a total of n 1 + n 2 n 1 possible permutation s. How- ev er , this would be comp utationally intractable for larger da ta sets, so it is comm on to arbitrarily select a value of K = 100 0 or an even larger numb er if m ore precision is desired. One possible pro blem with calculating p -values using (3) is th at it can b e difficult to estimate p -values tha t are close to 0. If | t j | > | t j,k | for all k , th en (3) implies that p j = 0 , which in rea lity all that can be inf erred is that p j < 1 /K . T his is p roblematic because certain method s for adjusting for mu ltiple h ypothesis testing in microarray experiments requir e precise estimation o f p -values that ar e very clo se to 0. See b elow for more details. There are a few possible solutions to th is problem . The simplest approach is to increase the value of K . This will solve the problem given sufficient computing power , but it can be computation ally intractable for large da ta sets. An other possibility is to pool the 9 results of all the genes when calculating the permutation p -v alu es. Sup pose there are a total of N gen es in the experiment. Th en we estimate p j as follows: p j = 1 N K N X i =1 K X k =1 I ( | t i,k | > | t j | ) (4) In other words, rather than si mply coun ting t he nu mber of times that the permuted test statistic for gene j is more extreme th an the unper muted test statistic for gen e j , o ne counts the nu mber of times that the per muted test statistic for any gene is gr eater than the perm uted test statistic for gene j . This can incre ase th e p recision of the estimates of p j without increasing the c omputation al b urden. See Hastie et al. 31 for a com plete discussion o f calcula ting p -values based on the permutation distribution of the test statistics. Methods for Combining Inf o rmation Acr o ss Genes The methods discussed thus far assume that hypoth esis tests will be perfo rmed on each gene one at a time , and that the results of a hypo thesis test on a given gene will not b e affected by the hypothe sis tests p erformed on oth er gen es. T his strategy m ay be inef- ficient on DNA microarray studies. Genes often act in pathways, m eaning that sev eral genes may b e inv olved with the same biolog ical pro cess and hence be activ ated an d deactiv a ted simultaneo usly . I f se veral related genes show evidence of differential ex- pression at the same time, that is stron ger e v idence that the dif ferential e xpression rep- resents biological signa l than if such a pattern were observed for a sin gle gene. Sev eral methods h av e been p roposed fo r com bining infor mation across genes when search ing for differentially expressed genes in micro array studies, which will be d iscussed below . Biologically Motivated M ethods One ap proach fo r combinin g informa tion acr oss genes is to utilize known biolog ical relationships among th e gen es. T y pically genes are classified into gr oups u sing b iolog- ical datab ases such as Gene Ontology 47 . Each grou p r epresents a set of biologically similar genes. T he m ost com monly u sed me thods com pare the numb er of significant features in each g roup to the numb er expected if the genes in the gro up are n ot differ- entially expr essed. If there are an unusu ally hig h num ber of significan t feature s in a giv en group, tha t suggests that th e pathway corresp onding to the group is dif ferentially expressed. One strategy f or iden tifying pathways c ontaining differentially expressed gen es is known as o ver-representation analysis (ORA). ORA first identifies a list o f “significant” g enes using any of th e previously descr ibed methods for detecting dif f erentially exp ressed genes. The M “most significant” genes are selected , w hich ar e typically the genes with the smallest p -values. Then f or each gro up of genes, Fisher’ s exact test ( or so me approx imation thereof) is used to test the null hypo thesis that the numb er of genes called sign ificant in each group does n ot exceed the number of g enes expected to b e 10 called s ignificant due to chance. V ario us imp lementations of ORA ha ve been p roposed in the literature 48–53 , and it has been used in some microarray experiments 54 . Despite the po pularity of ORA, it has several shortcom ings. T yp ically only the top M genes are used to co mpute the ORA statistics, resulting in the loss o f any info rmation av ailable from genes not among th e M most significant genes. The cho ice of M is often ar bitrary as well. Moreover, all o f the top M g enes ar e treated equ ally , meanin g that genes with extremely small univ ariate p -v alues are giv en the same weight as genes whose univ ariate p -values are much larger . Finally , ORA co nsiders the g ene to be the unit of analysis rather than the su bject, which is inappro priate in v irtually all real-w orld situations. Am ong oth er issues, it imp lies th at the g ene sets should be independ ent of one an other, which is almost certainly n ot true in pr actice. See Pa vlidis et al. 55 , T ian et al. 56 , or Allison et al. 29 for more information on the shortcoming s of ORA. An a lternativ e strategy that av oids the problem s associated with ORA is gene set enrichmen t analysis ( GSEA). GSEA fu nctions as fo llows: First, th e gen es are or- dered accor ding to their t -statistics or p -values o r some other me asure of univ ari- ate statistical sign ificance. Then for each gro up of genes, the distribution of th e t - statistics of the gen es in the grou p is com pared to the distribution of the genes not in the group using a o ne-sided Kolmogorov-Smirn ov statistic or some o ther similar statistic. The idea is th at if a group of genes is differentially expressed, then the distribution of the t -statistics amo ng tha t set of genes should be different th an the distribution of the t -statistics a mong the rema ining genes. A p -value can b e calcu- lated for eac h set of g enes b y perm uting the d ata multiple times and using (3) or (4) or alternative methods. V arious im plementations o f GSEA have been p roposed in the literature 55–64 . T here are also several software imp lementations o f GSEA. For example, the Broad In stitute offers software to perf orm GSEA in b oth Jav a an d R (http://www .bro adinstitute.org/gsea/index.jsp) an d a variant o f GSEA is implem ented in the “SAM” software package. The main shortco ming o f GSE A is the fact that it tests a “competitive null hypothesis. ” Suppose we ha ve two g roups o f gene s, which we will call gene group 1 and gene group 2. Then a smaller p -value fo r testing the null hypothesis of no d ifferential expression in g ene gro up 1 implies a larger p -value fo r testing this n ull hy pothesis in g ene g roup 2 e ven if the expr ession levels in gene group 2 remain unchanged . This occurs because the p -value for gene g roup 2 is calc ulated by com paring the test statistics of the genes in gene gro up 2 to the test statistics of all g enes not in gen e group 2, includ ing the test statistics in gene grou p 1 . Thu s, if extreme tes t statistics are observed in gene grou p 1, this decr eases the sign ificance of g ene gro up 2. See Damian and Gorfine 65 or Allison et al. 29 for a m ore detailed discu ssion o f this phen omena. T he development of metho ds for identify ing g roups of genes associated with an outco me of interest that av o ids the shortcomin gs o f ORA and GSEA is an acti ve research area. Statistically Based Methods Other strategies for comb ining inf ormation acro ss gen es u se n ovel statistical m ethods that do not req uire any knowledge of the biolo gical relationship b etween the genes. W e 11 have previously d iscussed one possible statistical strategy for com bining information across gen es, n amely regular ized or Bayesian estimators of the variance of individual genes. By using informatio n abou t the v ariance of other genes to estimate the variance of a sp ecific gen e, the variance of the test statistic is g reatly d ecreased, an d h ence the risk of false p ositi ves and false negati ves is also dec reased. Howev er , in recen t year s there several mo re ad vanced methods hav e been pro posed for com bining inf ormation across genes which we will briefly describe below . One strategy is known as the optimal discovery p rocedur e (ODP) 66,67 . The mo ti vation for ODP is similar to the motiv a tion for the path way-based m ethods discussed p revi- ously . Since genes function in pathways, we e xpect that g enes in the same pathway are likely to b e co -expressed. Th us, if a gen e shows evidence of differential expre ssion, one can be mo re confident that the differential expression is not d ue to ch ance if othe r genes show a similar expression pattern. See Figure 6 for an illustration of this idea. The dif f erence between ODP a nd path way-based method s is that pa thway-based meth- ods require one t o kno w in advance wh ich g enes a re expec ted to be co-exp ressed based on previously collected b iological data whereas ODP does not. [Figure 6 about here.] The ODP is a g eneralization of th e Neyma n-Pearson lem ma 68 . Th e Neyman-Pearso n lemma states tha t the most p owerful test of a given null hyp othesis against a giv en alternative hy pothesis rejects the null hypothesis when the ratio probab ility o f the observed data under the alternati ve hypothesis probab ility o f the observed data under the null hypothesis (5) is large. The ODP generalizes the Neyma n-Pearson lemm a to situations where multiple hypoth eses are tested by rejecting the nu ll h ypothesis that gen e i is not differentially expressed when the ratio sum of the probab ilities o f observing data i und er each a lternativ e hypothesis sum of the probab ilities o f observing data i und er each n ull hypothesis (6) is large. Thus, if a set of gen es with sim ilar expression patterns all show evidence o f differential expression, th en (6) will be larger th an (5) for a given g ene in the set, mean- ing that the null hyp othesis of no differential expr ession is mor e likely to be rejected under ODP than under the traditional Neyman-Pearson paradigm. In practice, (6 ) can not b e co mputed exactly an d m ust b e app roximated . 66 , 67 Software for computing the ODP is publicly a vailable 69 . An alternative strategy for comb ining information across genes without any b iological informa tion abo ut the relationship between t he genes is the Lassoed Principal Compo- nents (LPC) metho d of Witten and Tibshirani 70 . Th e motiv a tion for LPC is similar to the mo ti vation for ODP: A g ene is more likely to b e differentially expressed if th ere are other genes with similar expression patterns than it is if th ere a re no such similar genes. Howev er , LPC u ses a different strate gy to d etermine if ther e are other genes 12 with similar expression patterns. The idea b ehind LPC is that if a gr oup of genes ar e co-regulated, then it is likely that a principal compo nent of the gene expression matrix (sometimes called an eigenarray 71 ) will capture the variance in this gro up of gen es. Thus, the LPC algorith m a ttempts to identify an eigen array o r grou p o f eigenarrays that are associated with the bio logical pr ocess of interest and projects the t -statistics (or o ther rele vant test statis tics) onto this gro up of eigenarr ays. This method c an b e shown to significan tly reduce the false d iscovery rate in a variety of situation s. 70 This method is implemented in the “lpc” R package. Clustering and Pr ediction Meth ods Identify ing features associated with an o utcome of in terest is n ot the on ly objective of microarr ay studies. On e may also wish to partition the d ata in to homogen eous su b- group s and/o r use the data to pr edict an outc ome o f inter est. Clustering method s an d prediction methods are useful in this situation. There is a vast literature d ev oted to methods for clustering or pr edicting an outcome based on m icroarray data. A full description of su ch method s is beyond this sco pe of this review (which f ocuses o n feature selection ). However , it is noteworthy that th ere are methods fo r clu stering 19,72–84 and prediction 19 ,85–94 that also perfo rm fea ture selec- tion. These methods generally do no t ev alu ate whether a selected g ene is “statistically significant” nor do they indicate which genes are the “most significant. ” Also, the u ser of these metho ds often has limited con trol ov er the number of featu res selected. T hus, these methods have seriou s disadvantages if f eature selection is the primary goal o f the an alysis. Nevertheless these m ethods can identify a list of gen es for fu rther study , particularly in cases where clustering and pred iction are important goals of the experi- ment. Comparison of F eatur e Select ion Methods Numerou s methods have been pro posed for identifyin g significant fea tures in DNA microarr ay data. Howe ver , the question o f which meth ods prod uce the best results (i.e. m aximize power while c ontrolling type I er ror) has n ot been studied extensively . In practice researchers o ften choo se feature selection meth ods based on the ea se of implementin g the m ethod rather than the perf ormance of the meth od. The “SAM” software pack age has beco me a po pular too l fo r micr oarray an alysis largely due to the fact that it is av ailab le as an Exc el add- in and do es not req uire the use o f R or command -line pr ograms. Limited r esearch indicates that the “limma” method of Smyth 44 perfor ms well fo r a wide variety of pro blems, althou gh other metho ds may perf orm better in specific situations 46,70,95 . Limma is implemented in the “ limma” R package, wh ich is a vailable from Bio conducto r . Determin ing which feature selection method is likely to produc e the best results on a gi ven data set is an important area for future research. 13 Issues Related to Multiple Hypothesis T es ting Identify ing significan t genes in microarray studies requires performing a lar ge number of hypo thesis tests, which p resents statistical challenges. When perfor ming a sin gle hy- pothesis test, it is co n ventional to c hoose a s ignificance level α suc h that th e pro bability of rejecting the null hyp othesis when it is tru e is eq ual to α . Howe ver, when mu ltiple hypoth esis tests are perfo rmed, the probability of at least one false positi ve test will be much larger than α . Thus, meth ods are needed to contr ol the numb er of false po siti ve tests while maintaining sufficient po we r to identify truly significant genes. The Family-W ise E rr or Rate One possible solution is to con trol the family- wise err or rate ( FWER) at a spec ified lev el. The FWER is defined to be th e pr obability of rejecting at lea st one n ull hypo th- esis that is true. The most commo n way to control th e FWER at a specified level is to use a Bonf erroni co rrection: Each individual null h ypothesis is rejec ted if a nd o nly p < α/ N , whe re p is the p -value f or th e test and N is the total n umber of tests. It is easy to show that the p robability of at least o ne ty pe I err or is no gr eater than α using this proced ure. Although the Bonfer roni correction contro ls the nu mber of false po siti ve tests, it is a very stringent criterion that typically results in a substantial loss of po wer . In ex- periments w ith small sample sizes it is c ommon fo r no tests to satisfy the Bon ferroni criteria. Thus, m ost microarray analysts prefer less string ent ap proaches 29 . Metho ds exist f or controlling the FWER using more permissi ve criteria tha n the Bonferr oni co r- rection 3,96 , but the se me thods also su f fer from lower power and are not commo nly used. The False Discovery Rate The false discovery rate ( FDR) is defined to be the expected pr oportion of false posi- ti ves am ong the set o f genes th at ar e c alled significant. On e m ay also adju st fo r multip le compariso ns by controlling the FDR rather than the FWER. This ap proach ty pically yields greater power than FWER-based methods and hence is g enerally regarded as preferab le 29 . The FDR was first proposed b y Benjamini and Hochberg 97 . T o co ntrol the FDR at a given le vel α , they pro posed the fo llowing p rocedur e: Let p (1) ≤ p (2) ≤ · · · ≤ p ( N ) be the order ed p -values, and let H (1) , H (2) , . . . , H ( N ) be the corresp onding nu ll hypoth eses. T hen reject H (1) , H (2) , . . . H ( j ) , where j = max i { i : p ( i ) ≤ αi/ N } (7) Benjamini an d Hoch berg 97 prove that th e FDR of th is pr ocedure is at mo st α . Th is proced ure is always valid if th e p -values are indep endent. I t remains valid in some cases 14 ev en when dependency exists a mong the p -values, an d metho ds exist for estimating the FDR where any type of dependency e xists. 98–110 Rather than cho osing a spec ific FDR in advance, one may wish to estimate the FDR when the top m g enes are called significant. This is easy to do using th e methodo logy of Benjamini and Hochberg 97 : If we let ˆ α = p ( m ) N /m (8) Then (7) implies that the FDR should be approx imately ˆ α . If one estimate s th e null d istribution of the test s tatistics using permutations of the data as in ( 3) and ( 4), then an alternative estimator of the false discovery rate may b e used. Once again , let t j denote the t -statistic (o r other test statistic) associated with gene j , and let t j,k denote the test statistic associated with gene j for the k th permuted data s et. Also, let t (1) ≤ t (2) ≤ · · · ≤ t ( N ) be the order statistics of the absolute values o f the t j ’ s. Then one may estimate the FDR ˆ α when the top m genes are called significant as follows: ˆ α = 1 mK N X i =1 K X k =1 I ( | t i,k | > t ( N − m ) ) (9) In other w ords, one estimates the FDR by di vid ing the a verag e number of genes called significant over K permuted data sets by the num ber of g enes called significant in th e unperm uted data set ( which is m , since the top m g enes wer e called sign ificant). It can be sho wn that ˆ α in (9) is a con sistent estimator of the FDR 99,111 . Also, it can be sho wn that estima tors (8) and (9) are eq uiv alent 31 . Ther e ar e several R pack ages which will compute th e FDR using this methodology (such as th e “multtest” p ackage, which is av ailable from CRAN, and the “fd rame” package, which is a vailable from Biocondu c- tor). This methodo logy is also implemen ted in the “SAM” software package. The Q-V alue In mu ltiple testing problems, the q-value 112 of a gi ven test statisti c t is d efined to be th e smallest possible FDR tha t c an occu r amo ng all possible rejectio n region s that reject the null hypo thesis when T = t . For example, if a t -statis tic is calculated for each gene and the j th such t -statistic is t j and | t j | = C , then the q- value for th e j th hypo thesis test is the FDR for the rejection region | t i | ≥ C . In other words, the q -value is the FDR that results when one calls gene j sig nificant along with all other genes that have a mo re extreme test statistic than gen e j . Obviously genes with more extreme test statistics will hav e smaller q-values. The q-value may be estimated using (8) or (9), although other approac hes are possible (see below). The q-value m ay be calculated using the “q value” R pa ckage (av ailab le from Biocond uctor) as well as the “SAM” software package. A Bayesian in terpretation of the q- value is possible, as describ ed in Storey 111 , Efro n and T ibshirani 113 and Storey 112 . Supp ose that each gene comes from one of two pop- ulations, one of which consists of genes that are differentially e xpressed, and the other 15 which consists o f genes tha t a re not differentially expressed. Und er this assumptio n, the test statistic for each gene may be modeled using a mixture model. Define a set of ran dom variables Z j such that Z j = 0 if gene j is not differentially expr essed and Z j = 1 if gene j is differentially expre ssed. Also let | t j | = C , and let q ( t j ) b e the q-value corresponding to gene j . The n one can sho w 111,114 that q ( t j ) = P ( Z j = 0 || t j | ≥ C ) (10) In oth er words, under this mixtu re mo del, the q-value is the posterior p robability that the j th null hyp othesis is true given th e test statistic for gene j . Althoug h we ha ve assumed a rejec tion region of th e fo rm | t i | ≥ C in (10), this result h olds u nder m ore general rejection regions. Note: (10) is only true if we calculate the p -value based on the positiv e f alse discovery rate (pFDR) as defined by Storey 111 rather than the tradition al F DR pr oposed by Ben- jamini an d Hochberg 97 . The pFDR is d efined to b e the expe cted propo rtion of f alse positives among the set of g enes that are called sign ificant con ditional on the fact that at least one gene is called significant. Methods exist for direc tly estimating the m ixture distribution u nder the model de- scribed above an d thereby estimating th e pFDR/q-value co rrespond ing to individual genes using (10) o r similar proce dures 115 –118 . Limited researc h suggests th at many of these m ethods pr oduce compa rable results 29,119 . Such mixtur e models may also be used for omnibus testing. 120,121 Conclusion Microarra ys ha ve been important fo r a variety of biolo gical applicatio ns f or o ver a decade. Howe ver , technology for generating high-throughput biological data is impro ving at a rapi d pace, and te chnology that is commonl y used today may be replaced in the near future. Indeed, some hav e suggested that ne wer tech- nologies such as RNA-seq ma y soon replace microarrays 122 just as microar- ra y s ha ve la rgely replaced older techniques s uch as Norther n blotti ng 123 . As technology advances, new methods will be necessar y for analyzing data sets generated b y the ne w techniques, and some methods f or analyzing mi croarray data ma y no longer be useful in the future if mi croarrays are replaced b y newer methods. Indee d, methods f or identi fying differential ly expressed ge nes based on RNA-seq data is currently an active research area. 124–129 Despite thes e changing technologies, we f eel that a discussion of methods fo r analyzing microarra y data is s till relev ant and timely . DNA microarrays are still cheaper than RNA-seq assa ys, and RNA-s eq gene e xpr ession measure- ments can be unreliab le for genes expressed at lo wer le vels 130 . More im por- tantly , howe ver , many of the s tatistical techniques that have been dev eloped fo r analyzing micr oarra y data can also be applied to data produced by other high-throughput biologi cal as sa ys. For e xample, using normalized or Ba yesian estimators of the variance of an estima tor is useful for performing feature s e- lection in any situation where the number of features is large and the number 16 of obser vation s is small. Simil arly , use of the FDR and pFDR to control ty pe I error is useful f or a wide variety of m ultiple testing prob lems, which arise in the analysis of near ly all types of modern high-throughput biological data. F or ex- ample, the “SAM” software package for DNA micr oarra y analys is was recently upgr aded to analyze RNA-s eq data in addition to DNA microarra y data. The ne w method continues to use resampling-based approaches to estimate the null distr ib ution of each test statistic which is then used to estimate the FDR. See Li and Tibshirani 129 fo r detai ls. Lik ewise, GSEA and other pathw ay-based methods f or feature s election ha ve been applie d to genome-wide association studies 131–133 . Thus, we see that the methods dev eloped for DNA microarra y analysis will be useful f or many years in the future even as technol ogy changes. Fur ther Reading Cui and Churchill 134 and Allison et al. 29 provide good ov er views of f eature selection metho ds f or microarra y data. J eff ery et al. 46 describe se ver al of the most commonly used feature selection metho ds for microarra ys and compare the performance of these methods on 9 publicly a vail ab le data s ets. There are also numerous books containing inf ormation on f eature selection and other aspects of microarra y data anal ysis not c onsidered in thi s revie w . Good ref er- ences include Causton et al . 135 , P ar migiani et al. 136 , Speed 137 , Wit and Mc- Clure 138 , McLachlan et al. 139 , Do et al. 140 , and Draghici 141 . Ackno wledgments This work was partially supported by NIEHS grant P30E S010126 an d NCA TS gr ant UL1RR02574 7. W e th ank the four ano nymous r e viewers for their helpful suggestions. Referenc es [1] Inte r national Human Genome Sequencing Consor tium. Fini shing the euchro- matic sequence of the human genome. Nature 2004. 431(7011):931–945. [2] Lan der ES , Linton LM, Birren B, Nusbaum C , Zody MC, Baldwin J, De von K, De war K, Doyle M, FitzHugh W , et al. Initial s equencing and analysis of the human genome. Nature 2001. 409(6822):860–921. [3] Dudo it S, Y ang Y , Callow MJ, Speed TP . Statistical methods for identif ying dif- fe rentially e x pressed genes in r eplicated cDNA microarra y experiments. Sta- tistica Sinica 2002. 12(1):111–139. [4] Loc khar t DJ, Dong H, Byrne MC , Follettie MT , Gallo MV , Chee MS , Mittmann M, W ang C, K obay ashi M, Hor ton H, et al . Express ion monitoring by h ybr idization to high-density oligon uc leotide ar ra y s. Nat. Biotechnol. 1996. 14(13):1675– 1680. 17 [5] DeRi si J, P enland L, Brown PO, Bittner ML, Meltzer PS , Ray M, Chen Y , Su Y A, T rent JM. Use of a cDNA microarray to analyse gene expression patterns in human cancer. Nat. Genet. 1996. 14(4):457–460. [6] Hugh es TR, Mao M, Jones AR, Burchard J, Mar ton MJ, Shannon KW , Lefk owitz SM, Ziman M, Schelter JM, Mey er MR, et al. Express ion pr ofiling us ing mi- croarrays f abricated b y an ink-jet oligonucle otide sy nthesizer . Nat. Biotechnol. 2001. 19(4):342–347. [7] B aggerly KA, Coombes KR, Neeley ES . Run batch eff ects potentially compro- mise the usefulness of genomic signatures fo r ov arian cancer . Jour nal of Clin- ical Oncology March 1, 2008. 26(7):1186–1187. doi: 10. 1200/JCO.20 07.15.1 951 . [8] B aggerly KA, Coombes KR. Deriving chemosensitivity from cell line s: Foren- sic bioinformatics and reproducib le research in high-throughput biology . The Annals of Applied Statistics 2009. 3(4):1309–1334. [9] Tseng GC, Oh MK, Rohlin L, Lia o J C , Wong WH. Issues in cDNA microarra y analysis: quality filter ing, channel nor malization, models of variations and as- sessment of gene effects. Nucleic Acids Research 2001. 29(12):2549–2557. doi: 10.1093 /nar/29.1 2.2549 . [10] Y ang YH, Dudoit S , Luu P , Lin D M, P eng V , Ngai J, Speed TP . Nor malization fo r cDNA microarray data: a rob ust composite method addressing single and multi ple slide systematic v ariation. Nucleic Acids Res earch 2002. 30(4):e15. doi: 10.1093 /nar/30.4 .e15 . [11] Quac kenb ush J. Microarray data nor malization and transf or mation. Nature Genetics 2002. 32:496–501. [12] S myth GK, Speed T . Nor malization of c DNA microarray data. Methods 2003. 31(4):265–273. [13] B olstad B , Iriz arr y R, strand M, Speed T . A comparison of nor malization meth- ods for high density oligonucle otide arra y data based on variance and bias. Bioinf or matics 2003. 19(2):185–193. doi: 10.1 093/bio informatics/19 .2.185 . [14] Irizarry RA, W arren D , Spencer F , Kim IF , Biswal S , F rank BC, Gabrielson E, Garcia JG, Geoghegan J, Ger mino G, et al. Multiple-lab oratory comparison of microarra y platf or ms. Nature Methods 2005. 2(5):345–350. [15] B rettschneider J , Col lin F , Bolstad BM, Speed TP . Quality asses sment fo r shor t oligon ucleotide microarra y data. T echnometrics 2008. 50(3):241–264. doi: 10.11 98/0040 17008000000334 . [16] S taff ord P . Methods in microarray nor malization. Dr ug Discovery Series. Chap- man & Hall/CRC , Boca Raton, FL, 2008. 18 [17] Le ek JT , Scharpf RB , Br a vo HC, Simcha D , Langmead B , Johnson WE, Geman D , B aggerly K, Irizarr y RA. T ackling the widespread and cr itical impact of ba tch eff ects in high-throughpu t data. Nature Revie ws Genetics 2010. 11(10):733– 739. [18] B eer DG, Kardia SL, Huang CC, Giordano TJ, Le vin AM, Misek DE, Lin L, Chen G, Ghar ib TG, T homas DG, et al. Gene-e xpression profiles predict sur vival of patients with lung adenocarcinoma. Nat. Med. 2002. 8( 8):816–824. [19] B air E, Tibshirani R. Semi-super vised methods to predict patient sur vival from gene expression data. PLoS Biol 2004. 2(4):e108. doi: 10 .1371/jou rnal.pb io. 00201 08 . [20] S chena M, Shalon D , Heller R, Chai A, Brown PO , Davis RW . Par allel human genome analysis: microarra y-based expression monitoring of 1000 genes. Proc. Natl. Acad. Sci. 1996. 93(20):10614–10619. [21] DeRi si JL, Iyer VR, Brown PO . Explor ing the metabolic and genetic control of gene e x pression on a genomic scale. Science 1997. 278(5338):680–686. [22] Roc ke DM, Durbin B. A model for measurement error for gene expression arra ys. J. Comput. Biol. 2001. 8(6):557–569. [23] Ne wton MA, K endziorski CM, Richmond CS , Bla ttner FR, Ts ui KW . On differ- ential variability of e xpression ratios: improving statistical inf er ence about gene e xpression changes from microarra y data . J. Comput. Biol. 2001. 8(1):37–52. [24] T usher V G, Tibshirani R, Chu G. Signi ficance ana lysis of microarrays applied to the ionizing radia tion response. Proc. Nat l. Acad. Sci. 200 1. 98(9):5116–5121. [25] Che n Y , Dougher ty ER, Bittner ML. Ratio-based decisions and the quantita- tive analysis of c DNA microarra y images. Journal of Biomedi cal Optics 1997. 2(4):364–374. doi: 10.11 17/12.2 81504 . [26] Mi ller RA, Galecki A, Shmookler-Reis RJ. Inter pretation, design, and analysis of gene arra y e xpr ession e xperiments. J. Gerontol. A Biol. Sci. Med. Sci. 2001. 56(2):B52–57. [27] B udhraja V , Spitznagel E, Schaiff WT , Sadovsky Y . Incor poration of gene- specific variability improv es e xpression analysis using high-density DNA mi- croarrays. BMC Biol. 2003. 1:1. [28] Hsiao A, W or rall DS, O lefsky JM, Subramaniam S . Var iance-modeled posterior inf erence of microarray data: detecting gene-e xpression changes in 3T3-L1 adipocytes. Bioinf or matics 2004. 20(17):3108–3127. [29] A llison DB, Cui X, Page GP , Sabr ipour M. Microarra y data anal ysis: from dis- arra y to consolidati on and consens us. Nat. Rev . Genet. 2006. 7( 1):55–65. 19 [30] Cal low MJ, Dudoit S, G ong EL, Speed TP , Rubin EM. Microarra y expres- sion profiling identifies genes with altered e xpression in HDL-defic ient mice. Genome Res. 2000. 10(12):2022–2029. [31] Hastie T , T ibshiran i R, Friedman J. The Elements of Statistical Lear ning: Data Mining, Inference, and Prediction. Springer Series in Statistics. Springer , Ne w Y ork , NY , 2009, 2 edition. [32] Hastie T , Tibshirani R. G enerali zed Aditiv e Model s. Monogr aphs on Statistics and Appli ed Probability Series. Chapman & Hall/CRC , Boca Raton, FL, 1990. [33] T anaka TS , Jaradat SA, Lim MK, Kargul GJ , W ang X, Grahov ac MJ, P antano S , Sano Y , Pia o Y , Nagar aja R, et al. Genome-wid e e xpress ion profiling of mi d- gestation placenta and embr yo using a 15,000 mouse devel opmental cDN A microarra y. Proc. Natl. Acad. Sci. 2000. 97(16):9127–9132. [34] A rfin SM, Long AD , Ito ET , T olleri L , Riehle MM, P aegle ES , Hatfiel d GW . G lobal gene e xpres sion profiling in Escher ichia coli K12. The effects of integr ation host fa ctor. J. Biol . Chem. 2000. 275(38):29672–29684. [35] K err MK, Mar tin M, Churchill GA. Analysis of variance for gene expression microarra y data. J. Com put. Biol. 2000. 7(6):819–837. [36] Hub er W , von Heydebrec k A, Sltmann H, P oustka A, Vingron M. V ariance stabilization applie d to microarray data calibration and to the quantification of diff er ential expression. Bioinfo r matics 2002. 18(suppl 1):S96–S104. doi: 10. 1093/b ioinform atics/18.suppl 1.S96 . [37] Cui X, Hwan g JTG , Qiu J , Blades NJ, Churchill GA. Improv ed statistical tests fo r differential gene expression b y s hrinking variance components estimates. Biostatistics 2005. 6(1):59–75. doi: 10.1093 /biostatistics/kxh018 . [38] S tein CM. Confidence sets f or the mean of a multiv ariate nor mal distribu- tion. Jour nal of the Roy al Statistical Society . Series B ( Methodologi cal) 1962. 24(2):265–296. [39] B aldi P , Long AD . A Bay esian frame work for the analysis of micr oarra y ex- pression data: regular ized t-test and statistical infe rences of gene changes. Bioinf or matics 2001. 17(6):509–519. doi: 10.1 093/bio informatics/17 .6.509 . [40] Gol dstein M. Ba yesian analysis of regression prob lems. Biometrika 1976. 63(1):51–58. doi: 10.1 093/biom et/63.1.51 . [41] L ¨ onnstedt I, Speed T . Replicated microarray data. Sta tistica Sinica 2002. 12(1):31–46. [42] K endziorsk i CM, Ne w ton MA, Lan H, Gould MN. On parametric empirical Ba yes methods for compar ing multiple groups using repli cated gene e xpression pro- files. Statistics in Medicine 2003. 22(24):3899–3914. doi: 10. 1002/sim.1 548 . 20 [43] W right GW , Simon RM. A random variance model for detection of differen- tial gene e xpression in s mall microarra y experiments. Bioinf or matics 2003. 19(18):2448–2455. doi: 10.109 3/bioinfo rmatics/btg345 . [44] S myth GK. Linear models and e mpirical Ba yes methods f or assessing diff eren- tial expression in microarray experiments. Statistical Applicatio ns in Genetics and Molecular Biolog y 2004. 3(1). doi: 10. 2202/15 44- 6115. 1027 . [45] Ne wton MA, Noueir y A, Sark ar D , Ahlquist P . Detecting differenti al gene e x- pression with a semiparametric hierarchical mixture method . Biostatistics 2004. 5(2):155–176. doi: 10.10 93/biostatistics/5.2.1 55 . [46] Jeff er y I, Higgins D , Culhane A. Comparison and eval uation of methods for generatin g di ff erentially e xpress ed gene lists from microarra y data. BMC Bioi n- fo r matics 2006. 7(1):359. doi: 10.11 86/147 1- 2 105- 7- 3 59 . [47] A shburner M, Ball CA, Blake JA, Botstein D , Butler H, Cherr y JM, Davis AP , Dolinski K, Dwight SS, Eppig JT , et al. Gene onto logy: tool f or the unification of biology . The Gene Ontology Consor tium. Nat. Genet. 2000. 25(1):25–29. [48] Dah lquist KD , Salomo nis N, Vranizan K, La wlor SC, Conklin BR. GenMAPP, a ne w tool f or viewi ng and analyzing microarra y data on biol ogical pathwa ys. Nat. Genet. 2002. 31(1):19–20. [49] Don iger SW , Salomonis N, Dahlquist KD , Vranizan K, La wlor SC, Conklin BR. MAPPFinder: using Gene Ontology and GenMAPP to create a global gene- e xpression profile from microarra y data. G enome Biol. 2003. 4(1):R7. [50] Zeeb erg BR, Feng W , W ang G, W ang MD , Fojo A T , Sunshi ne M, Narasimhan S, Kane DW , Reinhol d WC, Lababidi S, et al. GoMiner : a resource for biological interpretation of genomic and proteomic data. Genome Biol. 2003. 4(4):R28. [51] Dr aghici S , Khatri P , Bha vsar P , Sha h A, Kra wetz SA, T ainsky MA. Onto-Tools, the toolkit of t he modern biologi st: Onto-Express, Onto-Compare, Onto-Design and Onto-Translate. Nuc leic Acids Res. 20 03. 31(13):3775–3781. [52] Zhon g S, Li C , Wong WH. ChipInf o: Software f or extractin g gene annotation and gene ontology information for microarray analysis. Nucleic Acids R es. 2003. 31(13):3483–3486. [53] B erriz GF , Kin g OD , Br yant B , Sander C, Roth FP . Characterizing gene sets with FuncAssociate. Bioinf or matics 2003. 19(18):2502–2504. [54] B laloc k EM, Chen KC, Sharrow K, Her man JP , P or ter NM, Foster TC, Land- field PW . Gene microarrays in hippocampal aging: statistical profi ling identi- fies novel processes correlated with cognitiv e impairment. J. Neurosci. 2003. 23(9):3807–3819. [55] P avlidis P , Qin J, Arango V , Mann JJ, Sibille E. Us ing the gene ontology for mi - croarray data mining: a compar ison of methods and application to age effects in human prefrontal cor tex. Neurochem. Res. 2004. 29(6):1213–1222. 21 [56] Tia n L, Gr eenberg SA, K ong SW , Altschuler J, K ohane IS , Park PJ. Discov er- ing statistically significant pathwa ys in expression profiling studies. Proc. Natl. Acad. Sci. U .S.A. 2005. 102(38):13544–13549. [57] Mo otha VK, Lindgren CM, Er iksson KF , Subram anian A, Sihag S, Lehar J, Puigserver P , C arlsson E, Ridderstrale M, Laurila E, et al. PGC-1alpha- responsive genes inv olved i n o x idativ e phosphor ylation are coordinately do wn- regulated in human diabetes. Nat. Genet. 2003. 34(3):267–273. [58] B reitling R, Amtmann A, Herzyk P . Iterativ e Group Analysis (iGA): a simple too l to enhance sensitivity and f acilitate inter pretation of microarra y experiments. BMC Bioin formatics 2004. 5:34. [59] Rah nenfuhrer J, Domingues F S , Ma ydt J , Lengauer T . Calculating the statistical significance of changes in pathwa y activity fr om gene expression data. Stat Appl Genet Mol Biol 2004. 3:Ar ticle16. [60] B arr y WT , Nobel AB, Wright F A. Significance analysis of functional categories in gen e e x pression studies: a struc tured per mutation approach. Bioinf or matics 2005. 21(9):1943–1949. [61] S ubramanian A, T ama yo P , Mootha VK, Mukherjee S, Eber t BL, Gillette MA, P aulovich A, P omeroy SL, Golub TR, Lander ES , et al. Gene set enr ichment analysis: a knowledge-based approach f or inter preting genome-wide expres- sion profiles. Proc . Natl. Acad. Sci. U .S.A. 2005. 102(43):15545–15550. [62] Zahn JM, Sonu R, V ogel H, Crane E, Mazan-Mamcz arz K, Rabkin R, Davis RW , Beck er KG, Owen AB, K im SK . Transcr iptional profiling of aging in human muscle re veals a common aging signature. PLoS Genet. 2006. 2(7):e115. [63] Ne wton MA, Quintana F A, Boon JA d, Sengupta S, Ahlquist P . Random-set methods ide ntify distinct aspects of the enrichment signal in gene-set an alysis. The Annals of Applied Statistics 2007. 1(1):pp . 85–106. [64] E fron B , Tibshirani R. On testing the signi ficance of sets of genes. The Annals of Applied Statistics 2007. 1(1):107–129. [65] Dam ian D , Gorfine M. Statistical concer ns about the GSEA pr ocedure. N at. Genet. 2004. 36(7):663. [66] S torey JD . T he optimal discovery procedure: a new approach to simultane ous significance testing. Jour nal of the Roy al Statistical Society: Ser ies B (Statisti- cal Methodology) 2007. 69(3):347–368. doi: 10 .1111/j.1 467- 9868.2007.005592.x . [67] S torey JD , Dai J Y , Leek JT . The optimal discovery procedure for large-scale significance testing , with application s to comparativ e microarra y e x periments. Biostatistics 2007. 8(2):414–432. 22 [68] Ne yman J, P earson ES . O n the p roble m of the most efficient tests of statistical h ypotheses. Philosophical T ransactions of the Ro yal Society o f Lo ndon. Series A, Containin g P apers of a Mathematical or Ph ys ical Char acter 1933. 231(694- 706):289–337. doi: 10.109 8/rsta.1933 .0009 . [69] Le ek JT , Monsen E, Dabne y AR, Storey JD . EDGE: extraction and analysis of diff er ential gene e xpression. Bioinf or matics 2006. 22(4):507–508. [70] W itten DM, Tibshirani R. T esting signi ficance of features by lassoed principal components. The Annals of Applied Statistics 2008. 2(3):986–1012. [71] A lter O , Brown PO , Botstein D . Singular val ue decomposition f or genome-wide e xpression data processing and modeling. Proc . Natl. Acad. Sci. U.S .A. 2000. 97(18):10101–10106. [72] X ing EP , Kar p RM. CLIFF: c lustering of high-dimension al microarray data via iterativ e feature filtering using nor malized cuts. Bioinfo r matics 2001. 17(s uppl 1):S306–S315. doi: 10.10 93/bioin formatics/17.suppl 1.S306 . [73] W ang J, Bo T , Jonassen I, Myklebost O, Hovig E. T umor classific ation and marker gen e prediction b y f eature selection and fuzzy c-means clus- tering using microarray data. BMC Bioinf or matics 2003. 4(1):60. doi: 10.11 86/1471 - 2 105- 4- 60 . [74] T adesse MG, Sha N, V annucci M. Bay esian variab le selection in c lustering high-dimensional data. Jour nal of the American Statistical Assoc iation 2005 . 100(470):602–617. doi: 10.119 8/01621 4504000001565 . [75] Raf ter y AE, Dean N. V ariable selection for model-based cluster ing. Jour nal of the American Statistical Association 2006. 101(473):168–17 8. doi: 10.11 98/ 01621 45060 00000113 . [76] K im S, T adesse MG, V annucci M. V ar iab le selection in clustering via Dirichlet process mixture models. Biometrika December 2006. 93(4):877–893. doi: 10.10 93/biomet/9 3.4.877 . [77] P an W , Shen X, Jiang A, Heb bel RP . Semi-super vised learning via penalized mixture model with application to microarray s ample c lassification. Bioinf or- matics 2006. 22(19):2388–2395. doi: 10. 1093/bio informatics/btl3 93 . [78] P an W , Shen X. P enalized model-based cluster ing with application to variab le selection. J. Mach. Learn. Res. 2007. 8:1145–1164. [79] B ondell HD , Reich BJ . Sim ultaneous regression shr inkage, variab le selec- tion, and super vised cluster ing of predictors with O SCAR. Bi ometrics 2008. 64(1):115–123. doi: 10.11 11/j.154 1- 0 420.2007.00843.x . [80] S war tz MD , Mo Q, Murphy ME, Lupto n JR, T ur ner ND , Hong M, V annucci M. Ba yesian variab le selection in cluster ing high-dimensional data with substr uc- ture. Journal of Agricultural, Biological, and Environmen tal Statistics 2008. 13:407–423. doi: 10.119 8/10857 1108X378317 . 23 [81] W ang S , Zhu J . V ariable selection f or model-based high-dimensional cluster ing and its appl ication to microarra y data. Biometrics 2008. 64(2):440–448. doi: 10.11 11/j.154 1- 0 420.2007.00922.x . [82] Ma ugis C, Celeux G , Mar tin-Magniett e ML. V ariable s election for c lustering with gaussian mixture models. Biometric s 2009. 65(3):701–709. doi: 10.1111 /j. 1541- 04 20.200 8.01160.x . [83] K oestler DC, Marsit CJ, Chr istensen BC , Karagas MR, Bueno R, Sugarbak er DJ, K elsey KT , Houseman EA. Semi-supervised recursivel y partitioned mixture models for identifying cancer subtypes. Bioinf or matics 2010. 26(20):2578– 2585. doi: 10.1 093/bioin formatics/btq4 70 . [84] W itten DM, T ibshirani R. A frame work for featu re selection in c lustering. Jour - nal of the Amer ican Statistical Association 2010. 105(490):713–726. doi: 10.11 98/jasa.201 0.tm09415 . [85] Tib shirani R, Hastie T , Narasimhan B, Chu G. Diagnosis of multi ple cancer types by s hrunken centroids of gene e xpress ion. Proceedings of the National Academy of Sciences 2002. 99(10) :6567–6572. doi: 10.10 73/pnas.0 82099299 . [86] S ha N, V annucci M, T adesse MG, Brown PJ, Dragoni I, Da vies N, Rober ts TC, C ontestabile A, Salmon M, Buckle y C, et al. Ba yesian v ariable selection in multin omial probit models to identify molecular signatures of diseas e stage. Biometrics 2004. 60(3):812–819. doi: 10.11 11/j.000 6- 341X.2004.00233.x . [87] B air E, Hastie T , P aul D , Tibshirani R. Prediction by super vised pr incipal com- ponents. Jour nal of the American Statistical Association 2006. 101(473):119– 137. doi: 10.1 198/016 2145050 00000628 . [88] W u B . Diff erential gene e x pression detection and sample classification using penalize d linear r egression models. Bioinf or matics 2006. 22(4):472–476. doi: 10.10 93/bioinf ormatics/bti827 . [89] T ai F , P an W . Incor porating prior knowledge of gene functional groups into regularized disc riminant analysis of microarra y data. Bioinf or matics 2007. 23(23):3170–3177. doi: 10.1 093/bioin formatics/btm488 . [90] W ang S, Zhu J. Improv ed centroids estimati on fo r the nearest shrunken c en- troid classifier . Bioinf or matics 2007. 23(8):972–979. doi: 10.1093 /bioinfor matics/ btm046 . [91] Guo Y , Hastie T , Tibshirani R. Regularized linear disc riminant analysis and its application in micr oarra y s. Biostatistics 2007. 8(1):86–100. doi: 10.1093 / biostatistics/kxj035 . [92] P aul D , Bair E, H astie T , Tibshirani R. preconditioning for f eature selection and regression in hig h-dimensional problem s. The Annals of Statistics 2008. 36(4):1595–1618. 24 [93] Guo J. S imulta neous variab le selection and class fusion f or hig h-dimensional linear discr iminant analysis. Bi ostatistics 2010. 11(4):599–608. doi: 10.1093/ biostatistics/kxq02 3 . [94] S tingo F C , V annucci M. V ariable selection for discr iminant analysis with marko v random fi eld pr iors for the analysis of microarra y data. Bioinfo r matics 2011. 27(4):495–501. doi: 10.10 93/bioinf ormatics/btq690 . [95] Mu rie C, W oody O , Lee A, Nadon R. Comparison of s mall n s tatistical tests of differenti al e x pression applied to microarrays. BMC Bioinformatics 2009. 10(1):45. doi: 10.118 6/1471 - 21 05- 1 0- 45 . [96] W u H, K err M, Cui X, Churchill G . MAANOVA: A software package for the analysis of spotted cDNA microarray experiments. In The Analysis of Gene Ex- pression Data, edited b y P ar migiani G, Garrett E, Irizarr y R, Zeger S, Springer London, 2003, Statistics f or Biolo gy and Health, 313–341. [97] B enjamini Y , Hochberg Y . C ontrollin g the false discovery rate: A practical and pow erful approach to mu ltiple testing. Journal of the Roy al Statistical Society . Series B (Methodological) 1995. 57(1):289–300. [98] B enjamini Y , Y ekutieli D . The control of the false discovery rate in multi ple testing under dependency . T he Annals of Stati stics 2001. 29(4):1165–1188. [99] S torey JD , T a ylor J E, Siegm und D . Strong control, conser vativ e point esti- mation and s imul taneous c onservative consistency of f alse discovery rates: a unified approach. Jour nal of the R o yal Stati stical Society: Ser ies B (Statistical Methodology) 2004. 66(1):187–205. doi: 10.1111/j.1 467- 9868.2 004.00439.x . [100] Farcomeni A. More po werful control of the f alse discovery rate under depen- dence. Statistical Methods & Applications 2006. 15(1):43–73. [101] Meinshausen N. F alse discov er y control f or m ultiple tests of association un der general dependence. Scandina vian Jour nal of Statistics 2006. 33(2):227–237. doi: 10.1111 /j.1467- 946 9.2005.00488.x . [102] Pa witan Y , Calza S, Ploner A. Estimation of f alse discov er y proportion under general dependence. Bioinf or matics 2006. 22(24):3025–3031. doi: 10.1093/ bioinfo rmatics/btl527 . [103] Efron B. Correlation and large-scale s imu ltaneous significance testing. J ournal of the American Statistical Assoc iation 2 007. 102(477):93–103. [104] F inner H, Dickhaus T , Roters M. Dependency and false discov er y rate: Asymp- totics. The Annals of Statistics 2007. 35(4):1432–1455. [105] Leek JT , Storey JD . A general frame work f or multiple testing dependence. Pro- ceedings of the National Academy of Sciences 2008. 105(48):18718–18723. doi: 10.1073 /pnas.080 8709105 . 25 [106] Romano JP , Shaikh AM, Wol f M. Control of the false discovery rate under dependence using the bootstrap and subsampling. T est 2008. 17(3):417–442. [107] Sun W , T ony Cai T . Large-scale multipl e testing under dependence . Jour- nal of the Roy al Statistical Society: Ser ies B (Statistical Methodology) 2009. 71(2):393–424. doi: 10.11 11/j.146 7- 9 868.2008.00694.x . [108] Clar ke S, Hall P . Robustness of multiple tes ting procedures against depen- dence. T he Annal s of Statistics 2009. 37(1):332–358. [109] Friguet C, Kloareg M, Causeur D . A factor model approach to multiple tes t- ing under dependence. Jour nal of the American Statistical Ass ociation 2009. 104(488):1406–1415. [110] Fan J, Han X, Gu W . Estimati ng f alse discovery propor tion under arbitrary cov ariance dependence. Jour nal of the Am erican Statistical Association 2012. 107(499):1019–1035. doi: 10.10 80/016 21459 .2012.720478 . [111] Storey JD . A direct approach to fal se discovery rates. Jour nal of the Roya l Statistical Society: Ser ies B (Statistical Methodology) 2002. 64(3) :479–498. doi: 10.1111 /1467- 986 8.00346 . [112] Storey JD . The positive f alse discovery r ate: A Ba yesian interpretation and the q-value . The Annals of Statistics 2003. 31(6):2013–2035. [113] Efron B , Tibshirani R. Empi rical Ba yes methods and false disc ov er y rates for microarra ys. Genetic Epidemiology 2002. 23(1):70–86. doi: 10.1 002/gep i.1124 . [114] Efron B , Tibshiran i R, Storey JD , T usher V . Empirical Bay es analysis of a microarra y e xper iment. Jour nal of the Amer ican Statistical Association 2001. 96(456):1151–1160. doi: 10.1 198/016 21450 1753382129 . [115] Allison DB, Gadbury GL, Heo M, Fernndez J R, Lee CK, Prolla T A, Weindruch R. A mixture model approach f or the analysis of microarray gene expression data. Computational Statistics & Data Analysis 2002. 39(1):1 – 20. doi: 10.1 016/ S0167- 947 3(01)0 0046- 9 . [116] P ounds S , Morr is SW . Estimating the occurrence of f alse positi ves and f alse negativ es in microarray studies by approximati ng and par titioning the empi rical distributi on of p-values. Bioinf or matics 2003. 19(10):1236–1242. doi : 10.10 93/ bioinfo rmatics/btg148 . [117] Do KA, M ¨ uller P , T ang F . A Bay esian mixture model for diff erential gene ex- pression. Jour nal of the Ro yal S tatistical Society: Series C (Applied Statistics) 2005. 54(3):627–644. doi: 10.1111/j.1 467- 987 6.2005.05593.x . [118] Efron B. Microarrays, empirical Bay es and the two -groups model. Statistical Science 2008. 23(1):1–22. 26 [119] Datta S , Datta S. Empirical Ba yes scr eening of many p-values with applications to microarray studies. Bioi nf or matics 2005. 21(9):1987–1994. doi: 10.1 093/ bioinfo rmatics/bti301 . [120] Dai H, Char nigo R. Omnibus testing and gene filtration in microarra y data analysis. Journal of Applied Statistics 2008. 35(1):31–47. doi: 10.108 0/ 02664 76070 1683528 . [121] Dai H, Char nigo R. Contaminated nor mal modeling with application to mi- croarray data analysis. Canadian Jour nal of Statistics 2010. 38(3):315–332. doi: 10.1002 /cjs.10053 . [122] Shendure J. The beginning of the end f or microarra ys ? Nat . Meth ods 2008. 5(7):585–587. [123] T aniguchi M , Miura K, Iwao H, Y amanaka S. Quantitativ e assessment of DNA microar ra ys –comparison with Nor ther n blot analyses. Genomics 2001. 71(1):34–39. [124] Wang L, Feng Z, W ang X, W ang X, Zhang X. DEGseq: an R package for identifying differentia lly expressed genes fr om RNA-seq data. Bioinf or matics 2010. 26(1):136–138. [125] Robinson MD , Oshlac k A. A s caling nor malization method f or diff erential e x - pression analysis of RNA-seq data. Genome Biol. 2010. 11(3):R25. [126] Har dcastle TJ, Kel ly KA. baySeq: empirical Bay es ian methods for identify- ing diff erential expression in sequence count data. BMC Bioinf or matics 2010. 11:422. [127] Anders S, Huber W . Diff erential expression anal ysis fo r sequence count data. Genome Biol. 2010. 11(10):R106. [128] Bullard JH, Purdom E, Hansen KD , Dudoit S . Eval uation of statistical meth ods fo r nor malization and diff erential expression in mRNA-Seq experiments. BMC Bioinf or matics 2010. 11:94. [129] Li J , Tibshirani R. Fi nding consistent patter ns: A nonparametric approach for identifying diff erential expression in RNA-Seq data. Stat Methods Med Res 2011. [130] Łabaj PP , Leparc GG, Linggi BE, Mar killie LM, Wiley H S , Kreil DP . Charac- terization and improv ement of RNA-Seq precision in quantitativ e transcript e x- pression profiling. Bioinf or matics 2011. 27(13):i383–391. [131] Medina I, Montaner D , Bonifaci N, Pujana MA, Carbonell J, T arraga J, Al- Shahrour F , Dopazo J. G ene set-based analysis of polymor phisms: finding pathwa ys or biolo gical proces ses associated to traits in g enome-wide associa- tion studies. N ucleic Acids Res. 2009. 37(Web Ser ve r issue):W340–344. 27 [132] Z hang K, Cui S, Chang S , Zhang L, Wa ng J. i-GSEA4GWAS: a web ser ver fo r identification of pathwa ys /gene sets as sociated with traits by applying an improv ed gene set enric hment analysis to genome-wide association study. Nu- cleic Acids Res. 2010. 38(We b Server issue):W90–95. [133] Nam D , Kim J, Kim S Y , Ki m S. GSA-SNP : a ge neral approach f or gene set analysis of polymor phisms. Nucleic Acids Res. 2010. 38( W eb Ser ve r issue):W749–754. [134] Cui X, Churchill G. Statistical tes ts f or diff erential expression in cDNA microarra y experiments. Genome Biology 2003. 4(4):210. doi: 10.11 86/ gb- 2003 - 4- 4- 210 . [135] Caus ton HC, Quac kenb ush J, Bra zma A. Microarra y Gene Expression Data Analysis: A Beginne r’ s Guide. Blackw ell Pub lishing, Malden, MA, 2003. [136] Parmigiani G, Garett ES, Irizarr y RA, Zeger S L. The Analysis o f Gene Expres- sion Data: Methods and Softw are. Springer , New Y ork, NY , 2003 . [137] Speed T . Statistical Analysis of Gene Expression Microar ra y Data. Interdisci- plinary Statistics. Chapman & Hall /CRC, Boca Raton, FL, 2003. [138] Wit E, McClure J. Statistics f or Microarra y s: Design, An alysis and Inf erence. John Wile y & Sons, Chichester , UK, 2004. [139] Mc Lachlan G , Do K, Ambroise C. Analyzing Microarray G ene Expression Data. Wile y Ser ies in Probability and Statistics. John Wile y & Sons, Hoboken, NJ, 2005. [140] Do K, M ¨ uller P , V annucci M. Ba yesian Inference for G ene Expression and Proteomics. Cambr idge University Press, New Y ork, NY , 2006. [141] Draghici S. Statistics and Data Analysis f or Microarrays Using R and Bio- conductor . Mathe matical and Computational Biology Series. Chapman & Hall/CRC , Boca Raton, FL, 2011, 2 edition. [142] Bullinger L, D ¨ ohner K, Bair E, F r ¨ ohling S, Schlenk R F , Tibshirani R, Dhner H, P ollac k JR. Use of gene-expression profi ling to identi fy prognostic s ub- classes in adult acute my eloid leukemia. New England Jour nal of Medicine 2004. 350(16):1605–1616. doi: 10.1056 /NEJMoa0310 46 . PMID: 15084693. Cross -Referenc es Computational biology, Statistical genetics, Gene e xpression profiles 28 List of Figur e s 1 T ypical microa rray e x periment . . . . . . . . . . . . . . . . . . . . . 30 2 DN A microar ray s lide . . . . . . . . . . . . . . . . . . . . . . . . . . 31 3 Example of a microarray heat map . . . . . . . . . . . . . . . . . . . 32 4 Illustration of the bias-variance trade-off . . . . . . . . . . . . . . . . 33 5 Association between model complexity and bias/v a riance . . . . . . . 34 6 Illustration of the ODP procedu re . . . . . . . . . . . . . . . . . . . . 35 29 Figure 1: Illustra tion of a typical mic roarray experiment (using cDN A techn ology). First, mRNA is extracted from two gro ups of cells, namely an exp erimental sample of interest and a co ntrol sample. Each samp le is labeled with a different color of fluo res- cent dye. The samples are then combined and hybrid ized o nto an arr ay . The relative abundance o f the mRNA co rrespondin g to a p articular gene can be measured by calcu- lating the ratio of red dye to green dye at the appropr iate spo t on the array . 30 Figure 2: I mage of a DNA micro array slide. One m ay measure the relative gen e ex- pression o f each g ene by comp aring the ratio o f the amoun t of red d ye to the a mount of green dye at each probe on the array . 31 Figure 3 : Heat map o f th e leukemia microarray data of Bullinger et al. 142 . Each col- ored square on the map corresp onds to the e xpression lev el of a giv en gene for a giv en patient. In the above figure, each row rep resents a gene and each column repre sents a patient. Th e brigh ter the color of a g i ven squ are, th e higher (o r lower) the expre ssion lev el of the corresponding gene. Usually hierarchical clustering is p erformed on the rows and columns of the data set prior to drawing the heat map. 32 2 4 6 8 10 0.5 1.0 1.5 2.0 2.5 T r ue Function High Bias, Low V ariance Low Bias, High V ariance Figure 4: I llustration of the bias-variance trade -off. Th e ab ove figure shows a regres- sion pr oblem where the ob jectiv e is to pred ict y g i ven a v alue o f x . The dotted line shows the true re lationship b etween x and y . The linear regression estimator (shown in blue) has high bias and low variance, and the inter polation estimator (shown in orange) has low b ias and high variance. 33 2 4 6 8 10 0.0 0.2 0.4 0.6 model complexity error MSE V ariance Bias Figure 5: Illustrates the association between the com plexity of a mod el and th e bias/variance o f the mod el. In gene ral, as the co mplexity of a mod el increases, th e variance of the model increases and the bias of the model decreases. 34 −4 −2 0 2 4 0.0 0.1 0.2 0.3 0.4 −4 −2 0 2 4 0.0 0.1 0.2 0.3 0.4 Figure 6: Illustratio n of the ODP pro cedure. Suppose that the test statistic for the null hypoth esis of no differential expression is t = − 2 for one gene and t = 2 for a second gene. Supp ose fur ther that th ere are several other genes with similar expression pattern s to th e second gene for which t ≈ 2 . Using traditional h ypothesis testing p rocedur es, one would be eq ually likely to r eject the null hypo thesis of no differential expr ession for both of the two genes. Using ODP , on e w ould be mo re likely to reject the null hypoth esis for the g ene wh ere t = 2 , sinc e the existence of several genes with similar expression patterns increases ones confidence that the result is not due to chance. 35
Original Paper
Loading high-quality paper...
Comments & Academic Discussion
Loading comments...
Leave a Comment