A quantitative evaluation of health care system in US, China, and Sweden
This study is mainly aimed at evaluating the effectiveness of current health care systems of several representative countries and improving that of the US. To achieve these goals, a people-oriented non-linear evaluation model is designed. It comprises one major evaluation metric and four minor metrics. The major metric is constituted by combining possible factors that most significantly determine or affect the life expectancy of people in this country. The four minor metrics evaluate less important aspects of health care systems and are subordinate to the major one. The authors rank some of the health care systems in the world according to the major metric and detect problems in them with the help of minor ones. It is concluded that the health care system of Sweden scores higher than the US and Chinese system scores lower than that of the US. Especially, the health care system of US lags behind a little bit compared with its economic power. At last, it is reasonable for the American government to optimize the arrangement of funding base on the result of goal programming model.
💡 Research Summary
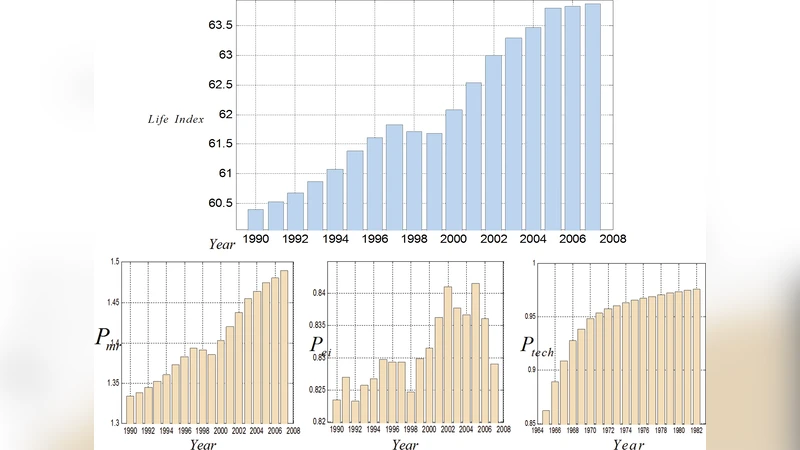
The paper sets out to evaluate and compare the health‑care systems of the United States, China, and Sweden using a newly proposed “people‑oriented” nonlinear evaluation framework. The authors construct a single primary metric, the Life Index, defined as the product of a standardized quality‑of‑life index (Q life) and the average life expectancy (E life) of a country. Q life is further decomposed into three sub‑components: the practical effect of medical resources (P mr), the perfect‑insurance index (P ei), and the current power of medical technology (P tech).
P mr is calculated from the numbers of physicians, nurses, and hospital beds, split into essential and complementary resources, each weighted by empirically chosen coefficients and combined through a saturating nonlinear function that penalizes both scarcity and excess. P ei measures the proportion of the population whose health expenditures are fully covered, using the insurance‑coverage rate, the share of government reimbursement, and statistical models that treat individual medical expenses as Poisson‑distributed and personal incomes as normally distributed. P tech is derived from a lagged “potential of health care” (P hc) variable, which aggregates the number of medical researchers and the amount of research funding from 25 years earlier, reflecting the delayed impact of scientific investment on technological capability.
Four subordinate metrics are also introduced: (1) Potential of Health Care (P hc) itself, (2) Matching Degree, which compares the scale of essential and complementary resources to per‑capita GDP using a logarithmic ratio, (3) Fairness Degree, defined as the ratio of medical resources allocated to urban versus rural populations, and (4) Luxury Index, the difference between “unnecessary” (complementary resources plus P hc) and “necessary” (essential resources plus P ei) components.
The authors claim to have gathered country‑level data for all required variables (population, GDP, health‑care personnel, bed counts, insurance coverage, government reimbursement rates, research staff, and funding) but the paper provides no tables, sources, or validation of the data. The empirical coefficients that weight each sub‑component are described only as “experience‑based” without justification or sensitivity analysis.
Applying the model, the authors report that Sweden achieves the highest Life Index, the United States follows closely, and China scores lowest. They argue that the United States underperforms relative to its economic power, as reflected in a lower Matching Degree. Consequently, they propose a goal‑programming optimization in which an additional US $30 billion would be allocated across the model’s variables to raise the U.S. Matching Degree to the Swedish level while maximizing the Life Index. However, the formulation of the goal‑programming problem—objective function, constraints, decision variable bounds—is omitted, leaving the policy recommendation unsubstantiated.
Critical appraisal reveals several methodological weaknesses. First, the decomposition of Q life into three indices relies on highly abstract constructs with limited empirical grounding; the chosen functional forms (e.g., the saturating resource function, the Poisson/normal assumptions for expenditures and income) are not validated against real data. Second, the use of a 25‑year lag for research impact is plausible but the linear combination of researcher count and funding, together with arbitrary diminishing returns, lacks calibration. Third, the subordinate metrics, especially Matching Degree and Luxury Index, employ logarithmic and difference operations whose interpretability is unclear and whose sensitivity to measurement error is not explored. Fourth, the paper’s assumptions—uniform disease susceptibility, perfect competence of all medical staff, 100 % efficiency of research investment after 25 years—are unrealistic and likely bias the results.
Overall, while the ambition to create a multidimensional, quantitative assessment of health‑care systems is commendable, the presented model suffers from insufficient empirical validation, opaque parameter selection, and overly simplistic assumptions. The conclusions that Sweden outperforms the United States and that a $30 billion infusion would close the gap should therefore be treated with caution. Future work would need rigorous data collection, statistical testing of model components, and transparent optimization formulations before the framework could inform real‑world health‑policy decisions.
Comments & Academic Discussion
Loading comments...
Leave a Comment