Impact maturity times and citation time windows: The 2-year maximum journal impact factor
Journal metrics are employed for the assessment of scientific scholar journals from a general bibliometric perspective. In this context, the Thomson Reuters journal impact factors (JIF) are the citation-based indicators most used. The 2-year journal …
Authors: - **원저자**: (논문에 명시된 저자명 기재 필요) - **소속**: (예: 대학·연구기관)
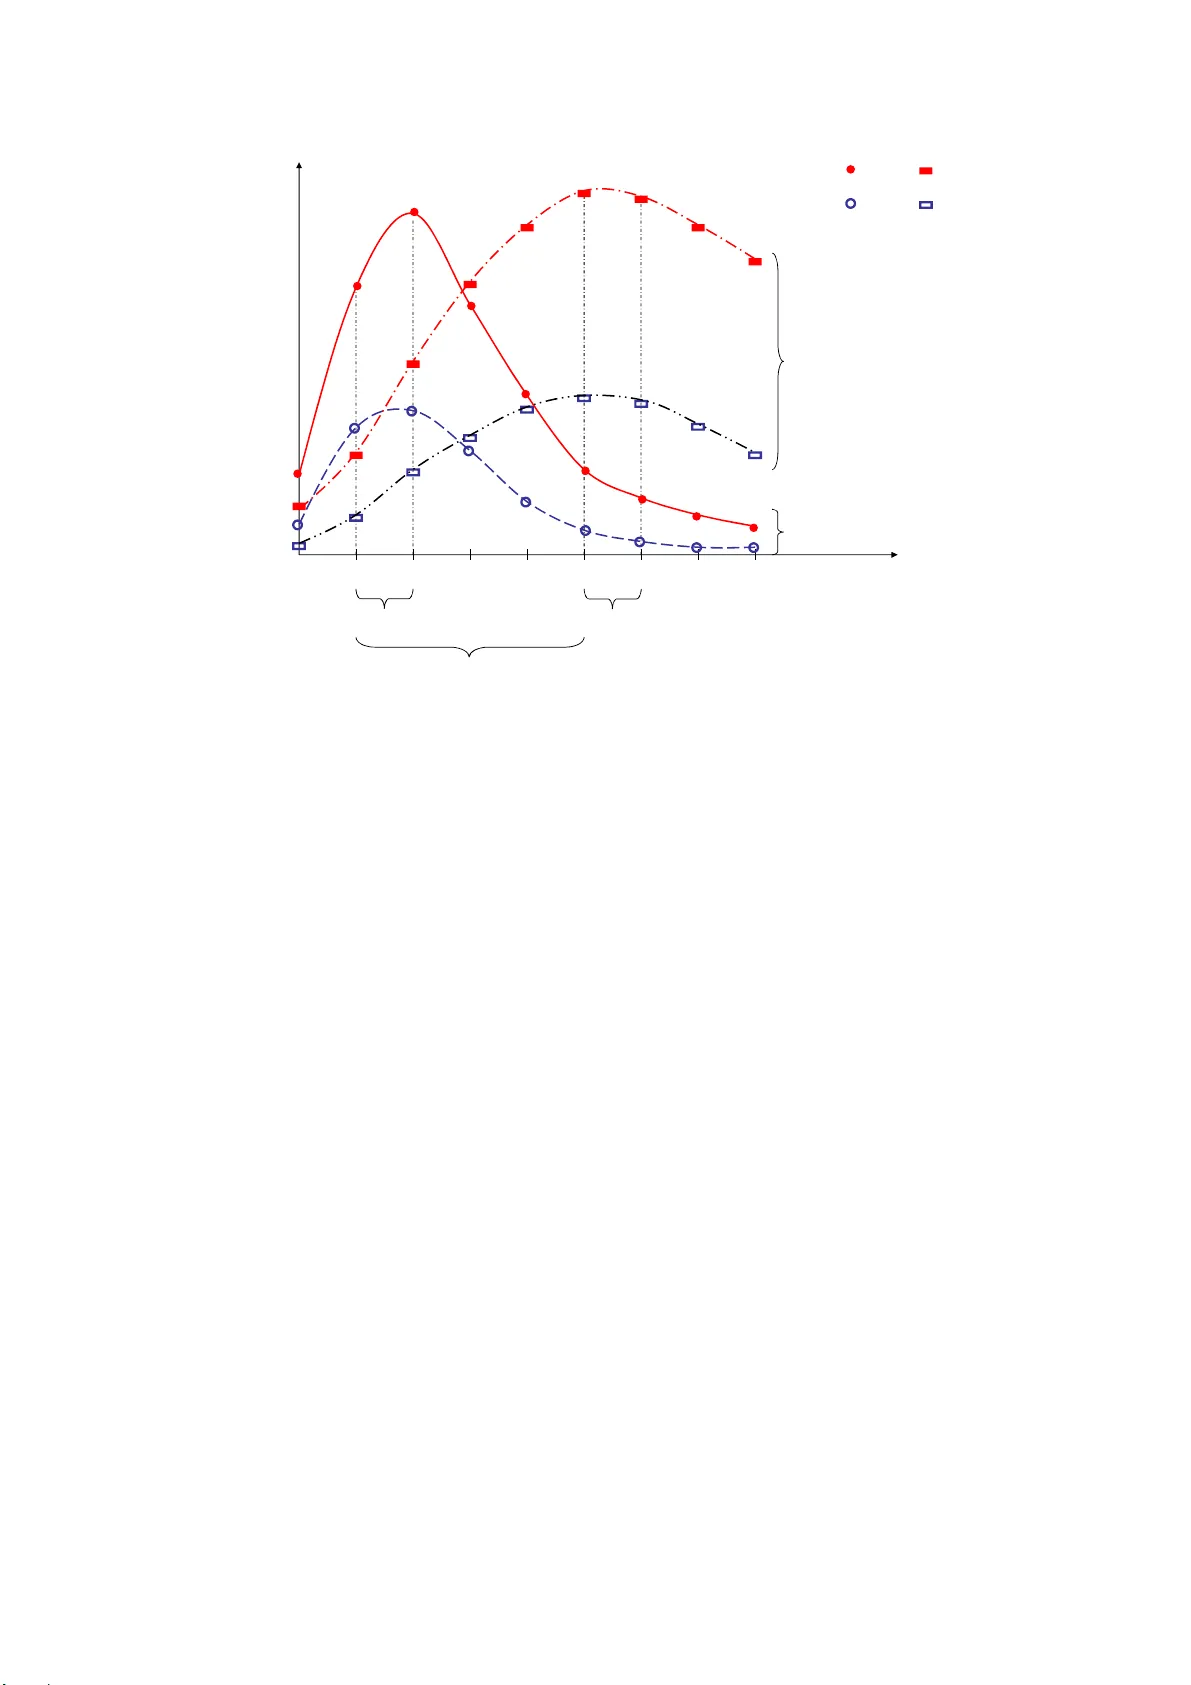
1 Impact maturity times and citation time window s: The 2-year maximum journal impact factor P. Dorta-González a* , M.I. Dorta-González b a Departamento de Métodos Cuantitativos en Economía y Gestión, Univ ersidad de Las Palmas de Gran Canaria, Gran Canaria, España; b Departamento de Estadística, Investigación Operativa y Computación, Universidad de La Laguna, Tenerife, España. ABSTRACT Journal metrics are employed for the as sessment of scientific scholar journals from a genera l bibliometric perspective. In this context, the Thomson Reuters journal impact factors (JIF) are the citation-based indicators most used. The 2-year journal i mpact factor ( 2-JIF ) counts citations to one and two year old articles, while the 5-year journal impact factor ( 5-JIF ) counts citations from one to five year old articles. Nevertheless, these indicators are not comparable among fields of science for two reasons: (i) each field has a different impact maturity time, and (ii) because of systematic differences in publication and citation behaviour across disciplines. In fact, the 5-JIF firstly appeared in the Journal Citation Reports (JCR) in 2007 with the purpose of m aking more comparable impacts in fields in which impact matures slowly . However, th ere is not an optimal fixed impact maturi ty time valid for all the fields. In some of them two years provides a good performance whereas in others three or more years are necessary. Therefore, there is a problem when comparing a journal from a field in which impact matures slowly with a journal from a field in which impact matures rapidly. In this work, we propose the 2-year maxim um journal impact factor ( 2M-JIF ), a new impact indicator that considers the 2-year rolling citation time window of maximum impact instead of the previous 2-year time window. Finally, an empirical application comparing 2-JIF , 5-JIF , and 2M-JIF shows that the maximum rolling target window reduces the between-g roup variance with resp ect to the within-group variance in a random sample of about six hundred jo urnals from eight different fields. Keywords: Journal assessment, Journal metrics, Biblio metric indicator, Citation analysis, Journal impact factor, Citation time wi ndow, Impact maturity time. 2 1. Introduction This work is related to journal metrics and citation-based indicators f or the assessment of scientific scholar journ als from a general b ibliometric perspective. During decades, the journal impact factor (JIF) has been an accepted indicator in ranking journals, however, there are increasing arguments against the fairness of using the JIF as the sole ranking criteria (Waltman & Van Eck, 2013). The 2-year impact factor published by Thomson Reuters in the Journal Citation Reports (JCR) is defined as the average number of refere nces to each jou rnal in a current year with respect to ‘citable items’ published in that j ourn al during the two preceding years (Garfield, 1972). Since its formulation, the JI F has been criticized for some arbitrary decisions involved in its construction. The definition of ‘citable items’ (inclu ding letters and peer reviewed papers – articles, proceedings papers, and reviews – ), the focus on the two preceding years as representation of impact at the research front, etc., have been discussed in the literature (Bensman, 2007; Moed et al., 201 2) and have given rise to suggestions of m any possible modifications and improvements (Althouse et al., 2009; Bornm ann & Daniel, 2008). In response, Thomson Reuters has incorporated the 5-year impact factor , the eigenfactor score , and the article influence score (Bergstrom, 2007) to the journa ls in the online ver sion of the JCR since 2007. These journal indicators are most useful for comparing journals in the sam e subject category. In this respect, the 2-year and the 5-year impact factor lead statistically to the same ranking (Leydesdorff, 2009; Rousseau, 2009). Yet, it seems that in m any cases, but not always, the 5-year impact factor is larger than th e 2-year one (Rousseau, 2009). However, these indicato rs do not solve the prob lem when comparing journals from different fields of science. Different scientific f iel ds have different citati on practices. Citation-based bibliometric indicato rs need to be norm alized for such differences betw een fields, in order to allow for meaningful between-fie ld comparisons of cita tion impact. This problem of field- specific difference s in citation impact ind icators com es from institutional research evaluation (Leydesdorff & Bornmann, 2011; Van Raan et al., 2010). Institutes are populated b y scholars with different disciplinary backgrounds and research institutes often have among their missions the objective of integrating interdis ciplinary bodies of know ledge (Leydesdorff & Rafols, 2011; Wagner et al., 2011). There are statistical patterns which are field-sp ecific and allow for the norm alization of the JIF. Garfield (1979) proposes the term ‘citatio n potential’ for systematic differences among 3 fields of science based on the average number of references. For example, in the biom edical fields long reference lists with more than fifty items are common, but in m athematics short lists with fewer than twenty referen ces are the standard (Do rta-González & Dorta-González, 2013). These differences are a consequence of the citation cultures, and can lead to significant differences in the JIF across fields of science because the prob ability of being cited is affected. In this sense, this is the factor that has most f r equently been used in th e literature to justify the differences between fields of science, as we ll as the m ost employed in source-normaliz ation (Leydesdorff & Bornm ann, 2011; Moed, 2010; Zitt & Small, 2008). However, the variables that to a greater degree explain the v ariance in th e im pact factor do not include the average number of references (Dorta-González & Dorta-González, 2013) and therefore it is necessary to c onsider some other sources of variance in the norm alization process such as the ratio of references to jour nals included in the JCR, the field growth, the ratio of JCR references to th e target window and the proportion of cited to citing items. Given these large differences in citation practices, the developm ent of bibliometric indicators that allow for meaningful between-field comparisons is clearly a critical issue (Waltm an & Van Eck, 2013). Traditionally, normalization for field differences has usually been done based on a field classification system. In this appro ach, each publication belongs to one or m ore fields and the citation impact of a pub lication is calculated relative to the other publicati ons in the sam e field. Most eff orts to classify jo urnals in terms of fields of science have focused on correlations between citation pa tterns in core groups assume d to represent scientific specialties (Leydesdorff, 2006; Rosvall & Bergstrom, 2008). Indexes such as the JCR subject category list accommodate a m ultitude of perspectives by listing journals under different groups (Pudovkin & Garfield, 2002; Rafols & Leydesdorff, 2009). In this sense, Egghe & Rousseau (2002) propose the aggregate impact factor in a sim ilar way as the JIF, taking all journals in a category as a meta-journal. Ho we ver, the position of individual journals of merging specialties rem ains difficult to dete rm ine with precision and some journals are assigned to more than one category. Moreover, the delineation between fields of science and next-lower level specialties ha s until now remained an unsolved prob lem in bibliometrics because these delineations are fuzzy at each moment of time and develop dynam ically over time. Therefore, classifying a dynamic system in terms of fixed categorie s can be expected to lead to error because the classi fication system is then defined historically while the dynam ics of science is evolutiona ry (Leydesdorff, 2012, p.359). 4 Recently, the idea of source normalization wa s introdu ced, which offers an alternative approach in normalizing field di fferences. In this approach, normalization is done by looking at the referencing behaviour of citing journa ls. Journal performance is a com plex multi- dimensional concept difficult to be fully capture d in one single metric (Moed et al., 2012, p. 368). This resulted in the cr eation of many other quality me tric indices such as the fractionally counted impact factor (Leydesdorff & Bornmann, 2011), audience factor (Zitt & Small, 2008), source normalized impact per paper (Moed, 2010), scimago journal ranking (González-Pereira et al., 2009) and central area index (Dorta-González & Dorta-González, 2010, 2011) to name a few. All these metrics ha ve their merits, but none include any great degree of normalization in relation to the citation m aturity time. Impact indicators have varying publication and citation periods and the chosen length of these periods enables a distinction between synchr onous and diachronous impact indicators. To collect data for calculations of diachronous jour nal impact factors several volumes of the JCR are needed (Frandsen & Rousseau, 2005). The term di achronous refers to th e fact that the data used to calculate is derive from a number of different years with a st arting point somewhere in the past and encompassing subsequent years. Howe ver, these indicators are not going into the subject of relative impact or norma lizations (Frandsen & Rousseau, 2005). Although journal impact factors ca n be considered historically as the f irst way of trying to normalize citation distributions by using aver ages over 2 years (Leydesdorff, 2009), it has been recognized that citation distributions vary among fields of science and that th is needs to be normalized. This is the m otivation in consid ering the two years of maximu m ci tat io ns a nd variable time windows in provi ding an alternative to the cu rrent journal impact factor. In this paper, we provide a source normali zation approach based on variable cita tion time windows and we empirically compare this with the traditional normalization approach based on a fixed target window. We propose the 2-year maximum journal impact factor ( 2M-JIF ), a new impact indicator that cons iders the 2-year target window of m aximum impact instead of the previous 2-year target window. This new indicator is intuitiv ely simple, allows for statistical testing, and accords with the state of the art. In order to compare this new impact indicator with the 2-year and 5- year time window impact factors, an empirical ap plication with about si x hundred journals bel onging to eight different subject categories is presented. As the main c onclusion, we obtain that our indicator reduces the between-group variance in relati on to the within-group variance. 5 The organization of this paper is as follows . ‘‘The fixed citation tim e window’’ discusses the issue of the selection of the journals optim al citation time window. ‘‘The variable citation time window’’ introduces the new bi bliometric indicator that we are studying. ‘‘Results and discussion’’ presents the results of our empirical analysis. Finally, ‘‘Conclusions’’ summarizes our conclusions. 2. The fixed citation time window A journal impact indicator is a measure of the number of tim e s papers published in a census period cite papers published dur ing an earlier target window. 2.1 The 2-year and 5-year citation time windows The 2-JIF reported by Thomson Reuters considers a one year census pe riod and uses the previous two years as the targ et window. As an average, the 2-JIF is based on two elem ents: the numerator, which is the number of citations in the current ye ar to any items published in a journal in the previous two year s, and the denominator, which is the number of ‘citable items’ (articles, proceedings papers, reviews, and letters) published in those same two years (Garfield, 1972). Journal items include ‘citable item s’, but also editor ials, news, corrections, retractions, and other items. Similarly, the 5-JIF considers a one year census period and uses the previous five year s as the target window. Let i t NArt be the number of ‘ citable items’ in year t of journal i . Let , i tt j NCit be the number of times in year t that the year t-j volumes of journal i are cited by journals in the JCR. Then, the n-year impact factor in year t of journal i is defined as: 11 nn ii i tt , t j t j jj n-JIF NCit NArt , and in the specific cases of two and five years, 12 12 ii i t , t t , t t ii tt NCit NCit 2-JIF NArt NArt and 55 11 ii i t t , tj tj jj 5-JIF NCit NArt . 6 Nevertheless, a common source of variance in the n -year impact factor is th e citation potential, a measure of the citation c haracteristic s of the field where the journal is position ed, determined by how often and how rapidly authors cite other works, and how well their field is covered by the database. The ‘citation potential’ can be conceived as a measure of the field’s topicality (Moed et al., 2012). Fields with a high topicality tend to attract many authors who share an intellectual interest, an d in this sense can be qualifie d as ‘popular’. Developments in these fields move quickly. Papers are written in a limited number of highly visible journals, and authors tend to cite, apart from the common intellectual base, the most recent papers of their colleagues. These popular fields will tend to have a higher 2-JIF (Moed et al., 2012). In this paper we will refer to journals in th ese popular fields as journals with rapid impact maturity time . Therefore, there is not an optimal fixed n -value valid for all the journals and fields. In some cases two years provide a good measure of performa nce but in others thr ee or m ore years is necessary. 2.2 The 3-year citation time window The impact indicator reported by Elsevier SciVerse Scopus considers a one year census period and uses the previous thr ee years as the target window. Th e numerator is the number of citations in the current year to any items publishe d in a journal in the previous three years, and the denominator is the number of ‘refereed item s’ (articles, proceedings papers, and reviews ) published in the same three years. However, this intermediate cita tion tim e window is not a soluti on because in th e intention to be valid for all journals and fields it is really not a good measure both for fields with slow and rapid citation m aturity times. 2.3 The complete citation time wind ow In addition to the static variance (in each year ly JCR) the dyn amic variance can be reduced by using total citations (i .e., the complete cita tion window) instead of the window of the last n years. However, this model does not improve on the model using the previous 2-year time window (Leydesdorff & Bornmann, 2011, p.228). Ther efore, a focus on the last two years (following Garfield’s (1972) suggestion to m easure the ‘research fr ont’) works better than including the com plete historical record, i.e., ‘total cites’. 7 3. The variable citation time window As we have introduced in the pr evious section, a journal impact indicator is a measure of the number of times that papers published in a ce nsus period cite pape rs published during an earlier target window. However, relevant ci tation windows can vary both among fields and over time. Therefore, although fixed citation time windows have been considered in the literature for decades, there is no evidence in jus tifying its suitability in relation to a variable time window. The delimitation among fields of science and th e next-lower level specialties has until now remained an unsolved problem in bibliometrics because these delin eations are fuzzy at each moment in time and develop dynam ically over ti me. For this reason, it is not recomm ended selecting the target window in rela tion to the su bject category in which th e journal is included. Researchers in the fields where impact matu res rapidly have an immediate ‘consumption’ (diffusion and use) of the scientific produc tion (e.g., Biomedicine and Computer Science). Conversely, in fields where impact matures slow ly researchers have a slow ‘consumption’ of the scientific production (e.g., Mathematics and Economics). There is not an optimal fixed im pact maturity tim e valid for all journals. The choice fo r a variable rather than a fixed ( 2, 3, or 5 years) citation time wi ndow is based on the observation that in many fields citations h a ve not yet peaked after 2 years, and in other fi elds citations have peaked long before 5 years. Therefore, the application of a 2-year variable window is the optimal compromise for f ields in which imp act m atures slowly in reaching its m aximum citations while not penalising fields in which impact matures rapidly. Figure 1 shows the citations distribution of four journals with different performance. Journals A and C belong to a field in which impact matures rapidly, while journals B and D belong to a field in which impact m atures slowly. The citatio ns are the n umerators in the impact form ula, therefore if these journals have the same size, that is they have published the sam e number of papers in the last years, then A has greater impact than C , and B has greater impact than D . Nevertheless, which jour nal has greater impact, A or B ? And, which journal has greater impact, C or D ? [Figure 1 about here] In this work, we propose the 2-year maximum journal impact factor ( 2M-JIF ), a new impact indicator that considers the 2-year citation ti me window of maximum impact instead of the 8 previous two years. The idea is to consider, fo r each journal, the citation time window with the highest average number of citations (i.e., th e most advantageous perio d for each journal). We define the rolling impact factors in year t of journal i as : 1 1 1 ii t, t j t, t j i jt ii tj tj NCit NCit R -JIF , j , .. ., h , NArt NArt and the 2-year maximum journal impact factor in year t of journal i as following: 1 11 1 ii t, t j t, t j ii t j ,, h j t j ,, h ii tj tj NCit NCit 2M-JIF max R -JIF max . NArt NArt We define the impact maturity time in year t of a journal i as the number of years from t to that in which the maximum im pact is achieved, that is, if ii tj t 2M-JIF R -JIF then j+1 is the impact maturity tim e in year t of journal i . Note that 1 ii tt R -JIF 2-JIF and, therefore, if 1 ii tt 2M-JIF R -JIF then two is the impact maturity time in yea r t of journal i . In the particular case of a jour nal publishing the sam e number of articles per year, that is ii i tt h NArt NArt NArt 11 , then 11 1 2 ii i t j ,, h t , tj t , tj i 2M-JI F max NCit NCit . NArt Consider the example in Figure 2 with a journal A f rom a field in w hich impact matures rapidly and a journal B from a f ield in which impact m atures slowly. If these journals have th e same size NArt=NArt A =NArt B , then: AA A AA t, t t, t t1 t t NCit NCit 2M-JIF R -JIF 2-JIF , 2NArt 12 BB BB B t, t t, t t5 t t NCit NCit 2M-JIF R -JIF 2-JIF . 2NArt 56 In this example, considering a 2-year fi xed citation time window penalizes journal B in its assessment with A , and it seem s better to consider th e 2-year maximum citation time window. [Figure 2 about here] In order to compare 2-JIF and 2M-JIF , consider the citation distribution of journal B in Figure 3. Note that: 9 ac bd a b cd cd 2M-JIF 2-JIF . 2NArt 2NArt 2NArt 2NArt Then, cd 2NArt is the observed but not measured impact by the 2-JIF . [Figure 3 about here] Finally, the merit and quality of an indicator depends on its statistical properties, validity, and reliability. In this context, the validity is relate d to the capac ity of measuring the im pact of the journal at the res earch front, and the reliability is related to the ability of measuring the im pact with minimum errors. In this sense, the statis tical properties of this new indicator are checked in the following em pirical application. 4. Methods and Materials The underlying bibliometric data in the empirical application was obtained from the online version of the 2011 Journal Citation Reports (JCR) Science edition du ring the first week of november 2012. The JCR database (reported by Thomson Reuters – ISI, Philadelphia, USA) is available at the website www.webofknowledge.c om. In the JCR, journals are assigned by Thomson Reuters’ experts into one or m ore journal categories according to cited and citing relationships with the journals in the categor ies. The journal categories, also referred as subject category list, are treated as fields and subfields of science. In the comparative analysis among 2-JIF , 5-JIF , and 2M-JIF , one journal category from each of the eight clusters obtained by Dorta-González & Dorta- González (20 13) were considered. This was done in order to ob tain journals with systematic differences in publication and citation behaviour. A total of 618 jo urnals were considered in th is empirical application. The categories and the number of journals ar e as follows: Astronomy & Astrophysics (56); Biology (85); Ecology (134); Engineering, Aero space (27); History & Philosophy of Science (56); Mathematics, Inter disciplinary Applicati ons (92); Medicine, Research & Experim ental (112); and Multidisciplinary Sciences (56). 5. Results and discussion In the empirical application we study which citation tim e window in the impact indicator produces a closer data distribut ion among scientific fields in relation to its centrality and variability measures. 10 5.1 A sample of 24 journals in eight JCR categories Table 1 shows a sample of 24 randomly selected journals from those w ith the greatest overall impact (total cita tions) in eight JCR categories from the differe nt clusters identified by Dorta- González & Dorta-González (2013). This was done in order to obtain journals with systematic differences in publication and ci tation behaviour. This table c ontains the citations in year 2011 of items in the period 2006-2010 and the number of ‘citable items’ in the same period. Notice the important differences in publications and citations among journals and fields. This variance in the data is very relevant in the im pact factors. In particular, in the number of publications, note an ex ponential in crease in PLOS ONE , and a linear decrease in ANN NY ACAD SCI and LIFE SCI . [Table 1 about here] For the journals considered, Tabl e 2 shows some journal impact f actors with different citation time windows. Citation maturity tim e varies fr om one category to another (between two and five years). Notice the ampleness in the in terval of variation for each indicator. The R 1 varies from 0.667 to 15.748, while 2M-JIF varies from 0.818 to 18.335, for exam ple. The general pattern is an increm ent in the 2M-JIF . However, this increment is in per centage terms m uch higher in the smaller v alues. For example, note the case J GUID CONTROL DYNAM where 2M-JIF is about 45% higher than R 1 . By contrast, notice the cases P NATL ACAD SCI USA and TRENDS ECOL EVOL in which 2M-JIF i s j u s t 1 5 % h ig h e r t h a n R 1 . This effect produces a concentration of data in the case of 2M-JIF, and consequently a reduction in the variance. [Table 2 about here] 5.2 A sample of 618 journals in eight JCR categories Table 3 provides the Pearson rank correlations for all pairs of indicators, both for journal categories and aggregate data. The general pattern that can be observed based on the correlations reported in th is table, is that the five imp act indicators are all quite strongly correlated, with most of the Pe arson correlations a bove 0.90. The correlations of the four rolling indicators with the maximum indicator are so mewhat higher, both within each category and the aggregate data, but the difference is not large. Moreover, the 2M-JIF can explain more than 90% of the va riance in the rolling indicato rs, r 2 =0.95 2 =0.90. However, one 11 should be careful when drawing conclusions from the correlations reported in this table. The different indicators all have sk ewed distribu tions, with many journa ls with relatively low indicator values and only a small number of journals with high i ndicator values. These skewed distributions fairly eas ily give rise to high Pearson correlations. [Table 3 about here] The number of journals in which the rolling imp act factor is the m axi mum value is showed in Table 4. Note there is not a valid o ptimal im pact maturity time fo r all fields. In some cases two years provide a good measure of performan ce but in others three or more years is necessary. Note that impact ma tures rapidly (two years) in Astronomy & Astrophysics , followed by Medicine, Research & Experimental (three years). Impact m atures slowly in Ecology and Mathematics, Interdisciplinar y Applications (five years). The rem aining fields are in intermediate situations, from four to five years. [Table 4 about here] Central-tendency and variability measures for the eight JCR categories analysed are showed in Table 5. All the indicators have skewed di stributions, with many journals w ith relatively low indicator values and only a small number of journals with high indicator values. This is the reason why in these skewed distributions me dians are well below means in all cases. Note high differences between categories in medi ans, means, and standard d eviations. The general pattern is an increment in the 2 M-JIF with respect to the rolling indicators. However, this increm ent is in percentage terms m uch higher in the smaller values. For example, in History & P hilosophy of Science the median in 2M-JIF is around a 60% higher than R 1 (50% in the ca se of the mean). By co ntrast, in Medicine, Research & Experimental the median in 2M-J IF is around 15% higher than R 1 (25% in the case of th e mean). This effect produces a concentration of data and consequently a reduction in the variance when considering the 2M-JIF . As a specific case, note the mean is over f our times the median in Multidisciplinary Sciences . This is also observed in the very large standard deviation. [Table 5 about here] Finally, we will test if the maximum cita tion time window reduces the between-group variance in relation to the within-group variance. Table 6 shows the central-tendency measures for the aggregate data. It also s hows the between-group variances. Note that all target windows reduce the between-group varian ce. However, the maximum citation time window produces the greatest reduction (3.203 ). Thus, this normalization by means of 12 variable target windows reduces the between-group va riance over 80%, when compared to within-group varian ce. [Table 6 about here] 6. Conclusions Different scientific f ields have different c itation practices. Citation - based bibliometric indicators need to be normalized for such diff erences between fields in order to allow for meaningful between-f ield comparison s of citatio n impact. In this paper, we provide a source normalization approach, based on a variable target window and we compare it with a traditional norm alization approach based on a fixed target window. An empirical application, with about six hundred journals from eight di fferent fields, shows that our maximum citation time window reduces the between-group varian ce in relatio n to the within-group varian ce more than the rest of the indicators analyzed. The journal categories considered are in very dif ferent areas in relation to the im pact maturity time. Some of them are penalized by the 2-JIF and favored by the 5-JIF , and vice versa. This is the main reason why it is n ecessary to be cau tious when comparing journal im pact factors from different fields. In this sense, o ur inde x has behaved well in a gr eat number of journals from very different fields. Finally, we have not empirical evidences about the optimality in using a time window of two years instead of some other valu e. We think th at perhaps this aspect could be an interesting issue for a future work. 13 References Althouse, B. M., West, J. D., Bergstrom, C. T ., & Bergstrom , T. (2009). Differences in impact factor across fields and over time. Journal of the American Society for Information Science and Technology, 60 (1), 27–34. Bensman, S. J. (2007). Garfield and the impact factor. Annual Review of Information Science and Technology, 41 (1), 93–155. Bergstrom, C. (2007). Eigenfact or: Measuring the value and pr estige of scholarly journals. College and Research Libraries News, 68 (5), 314. Bornmann, L., & Daniel, H. D. (2008). What do c itation counts measure? A review of studies on citing behavior. Journal of Documentation, 64 (1), 45–80. Dorta-González, P., & Dorta-G onzález, M. I. (2010). Indicador bibliométrico basado en el índice h. Revista Española de Documentación Científica , 33 (2), 225–245. Dorta-González, P., & Dorta-González, M. I. (2011). Central indexes to the citation distribution: A compleme nt to the h-index. Scientometrics , 88 (3), 729–745. Dorta-González, P., & Dorta-Go nzález, M. I. (2013). Compari ng journals from different fields of science and social science through a JCR subject categories normalized impact factor. Scientometrics (in press). DOI: 10.1007/s11192-012-0929-9 Egghe, L., & Rousseau, R. (2002). A general framework for relative impact indicators. Canadian Journal of Informa tion and Library Science , 27 (1), 29–48. Frandsen, T. F., & Rousseau, R. (2005). Artic le impact calculated over arbitrary periods. Journal of the American Society for Information Science and Technology , 56(1), 58–62. Garfield, E. (1972). Citation analysis as a tool in journal evaluation. Science, 178 (4060), 471– 479. Garfield, E. (1979). Is citation analysis a legi timate evaluation tool? Scientometrics, 1 (4), 359–375. González-Pereira, B., Guerrero -Bote, V. P., & Moya-Anegón, F. (2009). The SJR indicator: A new indicator of journals ’ scientific prestige. Journal of Informetrics, 4 (3), 379–391. Leydesdorff, L. (2006). Can scientif ic journals be classified in terms of aggregated journal- journal citation rela tions using the Jour nal Citation Reports? Journal of the American Society for Information Science & Technology, 57 (5), 601–613. Leydesdorff, L. (2009). How are new citation- based journal indicators adding to the bibliometric toolbox? Journal of the American Socie ty for Information Science and Technology , 60(7), 1327–1336. 14 Leydesdorff, L. (2012). Alternativ es to the journal impact fact or: I3 and the top-10% (or top- 25%?) of the most-highly cited papers. Scientometrics , 92 (2), 355–365. Leydesdorff, L., & Bornmann (2011). How fractiona l counting of citations affects the Impact Factor: Normalization in terms of differen ces in citation potenti als among fields of science. Journal of the American Society for Information Science & Technology, 62 (2), 217–229. Leydesdorff, L., & Rafols, I. (2011). Indicators of the interdiscip linarity of journals: Diversity, centrality, and citations. Journal of Informetrics , 5 (1), 87–100. Moed, H. F. (2010). Measuring contextual citation impact of scientific journals. Journal of Informetrics, 4 (3), 265–277. Moed, H. F., Colledge, L., Reedijk, J., Moya-A negon, F., Guerrero-Bote, V., Plume, A., Amin, M. (2012). Citation-based metrics are appropriate tools in journal assessment provided that they are accurate an d used in an informed way. Scientometrics , 92 (2), 367–376. Pudovkin, A. I., & Garfield, E. (2002). Algorithmic procedure fo r finding semantically related journals. Journal of the American Society for Information Science and Technology, 53 (13), 1113–1119. Rafols, I., & Leydesdorff, L. (2009). Content- based and algorithmic classifications of journals: Perspectives on the dynamics of sc ientific communication and indexer effects. Journal of the American Society for Information Science and Technology, 60 (9), 1823– 1835. Rosvall, M., & Bergstrom, C. T. (2008). Maps of random walks on complex networks reveal community structure. Proceedings of the National Academy o f Sciences, 105 (4), 1118– 1123. Rousseau, R. (2009). What does the Web of Sc ience five-year synchronous impact factor have to offer? Chinese Journal of Library and Information Science , 2(3), 1–7 Van Raan, A. F. J., Van Leeuwen, T. N., Vis s er, M. S., Van Eck, N. J., & Waltman, L. (2010). Rivals for the crown: Re ply to Opthof and Leydesdorff. Journal of Informetrics, 4 (3), 431–435. Wagner, C., Roessner, J. D., Bobb, K., Klein, J. , Boyack, K., Keyton, J, Rafols, I., Börner, K. (2011). Approaches to understa nding and measuring interdisci plinary scientific research (IDR): A review of the literature. Journal of Informetrics , 5 (1), 14–26. 15 Waltman, L., & Van Eck, N. J. (2013). Source normalized indica tors of citation impact: a n overview of different approaches and an empirical comparison. Scientometrics (in press). DOI 10.1007/ s11192-012-0913-4 Zitt, M., & Small, H. (2008). Modifying the j ournal im pact factor by fractional citation weighting: The audience factor. Journal of the American Society for Info rmation Science and Technology, 59 (11), 1856–1860. 16 t − 1t − 2t − 3t − 4t − 5t − 6t − 7t − 8 Citations in year t time window J A J C J D J B 2-JIF 2M-JIF for journals B and D 5-JIF t Field in which impact matures slowly Field in which impact matures rapidly Figure 1: Citations distribution a nd impact measures of journals from fields in which im pact matures rapidly ( A with greater impact than C ) and slowly ( B with greater im pact than D ) 17 J A J B t − 1t − 2t − 3t − 4t − 5t − 6t − 7t − 8 Citations in year t time w indow 2M-JIF A 2M-JIF B t 2-JIF A > 2-JIF B 2M-JIF A < 2M-JIF B R 1 R 2 R 3 R 4 R 5 R 6 R 7 Figure 2: Two journals with di fferent im pact maturity time. 18 a b c d a b t − 1t − 2t − 3t − 4t − 5t − 6t − 7t − 8 Citations in year t time w indow 2-JIF 2M-JIF t 2M-JIF = 2-JIF + (c+ d)/ 2NAr t R 1 R 5 Figure 3: Comparing 2-JIF and 2M-JIF in a journal publishing NArt papers per year. 19 Table 1: A sample of 24 randomly selected jour nals from those with greatest overall im pact (total citations) in eight very differe nt JCR categories Abbreviated journal title Category NCit i 2011,t NArt i t 2010 2009 2008 2007 2006 2010 2009 2008 2007 2006 AIAA J EA 239 354 4 74 4 18 4 67 275 286 301 311 3 56 AM NAT E 663 1052 1 028 1159 1003 171 1 92 190 197 179 ANN NY ACAD SCI MS 2505 3382 3827 2947 3193 702 1164 975 1034 1415 ASTRON ASTR OPHYS A& A 8657 8330 6992 7174 6270 1916 1787 1789 1977 1935 ASTROPHY S J A&A 1464 1 17267 12160 11738 1 0412 2501 2796 2128 2 848 2707 BIOL PHILOS H&PS 66 29 39 59 49 39 40 36 35 28 BIOMETRIKA B 103 203 222 246 225 79 81 75 74 79 BRIT J PHILOS SCI H&PS 27 41 59 38 45 31 31 32 32 28 ECOLOGY E 1292 2073 2317 2227 2 237 357 337 345 317 3 33 ECONOMETRICA MIA 136 239 228 326 373 65 61 47 51 53 EXP HEMATOL MR&E 308 485 6 27 6 44 5 70 127 146 172 214 1 94 FASEB J B 2348 2633 2 845 2655 3200 462 4 10 412 388 486 HIST SCI H&PS 9 15 12 12 10 17 19 14 17 16 IEEE T AERO ELEC SYS EA 124 163 216 2 70 302 136 126 128 133 117 J ECONOMETRICS MIA 156 165 435 541 448 139 99 161 17 6 124 J GUID CONTROL DYNAM EA 151 213 261 268 208 187 200 183 203 1 77 LIFE SCI MR&E 538 675 883 1 364 1919 228 252 289 4 98 702 P NATL ACAD SCI USA MS 31558 41331 3964 2 38547 35707 3764 3 765 3508 3494 3306 P ROY SOC A-MATH PHY MS 3 97 346 323 453 359 183 194 175 1 97 196 PHYS REV D A&A 13330 12498 1150 8 8183 7528 2854 2813 2863 2268 2375 PLOS ONE B 22741 22780 15676 7041 765 6722 4403 2717 1 230 137 STRUCT EQU MODELING MIA 99 193 98 308 374 31 31 30 29 28 TRENDS ECOL EVOL E 965 147 6 1527 1468 1594 75 80 92 89 78 VACCINE MR&E 3729 4702 3787 3 536 3182 1105 1134 905 1046 928 JCR categories: A&A Astronomy & Astrophysics; B Biology; E Ecology; EA Engineering, Aerospace; H&PS History & Philosophy of Science; MIA Math ematics, Interdiscipli nary Applications; MR&E Medicine, Research & Experimental; MS Multidisciplinary Sciences. 20 Table 2: Journal impact fact ors with different citation tim e windows for journals with different impact m aturity times Abbreviated journal title Category R 1 = 2-JIF R 2 R 3 R 4 2M- JIF 5-JIF Impact maturity time AIAA J EA 1.057 1.411 1. 458 1.327 1. 458 1.277 4 AM NAT E 4.725 5.44 5 5.651 5.750 5. 750 5.280 5 ANN NY ACAD SCI MS 3.155 3.370 3.372 2.50 7 3.372 2.997 4 ASTRON ASTR OPHYS A&A 4.587 4.285 3. 762 3.437 4. 587 3.979 2 ASTROPHY S J A&A 6.024 5.976 4. 803 3.987 6. 024 5.102 2 BIOL PHILOS H&PS 1.203 0. 895 1.38 0 1.714 1.714 1.360 5 BIOMETRIKA B 1.913 2. 724 3.14 1 3.078 3.141 2.575 4 BRIT J PHILOS SCI H&PS 1.097 1.58 7 1.516 1.383 1. 587 1.364 3 ECOLOGY E 4.849 6. 437 6.86 4 6.868 6.868 6.007 5 ECONOMETRICA MIA 2.976 4.324 5.653 6.721 6.721 4.700 5 EXP HEMATOL MR&E 2.905 3.497 3.293 2.97 5 3.497 3.088 3 FASEB J B 5.712 6.66 4 6.875 6.699 6.87 5 6.340 4 HIST SCI H&PS 0. 667 0.818 0.774 0.66 7 0.818 0.699 3 IEEE T AERO ELEC SYS EA 1.095 1. 492 1.86 2 2.288 2.288 1.680 5 J ECONOMETRICS MIA 1.349 2.308 2. 896 3.29 7 3.297 2.496 5 J GUID CONTROL DYNAM EA 0.941 1.238 1. 370 1.25 3 1.370 1.159 4 LIFE SCI MR&E 2.527 2.880 2.855 2. 736 2.88 0 2.732 3 P NATL ACAD SCI USA MS 9.681 11.133 11.167 10.920 11.167 10.472 4 P ROY SOC A-MATH PHY MS 1.971 1.813 2.086 2.06 6 2.086 1.987 4 PHYS REV D A&A 4.55 8 4.229 3.838 3.384 4.558 4.027 2 PLOS ONE B 4.092 5.401 5.756 5.71 0 5.756 4.537 4 STRUCT EQU MODELING MIA 4.710 4.770 6.881 11.965 11.965 7.195 5 TRENDS ECOL EVOL E 15.748 17.459 16.547 1 8 .335 18.335 16.981 5 VACCINE MR&E 3.766 4. 163 3.75 3 3.403 4.163 3.700 3 JCR categories: A&A Astronomy & Astrophysics; B Biology; E Ecology; EA Engineering, Aerospace; H&PS History & Philosophy of Science; MIA Math ematics, Interdiscipli nary Applications; MR&E Medicine, Research & Experimental; MS Multidisciplinary Sciences. 21 Table 3: Pearson rank correlations for all pairs of indicators Category # Journals R 2 R 3 R 4 2M-JIF Astronomy & Astrophysics 56 R 1 0.96 0.93 0.92 0.95 R 2 0.94 0.91 0.96 R 3 0.88 0.98 R 4 0.89 Biology 85 R 1 0.977 0.93 0.94 0.97 R 2 0.98 0.96 0.99 R 3 0.98 0.98 R 4 0.97 Ecology 134 R 1 0.99 0.98 0.97 0.99 R 2 0.98 0.95 0.98 R 3 0.97 0.98 R 4 0.97 Engineering, Aerospace 27 R 1 0.95 0.83 0.83 0.92 R 2 0.91 0.90 0.95 R 3 0.98 0.95 R 4 0.95 History & Philosophy of Science 56 R 1 0.89 0.82 0.85 0.89 R 2 0.93 0.83 0.90 R 3 0.92 0.95 R 4 0.97 Mathematics, Interdisciplinary Applications 92 R 1 0.91 0.81 0.77 0.86 R 2 0.92 0.82 0.90 R 3 0.90 0.94 R 4 0.93 Medicine, Research & Experimental 112 R 1 0.90 0.80 0.76 0.93 R 2 0.94 0.89 0.92 R 3 0.96 0.90 R 4 0.87 Multidisciplinary Sciences 56 R 1 0.96 0.91 0.91 0.96 R 2 0.97 0.94 0.98 R 3 0.94 0.98 R 4 0.95 Total 618 R 1 0.97 0.93 0.91 0.96 R 2 0.97 0.94 0.97 R 3 0.96 0.97 R 4 0.95 R 1 =2-JIF 22 Table 4: Number of journals in w hich the rolling im pact factor is the maximum value Category # Journals R 1 =2-JIF R 2 R 3 R 4 Astronomy & Astrophysics 56 22 39.3% 17 30.4% 11 19.6% 6 10.7% Biology 85 13 15.3% 25 29.4% 28 32.9% 19 22.4% Ecology 134 7 5.2% 31 23.1% 41 30.6% 55 41.0% Engineering, Aerospace 27 4 14.8% 7 25.9% 8 29.6% 8 29.6% History & Philosophy of Science 56 12 21.4% 16 28.6% 12 21.4% 16 28.6% Mathematics, Interdisci plinary Applications 92 10 10.9% 22 23.9% 22 23.9% 38 41.3% Medicine, Research & Experimental 112 22 19.6% 46 41.1% 22 19.6% 22 19.6% Multidisciplinary Sciences 56 13 23.2% 14 25.0% 18 32.1% 11 19.6% Total 618 103 16.7% 178 28.8% 162 26.2% 175 28.3% 23 Table 5: Central-tendency and variability measures for the eight JCR categories Category Measures R 1 =2-JIF R 2 R 3 R 4 2M-JIF 5-JIF Astronomy & Astrophysics Median 1.683 1.874 1.679 1.600 1.982 1.757 Mean 3.070 3.407 3.551 2.868 3.947 3.180 Sd 4.292 5.563 5.597 4.931 5.927 4.803 Biology Median 1.540 1.505 1.553 1.624 1.851 1.719 Mean 2.097 2.341 2.346 2.500 2.663 2.374 Sd 2.115 2.293 2.488 2.897 2.843 2.390 Ecology Median 1.829 2.343 2.421 2.425 2.586 2.250 Mean 2.643 3.168 3.292 3.530 3.651 3.122 Sd 2.681 3.056 2.858 3.444 3.480 2.871 Engineering, Aerospace Median 0.549 0.623 0.737 0.672 0.764 0.654 Mean 0.680 0.799 0.869 0.885 0.975 0.833 Sd 0.605 0.762 0.787 0.880 0.848 0.727 History & Philosophy of Science Median 0.442 0.446 0.500 0.588 0.705 0.553 Mean 0.580 0.659 0.682 0.735 0.855 0.725 Sd 0.603 0.694 0.642 0.672 0.702 0.632 Mathematics, Interdisciplinary Applications Median 0.893 1.079 1.230 1.132 1.376 1.131 Mean 1.108 1.291 1.435 1.593 1.730 1.394 Sd 0.771 0.884 1.087 1.662 1.545 1.033 Medicine, Research & Experimental Median 2.297 2.376 2.320 2.274 2.675 2.418 Mean 3.033 3.476 3.121 3.291 3.804 3.337 Sd 3.290 3.979 3.943 4.197 4.313 3.635 Multidisciplinary Sciences Median 0.510 0.571 0.828 0.650 0.864 0.789 Mean 2.313 2.461 2.471 2.521 2.705 2.866 Sd 6.419 7.003 6.918 6.823 6.942 7.231 Sd: Standard deviation 24 Table 6: Central-tendency and variabili ty measures for the aggregate data Measures R 1 =2-JIF R 2 R 3 R 4 2M-JIF 5-JIF Median 1.245 1.442 1.431 1.478 1.745 1.531 Mean 2.142 2.453 2.449 2.538 2.827 2.481 Within-group variance ( Sd 2 ) 3.203 3.717 3.670 3.800 3.998 3.505 Between-group variance (Sd 2 ) 0.709 0.790 0.717 0.729 0.795 0.728 Reduction in the variance 2.494 2.927 2.953 3.071 3.203 2.777 Sd: Standard deviation; Within-g roup: within the 618 journals; Between-group: between the JCR categories
Original Paper
Loading high-quality paper...
Comments & Academic Discussion
Loading comments...
Leave a Comment