EMMIX-uskew: An R Package for Fitting Mixtures of Multivariate Skew t-distributions via the EM Algorithm
This paper describes an algorithm for fitting finite mixtures of unrestricted Multivariate Skew t (FM-uMST) distributions. The package EMMIX-uskew implements a closed-form expectation-maximization (EM) algorithm for computing the maximum likelihood (…
Authors: Sharon X. Lee, Geoffrey J. McLachlan
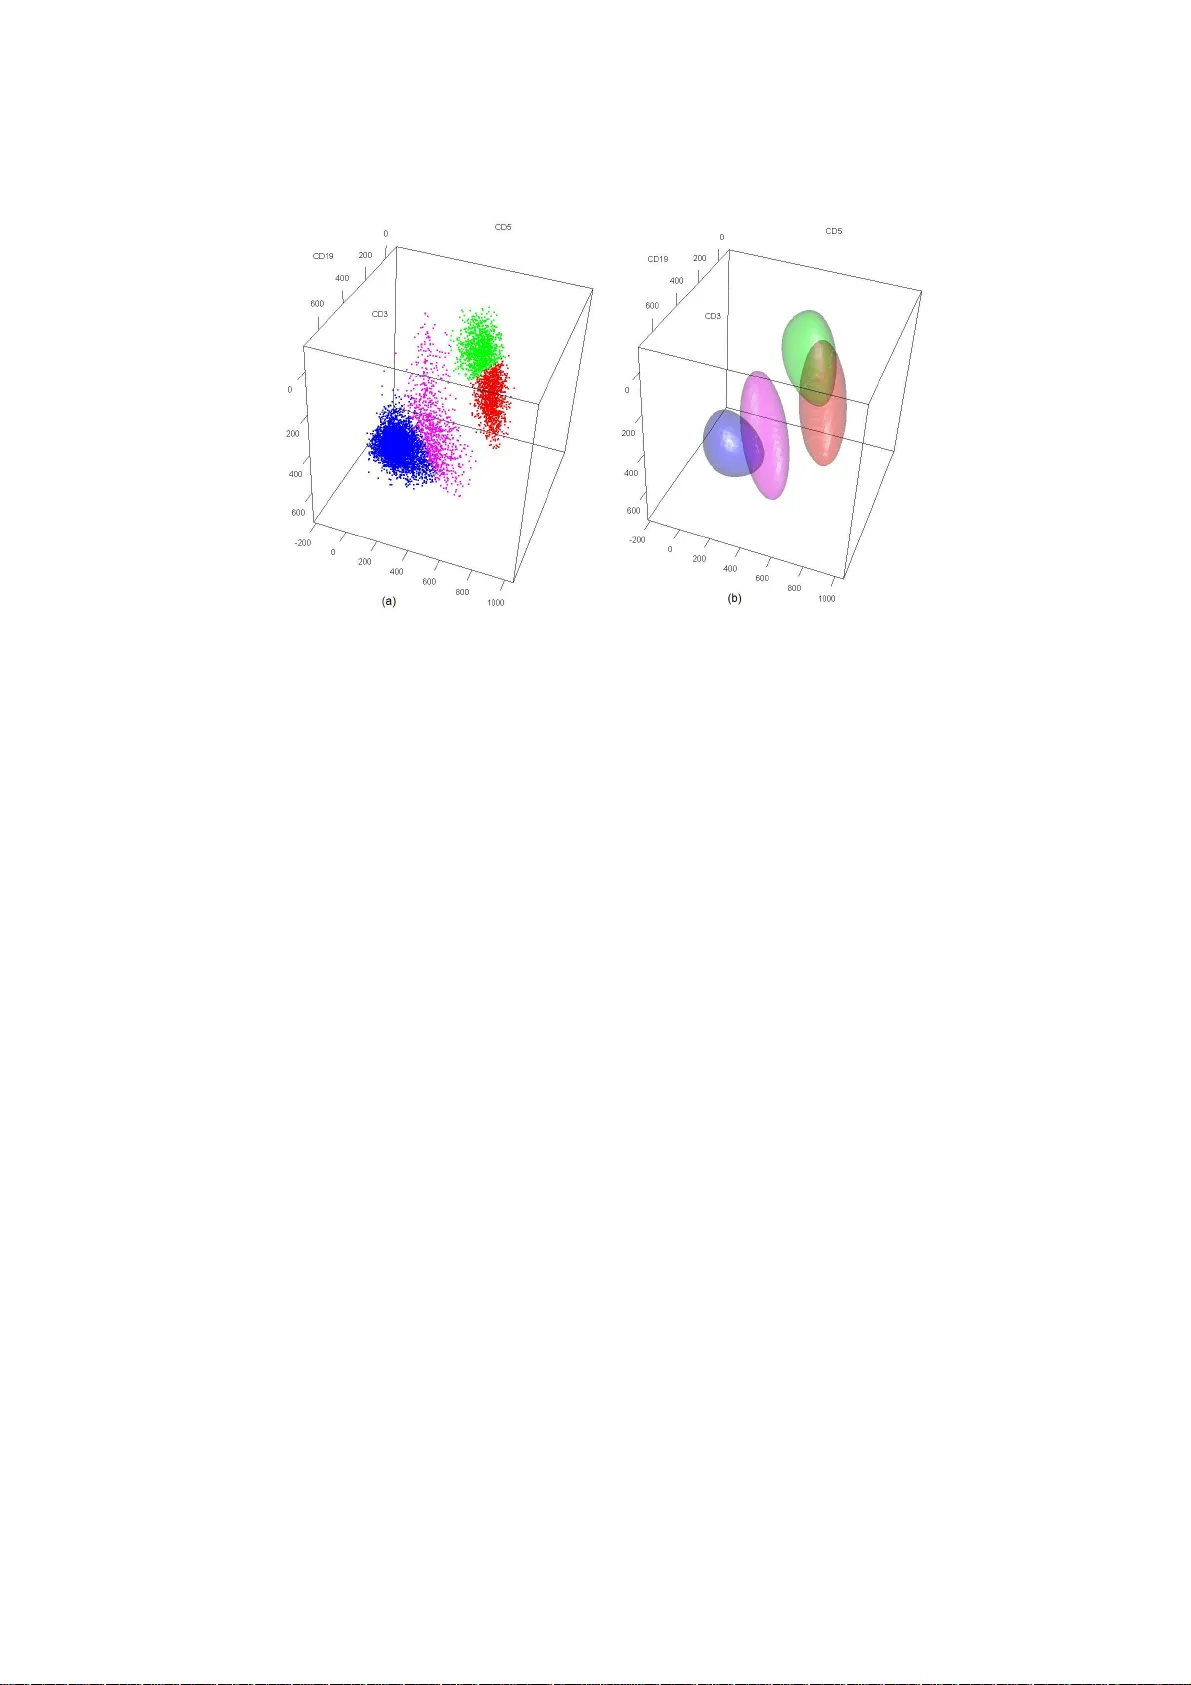
JSS EMMIX-usk ew : An R P ac k age for Fitting Mixtures of Multiv ariate Sk ew t -dist ribution s via the EM Algorith m Sharon X. Lee Unive rsity of Queensland Geoffrey J. McLac hlan Unive rsity of Queensland Abstract This pap er describ es a n a lgorithm for fitting finite mixtures of unr e stricted Multi- v ariate Skew t (FM-uMST) distributions. T he pack age EMMIX-uskew implements a closed-form expectation-ma x imization (EM) algorithm for computing the maxim um lik e- liho o d (ML) estimates of the pa r ameters for the (unres tricted) FM-MST mo del in R . EMMIX-uskew also s upp or ts vis ualization of fitted co ntours in t wo and three dimens io ns, and random sample g e ne r ation from a sp ecified FM-uMST distribution. Finite mixtures of skew t -distributions have pro ven to b e use ful in mo delling heter o- geneous data with asymmetric and heavy tail be haviour, for exa mple, datasets from flow cytometry . In r ecent years, v a rious versions o f mixtures with multiv ariate skew t (MST) distributions hav e b een prop osed. How ever, these mo dels ado pted some res tr icted char- acterizations of the comp onent MST distributions so that the E-step o f the EM algorithm can b e ev aluated in closed form. This pap e r foc us es on mixtures with unrestr icted MST comp onents, and describes an iterative algorithm for the co mputatio n of the ML esti- mates of its mo del parameters. Its implementation in R is present ed with the pac k age EMMIX-uskew . The usefulness of the prop osed alg orithm is demonstrated in three a pplications to real datasets. The first example illustr ates the us e of the main function fmmst in the pack age b y fitting a MST distribution to a biv aria te unimo dal flow cytometric sample. The second example fits a mixture of MST distributions to the Austra lian Institute o f Sp ort (AIS) data, and demonstrates that EMMIX-uskew can provide b etter clustering results than mixtures with r estricted MST components. In the third example, EMMIX-uskew is applied to classify cells in a triv ariate flow cytometr ic dataset. Compar isons with some other av aila ble metho ds suggest that EMMIX-uskew ac hieves a low er misclassifica tion rate with respect to the labels given by b enchmark ga ting analysis. Keywor ds : mixture models, skew distributions, multiv ariate t -distribution, EM algo rithm, flow cytome try , R . 2 EMMIX-usk ew : Fitting Mixtures of Multiv ariate S ke w t -distributions 1. In tro duction In many practical pr oblems, data are often sk ewe d, heterogeneo us, and /or contai n outliers. Finite mixture distributions of skewe d distribu tions hav e become increasingly p opular in mod elling and analyzing su c h data. This u se of fin ite mixture d istributions to m odel het- erogeneous data has undergone intensive d ev elopment in the past decades, as witnessed by the numerous applications in v arious scientific fields su c h as b ioinformatics, clus ter analy- sis, genetics, information processing, med icine, and p attern recognition. F or a compr eh en- sive survey on mixture mod els and their applications see, for example, the monographs by Eve ritt and Hand ( 1981 ), Titterington et al. ( 1985 ), McLac hlan and Basford ( 19 88 ), Lindsa y ( 1995 ), B ¨ ohning ( 20 00 ), McLachlan and Pee l ( 2000 ), and F r ¨ uhwirth-Sc hn atter ( 2006 ), the edited vol ume of Mengersen et al. ( 2011 ), and also the pap ers by Banfield and Raftery ( 19 93 ) and F raley and Raftery ( 1999 ). In recent years, finite mixtures of skew t -distributions hav e b een exploited as an effectiv e tool in mo delling h igh-dimensional multimodal and asymmetric datasets; see, for example, Pyne e t al. ( 2009a ) and F r ¨ uhwirth-Sc hn atter and Pyn e ( 2010 ). F ollo wing the introdu ction of the sk ew normal (SN) distr ib ution by Azzalini ( 1985 ), several authors ha ve studied skew ed extensions of the t -distrib u tion. Finite mixtur e models with multiv ariate sk ew t (MST) com- p onents wa s first prop osed b y Pyne et al. ( 2009 a ) in a stud y of an automated approac h to the analysis of fl o w cytometry d ata. W ang et al. ( 2009 ) h as giv en a pac k age EMMIX- ske w for the implementation in R ( R Developmen t T eam 201 1 ) of their algo rithm. More recen tly , Basso et al. ( 2010 ) studied a class of mixtur e mo dels where the comp onents den- sities are scale mixtur es of univ ariate sk ew normal distributions, known as the skew nor- mal/indep endent (SNI) family of distributions, which include the (un iv ariate) ske w normal and skew t -distributions as sp ecial cases. This work was later extended to the m ultiv ariate case in Cabral et al. ( 2012 ), and was implemen ted in an R p ac k age mixsmsn . How eve r, in these characteriz ations, restrictions w ere imp osed on the comp onent skew t -distributions in order to obtain manageable analytical expressions for th e conditional exp ectations in volv ed in the E-step of th e EM algorithm. These versions of the sk ew t -distributions are kno wn as th e ‘restricted’ form of the MST d istribution; see Lee and McLac hlan ( 2012a ) for fu rther discussion on this. In this p ap er, we present an alg orithm for the fitting of the unrestricted skew t -mixtur e mod el. W e show that an EM algorithm can b e implemented exactly without restricting the characteriza tions of the component MST d istr ibutions. Closed form expr essions can b e obtained for the E-step conditional exp ectations by recognizing that they can b e formulated as moments of a multiv ariate non-central truncated t -v ariate, which can be f urther expressed in terms of central t -distributions. The algorithm is implemented in R in the pack age EMMIX- uskew , a v ailable at http :// www.math s. uq.edu.au/~gjm/mix_soft/EMMIX- skew . The pac k age EMMIX-uskew consists of three main fun ctions: fmmst , rfmmst , and con- tour.fmmst . The main fu n ction fmmst fits a mixtu r e of unrestricted MST (uMST) distributions using an EM algo rithm describ ed in Section 3 . The fu nction rfmmst generates ran d om samples from mixtures of uMST distrib u tions. F or a user friendly visualisation of the fitted mo dels, fmmst.contour p r o vides 2D cont our maps of the fi tted b iv ariate d ensities and 3D displays with inte ractive viewp oint na vigation facilit y for triv ariate densities. The r emainder of this pap er is organized as follo ws. Section 2 p rovides a brief description of the uMST distribution and defin es the FM-uMST model. Section 3 presents an EM algo rithm Sharon Lee & Geoffrey McLac hlan 3 for fitting the FM-uMST mo del. In th e n ext section, an explanation of how to fit, visualize, and interpret th e FM-uMST mo dels using EMMIX-uskew is presented. The usage of EMMIX- uskew is illustrated with three applications and comparisons are made w ith some restricted FM-MST mo d els an d ot her clustering metho ds. Finally , we conclude with a br ief summ ary of our results. 2. Finite mixtures of m ultiv ariate sk ew t -distributions W e b egin by defining the (u nrestricted) multiv ariate ske w t -density . Let Y b e a p -dimensional random vector. Then Y is said to follo w a p -d imensional u n restricted s kew t -distribu tion ( Sahu et al. 2003 ) with p × 1 location vec tor µ , p × p scale matrix Σ , p × 1 skewness vector δ , and (scalar) degrees of freedom ν , if its probability densit y fu n ction (p df ) is given by f p ( y ; µ , Σ , δ , ν ) = 2 p t p,ν ( y ; µ , Ω ) T p,ν + p ( y ∗ ; 0 , Λ ) , (1) where ∆ = diag( δ ) , Ω = Σ + ∆ 2 , y ∗ = q r ν + p ν + d ( y ) , q = ∆Ω − 1 ( y − µ ) , d ( y ) = ( y − µ ) T Ω − 1 ( y − µ ) , Λ = I p − ∆Ω − 1 ∆ . Here the op erator d iag( δ ) denotes a diagonal m atrix with diagonal elements sp ecified by the ve ctor δ . Also, we let t p,ν ( . ; µ , Σ ) b e the p -dimen s ional t -distribution with location vec tor µ , scale matrix Σ , and d egrees of fr eedom ν , and T p,ν ( . ; µ , Σ ) the correspond ing (cumulativ e) distribution function. The notation Y ∼ u MST p,ν ( µ , Σ , δ ) will b e used . Note that when δ = 0 , ( 1 ) r educes to the symmetric t -d ensit y t p,ν ( y ; µ , Σ ). Also, when ν → ∞ , w e obtain the (un restricted) skew normal distribution. V arious versions of the multiv ariate skew t -dens ity ha ve b een prop osed in recen t years. It is wo rth noting that the ve rsions considered by Azzalini and Capitanio ( 200 3 ), Gupta ( 2003 ), and Lac hos et al. ( 2010 ), among others, are different from ( 1 ). T hese versions are simp ler in that the skew t -density is d efined in terms in volving only the univ ariate t -distribution function instead of the multiv ariate form of the latter as used in ( 1 ). These simplified c haracterizations hav e the adv an tage of having closed form expressions for th e co nd itional exp ectations that hav e to b e calculated on the E-step. The reader is r eferred to Lee and McLac hlan ( 2012a , b ) for a discussion on different forms of skew t -distributions. W e shall adopt the unrestricted form ( 1 ) of the MST d istr ibution here as proposed by Sahu et al. ( 2 003 ), and describ e a computationally efficien t E M algorithm for fitting this mo del. A g -comp onent finite m ixture of uMST distributions h as dens it y given by f ( y ; Ψ ) = g X h =1 π h f p ( y ; µ h , Σ h , δ h , ν h ) , (2) 4 EMMIX-usk ew : Fitting Mixtures of Multiv ariate S ke w t -distributions where f p ( y ; µ h , Σ h , δ h , ν h ) denotes the h th uMST component of the mixtur e mo del as de- fined by ( 1 ), with lo cation parameter µ h , scale matrix Σ h , skew parameter δ h , and degrees of freedom ν h . Th e mixing proportions π h satisfy π h ≥ 0 ( h = 1 , . . . , g ) and P g h =1 π h = 1. W e s hall denote the model defined by ( 2 ) by the FM-uMST (fin ite mixture of uMST) dis- tributions. Let Ψ cont ain all th e unknown parameters of the FM-uMST m odel; th at is, Ψ = π 1 , . . . , π g − 1 , θ T 1 , . . . , θ T g T where now θ h consists of the un known parameters of the h th component density fun ction. T he densit y v alues for a uMST and FM-uMST distribution can b e ev aluated usin g the functions dmst and dfmmst in EMMIX-uskew . Random samples of uMST v ariates can b e generated by adopting a stochastic representatio n of ( 1 ) ( Lin 2010 ). If Y ∼ uM S T p,ν ( µ , Σ , δ ), then Y = µ + 1 √ w ∆ | U 1 | + 1 √ w U 0 , (3) where the rand om v ariables U 0 ∼ N p ( 0 , Σ ) , (4) U 1 ∼ N p ( 0 , I p ) , (5) w ∼ gamma ν 2 , ν 2 , (6) are indep endent, and gamma( α, β ) d enotes the gamma distribution with shap e and scale parameters giv en by α and β resp ectiv ely . Samplin g of u MST and FM-uMST v ariates are implemente d in E MMIX-uske w in the rms t and rf mmst functions, resp ectiv ely . 3. The EMMIX-usk ew algorithm F rom ( 3 ) to ( 6 ), the uMST distribu tion admits a con venien t hierarc hical c haracterizatio n that f acilita tes the computation of the m axim um lik elihoo d estimator (MLE) of the u nknown mod el p arameters usin g the EM algorithm, namely , Y | u , w ∼ N p µ + ∆ u , 1 w Σ , U | w ∼ H N p 0 , 1 w I p , W ∼ gamma ν 2 , ν 2 , where ∆ h = diag ( δ h ), H N p ( µ , Σ ) denotes the p -dimensional h alf-normal distrib ution with location parameter µ and s cale m atrix Σ . 3.1. Fitting of FM-uMST mo del via the EM algorithm Let Y 1 , · · · , Y n b e n indep endent observ ations of Y . T o formulate the estimation of the unknown parameters as an incomplete- data pr oblem in the EM framework, we introduce a set of latent comp onent lab els z j = ( z 1 j , . . . , z g j ) ( j = 1 , . . . , n ) in addition to the u nobserv able v ariables u j and w j , where eac h element z hj is a zero-one indicator v ariable with z hj = 1 if y j b elongs to the h th component, and zero otherwise. Thus, P g h =1 z hj = 1 ( j = 1 , . . . , n ). Sharon Lee & Geoffrey McLac hlan 5 It follo ws that the random vector Z j corresp onding to z j follo ws a multinomial d istribution with one trial and cell p r obabilities π 1 , . . . , π g ; that is, Z j ∼ Mult g (1; π 1 , . . . , π g ). The complete-data log likelihood f unction can b e factored in to the marginal d ensities of the z j , the conditional d ensities of the w j giv en z j , and the conditional d ensities of the y j giv en u j , w j , and z j . Accordingly , th e complete-data log like liho od is giv en by log L c ( Ψ ) = lo g L 1 c ( Ψ ) + log L 2 c ( Ψ ) + log L 3 c ( Ψ ) , (7) where L 1 c ( Ψ ) = g X h =1 n X j =1 z hj log ( π h ) , L 2 c ( Ψ ) = g X h =1 n X j =1 z hj h ν h 2 log ν h 2 + ν h 2 + p − 1 log ( w j ) − log Γ ν h 2 − w j 2 ν h i , L 3 c ( Ψ ) = g X h =1 n X j =1 z hj − p log (2 π ) − 1 2 log | Σ h | − w j 2 h d h y j + u j − q hj T Λ − 1 h u j − q hj io , (8) and where d h y j = y j − µ h T Ω − 1 h y j − µ h , q hj = ∆ h Ω − 1 h y j − µ h , Λ h = I p − ∆ h Ω − 1 h ∆ h , Ω h = Σ h + ∆ 2 h . Here Ψ contai ns all the unkn o wn parameters of the FM-uMST mo del. The implementa tion of the EM algo rithm requ ires alternating repeatedly the E- and M-steps until conv ergence in the case where th e changes in the log lik eliho o d v alues are less th an some specified small v alue. The E-step calculates the expectation of th e complete-data log lik eliho od give n the observed data y u sing the current estimate of the parameters, known as the Q -fu n ction, give n by Q ( Ψ ; Ψ ( k ) ) = E Ψ ( k ) { log L c ( Ψ ) | y } . The M-step then maximizes the Q -function with resp ect to th e parameters Ψ . On the ( k + 1)th iteratio n, the E-step requires th e calculation of the co nd itional exp ectatio ns e ( k ) 1 ,j = E θ ( k ) W j | y j , (9) e ( k ) 2 ,j = E θ ( k ) W j U j | y j , (10) e ( k ) 3 ,j = E θ ( k ) W j U j U T j | y j . ( 11) 6 EMMIX-usk ew : Fitting Mixtures of Multiv ariate S ke w t -distributions The cond itional exp ectation of Z hj giv en the observed data, is given, usin g Bay es’ Theorem, by τ ( k ) hj = π ( k ) h f p y j ; µ ( k ) h , Σ ( k ) h , δ ( k ) h , ν ( k ) h P g i =1 π ( k ) i f p y j ; µ ( k ) i , Σ ( k ) i , δ ( k ) i , ν ( k ) i . (12) which can b e interpreted as th e p osterior probabilit y of memb ership of the h th component by y j , usin g the current estimate Ψ ( k ) for Ψ . It can b e shown that th e conditional exp ectatio ns e ( k ) 1 ,j , e ( k ) 2 ,j , and e ( k ) 3 ,j are giv en by e ( k ) 1 ,hj = ν ( k ) h + p ν ( k ) h + d ( k ) h y j ! T p,ν ( k ) h + p +2 q ( k ) hj s ν ( k ) h + p +2 ν ( k ) h + d ( k ) h ( y j ) ; 0 , Λ ( k ) h ! T p,ν ( k ) h + p y ∗ ( k ) hj ; 0 , Λ ( k ) h , (13) e ( k ) 2 ,hj = e ( k ) 1 ,hj E ( X ) , (14) and e ( k ) 3 ,hj = e ( k ) 1 ,hj E ( X X T ) , (15) where X i s a p -dimensional t -v ariate truncated to th e p ositiv e hyperplane R + , whic h is distributed as X ∼ tt p,ν ( k ) h + p +2 q ( k ) hj , ν ( k ) h + d ( k ) h ( y j ) ν ( k ) h + p + 2 ! Λ ( k ) h ; R + ! , (16) where tt p,ν ( µ , Σ ; R + ) d enotes the p ositiv ely truncated t -distribution with location vector µ , scale matrix Σ , and ν degrees of f r eedom. The trun cated moment s E ( X ) and E ( X X T ) can b e swiftly ev aluated by noting that they can b e expressed in terms of the distribu tion fu nction of a (non-truncated) multiv ariate c entral t -random vector; Lee and McLac hlan ( 20 11 , 2012 a ). Recen tly , Ho et al. ( 2 012 ) hav e considered the m oments of of the doub ly tru n cated multiv ari- ate t -distrib ution, but their result corr esp on d ing to ( 16 ) is incorrect; see Lee and McLac hlan ( 2012 a ) for f urther d etails. The ( k + 1)th M-step consists of maximization of the Q -function with resp ect to Ψ . It follo ws that an up d ated estimate of the un known paramete rs of the FM-uMST m odel is give n by µ ( k ) h = P n j =1 τ ( k ) hj h e ( k ) 1 ,hj y j − ∆ ( k ) h e ( k ) 2 ,hj i P n j =1 τ ( k ) hj e ( k ) 1 ,hj , (17) δ ( k +1) h = Σ ( k ) − 1 h ⊙ n X j =1 τ ( k ) hj e ( k ) 3 ,hj − 1 diag Σ ( k ) − 1 h n X j =1 τ ( k ) hj y j − µ ( k +1) h e ( k ) T 2 ,hj , (18) and Σ ( k +1) h = 1 P n j =1 τ ( k ) hj n X j =1 τ ( k ) hj h ∆ ( k +1) h e ( k ) T 3 ,hj ∆ ( k +1) T h − y j − µ ( k +1) h e ( k ) T 2 ,hj ∆ ( k +1) h − ∆ ( k +1) h e ( k ) 2 ,hj y j − µ ( k +1) h T + y j − µ ( k +1) h y j − µ ( k +1) h T e ( k ) 1 ,hj , (19) Sharon Lee & Geoffrey McLac hlan 7 where ⊙ d enotes element-wise matrix pr o du ct. Note th at ( 18 ) and also ( 16 ) are given incor- rectly in Lee and McLac hlan ( 2011 ). An u p date ν ( k +1) h of the degrees of freedom is obtained by solving iterativel y the equation log ν ( k +1) h 2 ! − ψ ν ( k +1) h 2 ! = P n j =1 τ ( k ) hj log ν ( k ) h + d ( k ) h ( y j ) 2 − ψ ν ( k ) h + p 2 + ν ( k ) h + p ν ( k ) h + d ( k ) h ( y j ) P n j =1 τ ( k ) hj , where ψ ( x ) = Γ ′ ( x ) Γ( x ) is the Digamma function. This last equation has b een simp lifi ed by making use of a one-step-late appr oximation ( Green 1990 ) in u p dating the estimate of ν h . As a consequence, it can affect th e monotonicit y of the likelihoo d f u nction. Ou r exp erience suggests that this r arely happ ens. The m on otonicity of the likelihoo d can b e preserved by wo rkin g with the exact expression as given by Equatio n (73) in Lee and McLachlan ( 2012a ). There is an option in the program to u se th is m ore time consuming up dating of ν h . Th e algorithm d escrib ed in this Section is imp lemen ted as the fmmst fu n ction in EMMIX-uskew . 3.2. Cho osing initial v alues It is imp ortant to obtain suitable in itial v alues in ord er for fmms t to conv erge quickly . In EMMIX-uskew , starting v alues for the mo d el parameters are based on an initial clustering giv en by k -means. T went y attempts of k -means are p erf ormed, and the starting component labels z (0) j ( j = 1 , . . . , n ) are initialized according to the clustering result with the h ighest relativ e log likeli ho o d (see Lee and McLac hlan ( 2012 a )). Th e other parameters are in itialize d as follo ws: Σ (0) = S h − ( a − 1) diag ( s h ) , δ (0) = sign( γ h ) r (1 − a ) π π − 2 s ∗ h , µ (0) = ¯ y − r 2 π δ (0) , ν (0) = 40 , (20) where S h is the sample co v ariance of the h th component, and where γ h is the sample skewness of the h th comp onent, whose i th element is giv en by γ i = n − 1 P n j =1 ( y ij − µ i ) 3 n − 1 P n j =1 ( y ij − µ i ) 2 3 2 ( i = 1 , . . . , p ) , and wher e y ij denotes the i th element of the j th observ ation, and µ i is the i th element of µ . Here, s h denotes the vector created by extracting the main diagonal of S h , and the vector s ∗ h is created by taking the sq u are root of eac h elemen t in s h . T h e scalar a is v aried systematically across the interv al (0 , 1) to search for a (relativ ely) optimal set of starting v alues for the mod el parameters. 3.3. Stopping rule 8 EMMIX-usk ew : Fitting Mixtures of Multiv ariate S ke w t -distributions EMMIX-uskew adopts a traditional stopping cr iterion w hich is based on the absolute change in the size of the log lik elihoo d. An Aitke n acceleration-based strategy is describ ed in Lin ( 2010 ). The algorithm is terminated when the absolute d ifference b et ween the log like liho o d v alue and the asymptotic log likelihood v alue is less than a sep cified tolerance, ǫ , that is L ( k +1) ∞ − L ( k +1) < ǫ, (21) where L ( k +1) ∞ is the asymptotic estimate of the log like liho od at the ( k + 1)th iteration, giv en by L ( k +1) ∞ = L ( k ) + L ( k +1) − L ( k ) 1 − α ( k ) , and α ( k ) = L ( k +1) − L ( k ) L ( k ) − L ( k − 1) is the Aitken’s acceleration at the k th iteration. Th e default tolerance is ǫ = 10 − 3 , bu t the user can sp ecify a different v alue. 4. Using the EMM IX-usk ew pac k age The parameters of the FM-uMST model in EMMIX-uskew are s p ecified as a list structure con taining the elemen ts describ ed in T able 1 . The parameters µ , Σ , and δ are each imple- mente d as a list of g matrices, where g is th e number o f comp onents in the fitted mod el. F or example, mu[ [2]] is a p × 1 matrix representing µ 2 . Each sigma[[h]] ( h = 1 , . . . , g ) is a p × p matrix representing the symmetric positive definite scale matrix of the h th comp onent. The parameters dof and p ro are g by 1 arra ys, representing the ve ctor of degrees of freedom and the vecto r of mixing prop ortions for each comp onent, resp ectiv ely . parameter R argum ent s Dimensions Description µ mu p × 1 × g the location parameter Σ sigma p × p × g the scale matrix δ delta p × 1 × g the skewness parameter ν dof g × 1 the degrees of freedom π pro g × 1 the mixing p rop ortions T able 1: Structure of th e m odel p arameters in EMMIX-uskew . The pr obabilit y density fun ction of a multiv ariate sk ew t -distribution is cal culated by the dmst fu nction. The p arameter dat is an n × p matrix, con taining the co ordinates of the n p oint (s) at which the d ensit y is to b e ev aluated. Th e follo wing command will return a v ector of n density v alues. dmst(dat , mu , sigma, delta, dof) F or a FM-uMST density , the f u nction df mmst can b e us ed. dfmmst(d at, mu, sigma, delta, dof, pro) 4.1. Generating samples from a FM-uMST distribution Consider generating a random sample of n p -dimensional uMST obs erv ations, with lo cation parameter µ , scale matrix Σ , skewness parameter δ , and degrees of freedom ν . Th e function rfmmst sup p orts tw o typ es of inp uts – the parameters can b e passed as sep arate argument s, or as a single list argum ent known with elements as sp ecified in T able 1 : Sharon Lee & Geoffrey McLac hlan 9 rfmmst(g , n, mu, sig ma, delta, dof, pro, known=NULL, ...) As an example, supp ose that µ = (1 , 2) T , Σ is the id ent ity matrix, δ = ( − 1 , 1) T , and ν = 4. Then the follo wing command will generate a r andom sample of 500 observ ations fr om the uM S T 2 , 4 ( µ , Σ , δ ) d istribution, R> rfmmst(1, 500, c(1 ,2), diag(2), c(-1,1), 4, 1) T o generate a mixture of uMST rand om samples, the abov e command can b e issu ed . Alter- nativ ely , the p arameters can b e sp ecified in a list stru cture (T able 1 ) ob j as follo ws: R> obj <- list() R> obj$mu <- list(c(17,19) , c(5,22 ), c(6,10)) R> obj$sigma <- list(diag(2), matrix(c(2,0 ,0,1),2), matrix(c( 3,7,7,24) ,2)) R> obj$delta <- list(c(3,1.5), c(5,10), c(2,0)) R> obj$dof <- c(1, 2, 3) R> obj$pro <- c(0.25, 0.25, 0.5) R> rfmmst(3, 500, known=obj ) An outpu t of the r fmmst fun ction consists of p + 1 columns . The fi r st p columns are th e coordin ates of the generated sample. Th e last column indicates fr om w hich compon ent eac h data p oint is generated. Executing the abov e command will generate an output similar to the follo wing: [,1] [,2] [,3] [1,] 19.91520 20.48515 1 [2,] 72.81161 33.41381 1 [3,] 17.02193 23.29119 1 [4,] 23.53926 19.27946 1 [5,] 16.85195 21.21340 1 [6,] 18.01906 18.16612 1 [7,] 22.23609 21.12174 1 [8,] 44.65444 28.23259 1 [9,] 18.18883 26.72330 1 [10,] 20.18908 18.97005 1 ... rest omitted ... 4.2. Fitting a single m ultiv ariate sk ew t -distribution T o fit a sp ecified FM-uMST model, the co re fun ction in EMMIX-usk ew , fmmst , is used. This implements the algorithm describ ed in Section 3 . A typical function call of fmmst is: fmmst(g, dat, initial=NULL , known= NULL, it max=100, eps=1e-3, nkmeans= 20, print=TRUE) The m ain arguments used within this fun ction are: • g : a scalar that sp ecifies the num b er of uMS T comp onents to b e fi tted. 10 EMMIX-usk ew : Fitting Mixtures of Multiv ariate Skew t -distributions • dat : an n × p matrix conta ining the data. • initial : a list that s p ecifies th e initial v alues used to start the algorithm. • known : a list that sp ecifies any mo del parameters that are known and so not required to b e estimated. • itmax : a scalar that sp ecifies th e maximum num b er of iterations to b e u sed. • eps : a scalar that sp ecifies the termin ation criterion of the EM algorithm lo op. • nkmeans : an inte ger that sp ecify the num b er of k -means trials to b e us ed to s elect the b est set of initial v alues. Note that if the initial v alues of the mod el parameters are pr o vided by the us er, the argumen t initial is exp ected to b e structured as described in T able 1 . Similarly , known is exp ected to hav e the same structure. When initial =NULL , fmmst will generate a s et of initial v alues using the pro cedure described in Section 3.2 . Any p arameters s p ecified in known are tak en as known parameters and hence are n ot estimated by fmmst . There is no need to sp ecify the v alues of all the p arameters in in itial and known when only some of the p arameters are known. Parameters that are not specified in the fu nction ca ll are estimated b y fmmst . By default, fmms t p erf orm s 20 k -means attempts when searching for th e b est initial v alue. The user can sp ecify a different v alue using nkmeans . Th e termination criterion for the E MMIX- uskew algorithm is controlled b y the parameters itm ax an d eps . The EM lo op terminates when either one of th e t wo criterion is satisfied, whichev er o ccurs first: (a) the EM lo op reac hes itmax it erations (default is 100 iterations), or (b) th e abs olute difference betw een the current lo g lik eliho od v alue and that the asymp totic log lileklihoo d v alue is s m aller than eps (default is 1e-3 ). The last argument of fmmst is print . When the option print is set to TRUE (default), fmmst prints the log lik elihoo d v alue at each iteratio n and d isplays a summ ary of the parameters of the fitted mo del after termination. T o turn off the p rint m ode, simply set p rint=FAL SE . F or further details of the argu m ent s of f mmst , the reader is referred to the do cu menta tion of fmm st . This can b e accessed by t yping ?fmmst at the R command prompt. W e consider no w the T-cell phosp horylation dataset ( Maier et al. 2007 ) as an example of asymmetrically distrib uted data, av ailable f rom Pyne et al. ( 2009b ). Th e d ata contai n mea- surements of blo o d samples stained with four an tib od ies, CD4, CD45 RA, SLP76, and Z AP70. F or illustr ation, we randomly s elect 500 observ ations and focus on tw o of the v ariables, CD4 and ZAP70. T o fit a MST m o del to this biv ariate Lymp homa d ataset, under the default settings, the follo wing command is issued: R> set.seed( 12345) R > data("Ly mpho") R > LymphoSa mple <- Lym pho[sampl e(1:nrow(Lympho), 500),] R > Fit <- fmmst(1, LymphoSample) A sum mary of the output of the fitted m odel can b e obtained u sing the s ummary function. This prints the v alues of the fitted mo del p arameters for each co mp onent. F or a fitted uMST mod el, the w eighti ng prop ortion (which is 1) is not prin ted. The f ollowing outpu t sh ows a t ypical summary of a fitted single comp onent uMST mo del. Sharon Lee & Geoffrey McLac hlan 11 R > summary( Fit) Finite Mixture of Multivari ate S kew t-Distributi on with 1 component Mean: [,1] [1,] 4.808245 [2,] 5.500559 Scale matrix: [[1]] [,1] [,2] [1,] 0.06778378 0.03721489 [2,] 0.03721489 0.04811898 Skewness parameter: [,1] [1,] -0.7082174 [2,] -0.7990700 Degrees of freedom: 5.851434 > summary(Fi t) Finite Mixture of Multivara te Sk ew t-Distributio ns with 1 component Mean: [,1] [1,] 4.808245 [2,] 5.500559 Scale matrix: [[1]] [,1] [,2] [1,] 0.06778378 0.03721489 [2,] 0.03721489 0.04811898 Skewness parameter: [,1] [1,] -0.7082174 [2,] -0.7990700 12 EMMIX-usk ew : Fitting Mixtures of Multiv ariate Skew t -distributions Degrees of freedom: 5.851434 T o view a more detailed outpu t of the fmmst function, the print fu nction is called. Th is out- puts a list cont aining 11 elements. The fir s t fiv e elemen ts give th e e stimates of th e parameters of the fitted FM-uMST mo d el, as describ ed in T able 1 . The posterior probability of comp onent m em b ersh ip is giv en by the output argumen t tau , a g × n matrix where the r o ws correspond s to th e comp onent number. Th e fi nal partition of each d ata p oint, based on tau , is stored as c lusters . T h e v alue of the log lik elihoo d function, ev aluated with the current parameter estimates, is giv en by loglik . The last tw o arguments aic and bic are the v alues of the Ak aike inf ormation criterion (AIC) and the Ba yes information criterion (BIC), resp ectiv ely . T he follo wing outp u t sho ws an excerpt from the second p art of the pri nt output of th e fitted mo del. R> print(Fit ) Finite Mixture of Multivari ate S kew t-Distributi ons with 1 component ... first five components omitted ... $tau [,1] [,2] [,3] [,4] [,5] [,6] [,7] [,8] [,9] [,10] [,11] [,12] [,13] [,14] [1,] 1 1 1 1 1 1 1 1 1 1 1 1 1 1 ... rest omitted ... $cluster s [1] 1 1 1 1 1 1 1 1 1 1 1 1 1 1 ... rest omitted ... $loglik [1] -880.711 5 $aic [1] 1777.423 $bic [1] 1811.14 As mentioned p reviously , initial v alues for the EM algorithm can b e sp ecified by the user. Supp ose an initia l guess of µ for the a b ov e exa mple is (5 , 6) T , then o ne can specify µ (0) to be (5 , 6) T by issuing the command: R> obj <- list() R> obj$mu <- list(c(5, 6)) R> fmmst(1, LymphoSampl e, initi al=obj) This will start the EM algorithm with the sp ecified v alue for µ (0) , and the other parameters using ( 20 ). The user can f urther d emand m ore k -means trials to b e p erformed by increasing nkmeans , for example, to 50 trials. This can b e achiev ed by iss uing the follo wing command. Sharon Lee & Geoffrey McLac hlan 13 R> fmmst(1, LymphoSampl e, nkmea ns=50) 4.3. Fitting mixtures of m ultiv ariate skew t -distributions This section presents an illustration of fitting a mixture of un restricted skew t -distrib utions to some biv ariate bimo dal asymmetric data. W e consider the Australian Institute of Sp ort (AIS) data from Cook and W eisberg ( 1994 ), wh ere thirteen b ody measurements on 102 m ale and 100 female athletes were recorded. In this example, we consid er the clustering of the d ata with a tw o component skew t -mixtur e model based on the t wo v ariables Height and Body fat. By setting print= TRUE , we can examine the v alue of the log like liho od f unction at eac h iteration. R> Fit2 <- fmmst(2, ais[,c(2,12)], pr int=TRUE ) Finite Mixture of Multivari ate S kew t-Distributi ons with 2 components -------- --------- ---------------------- ----------- Iteratio n 1 : loglik = -1372.711 Iteratio n 2 : loglik = -1370.495 Iteratio n 3 : loglik = -1368.773 Iteratio n 4 : loglik = -1367.392 Iteratio n 5 : loglik = -1366.251 ... rest omitted ... -------- --------- ---------------------- ----------- Iteratio n 100 : loglik = -1 343.541 Componen t means: [,1] [,2] [1,] 181.91720 181.448906 [2,] 13.67975 5.8 14277 Componen t scale matrices: [[1]] [,1] [,2] [1,] 26.32964 18.75208 [2,] 18.75208 16.12990 [[2]] [,1] [,2] [1,] 61.598537 2.3177048 [2,] 2.317705 0.1515253 Componen t skewness parameters : [,1] [,2] [1,] -9.582015 3.591328 14 EMMIX-usk ew : Fitting Mixtures of Multiv ariate Skew t -distributions [2,] 5.975328 5.729339 Componen t degrees of freedom: 60.03386 28.94895 Componen t mixing proportions: 0.410217 8 0.5897822 W e compare the results with t wo other mo del-based clustering metho ds pro vided by the pac k age mixsmsn ( Prates et al. 201 1 ) and EMMIX-skew ( W ang e t al. 2009 ). As mentioned previously , this tw o mo dels are based on mixtur e of restricted versions of th e multiv ariate ske w t -distributions. The first mo del adopts the sk ew normal/indep endent s kew t -distribu tion ( Cabral et al. 2012 ) as its component densities, wh ic h is equiv alen t to the restricted skew t - distribution ( Pyne e t al. 2009a ) u sed in the second mo del. How ever, it should b e noted that, in the ECME algorithm implemented in the pack age mixsmsn , the comp onent degrees of freedom are constr ained to b e the s ame. A comparison of the table of cluster lab els (p ermuted where n ecessary to minimize the number of misallocations) with the true class lab els (giv en by ais$Sex in this example; M for male, F for female) revea ls that th e FM-uMST mo del has a higher num b er of correct allocations (18 3 compared to 162 and 157 giv en by mixsmsn and E MMIX-sk ew , respective ly). Th us, the unrestricted FM-uMST model in EMMIX-uskew giv es a m ore accurate clustering in this case. R> library(" mixsmsn") R> Fit3 <- smsn.mmix(ai s[c(2,12)], g=2, family="Skew. t", group=T RUE) R> Fit4 <- EmSkew(ais[c (2,12)], 2, "mst", print=FALSE ) R> table(ais $Sex, Fit3$ group) 1 2 M 91 11 F 29 71 R> table(ais $Sex, Fit4$ clust) 1 2 M 89 13 F 32 68 R> table(ais $Sex, Fit2$ clusters) 1 2 M 97 5 F 14 86 4.4. T esting for the significance of the sk ewness parameter When we set δ = 0 in ( 1 ), we obtain the multiv ariate t -density . The fun ction fmmt(g, dat, initial=NULL, known=NULL, itmax=100, eps=1e-3, nkmeans=20, print=TR UE) implements th e EM algorithm for fitting fi nite mixtures of multiv ariate t (FM-MT) distr ibu- tions ( McLac hlan and Peel 2000 ). Sharon Lee & Geoffrey McLac hlan 15 T o test wh ether the skewness parameter in the FM-uMST mo del is significant , one can con- struct a likelihoo d ratio test for the n ull h yp othesis H 0 : δ 1 = . . . = δ g = 0 versus th e alternativ e hyp othesis where at least one of δ h ( h = 1 , . . . , g ) is d ifferent from 0 . This leads to the test statistic LR = − 2 ( L t − L st ) , (22) where L t and L st denote the log like liho od v alue associated with the FM-MT mod el and the FM-uMST mo del, resp ectiv ely . It foll ows that the test stati stics is asymp totica lly distr ibuted as χ 2 r , where r is the difference b etw een the number of parameters under the alternative and null hyp otheses. T h is test is im p lement ed in the function delta.tes t(stmodel=NULL, tmodel=N ULL, stl oglik, tloglik, r) , where the fir st t wo argum ents are the output from fmmst and fmmt resp ective ly . Alternatively , the us er can pr o vide th e log likelihood v alues of the t wo models and the v alue of r dir ectly by sp ecifying the last thr ee argumen ts of delta.te st() . The outpu t of the fu nction is the P -v alue of the test. Consider again th e AIS example in Section 4.6 . If we examine the cluster lab els give n by the FM-MT mod el, we can see that it yields a noticeably higher num b er of misallocations than the skew t -mixtur e mo del. A test for δ = 0 can b e p erformed by issu ing the follo wing commands. In this c ase, the small P -v alue suggests there is strong evidence that the skewness parameter in the FM-uMST fit is significantly different from zero. R> Fit5 <- fmmt(2, ais[,c(2,12)]) R> table(ais $Sex, Fit5$ clusters) 1 2 M 77 23 F 14 88 R> delta.tes t(Fit2, Fit 5) 0.000379 8128 4.5. Discriminan t analysis Discriminant analysis based on a sp ecified FM-uMST mo del can b e p erformed using the fmmstDA fu nction. fmmstDA( g, d at, model) The data in dat are assigned to the cluster correspondin g to the component of the F M-uMST mod el with the highest p osterior p robabilit y . Sp ecifications of the mod el parameters must b e provided in mo del , wh ic h is t ypically an outpu t from fmmst . O p tionally , mo del ca n b e sp ecified b y the user as a list of a t least six elemen ts: the fiv e m odel parameters, and a vec tor of cluster lab els cluste rs . The following commands sh o ws an example using fmmstDA . A random sample of FM-uMST v ariables is generated from rfmmst , th e fi rst part of which is used as training set, and the second is a testing set. The FM-uMST model fitted to the training set is then used for classifying the data in the testing set. R> set.seed( 732) R> X <- rfmmst(3, 200, known=ob j) R> Ind <- sample(1:nrow (X),175) 16 EMMIX-usk ew : Fitting Mixtures of Multiv ariate Skew t -distributions R> train <- X[Ind,] R> test <- X[-Ind,] R> trainmode l <- fmm st(3, train[,1:2]) R> fmmstDA(3 , te st[,1:2], trainmodel) R> results <- fmmstDA(3, test[,1:2] , tr ainmodel) R> table(tes t[,3], resu lts) results 1 2 3 1 0 6 0 2 0 0 5 3 13 0 1 4.6. Visualization of fitted contours The E MMIX-uske w p ac k age sup p orts visualization of the contours of a FM-uMST model in 2D and 3D. The plots are generated by the fun ctions fmmst.co ntour.2d and fmmst.cont our.3d , fmmst.co ntour.2d( dat, mo del, grid=50, drawpoints =TRUE, clus ters=NULL , levels=1 0, c omponent= NULL, map=c( "scatter" , "heat", "cluster"), ...) fmmst.co ntour.3d( dat, mo del, grid=20, drawpoints =TRUE, clus ters=NULL , levels=0 .9, component=NUL L, ...) In fmmst.co ntour.2d ( fmmst.cont our.3d ), the first argument dat is a matrix of co ordinates with two (thr ee) columns. T he second argument model , similar to that in fmmst DA() , is either an output fr om fmmst() , or a list containing the five model paramete rs a nd the cluster lab els. The grid size is d etermined by g rid . By default, the data p oints are included in th e p lot. If only the cont our are required, the option drawp oints=FAL SE should b e set. When including the p oints in a p lot, cluster s sp ecifies the comp onent labels o f each p oint acco rdin g to which the data p oint s will b e colo ur ed. The argument l evels is either an int eger sp ecifying the num b er of conto ur lines to b e plotted, or a v ector o f quantile v alues. F or fmmst.con tour.3d , only the 90th p ercentile contour is plotted by d efault. If more contours are required, the argument le vels should b e a vector of the requir ed quantiles. F or example, if a plot of the 25 th , 50 th , and 75 th p ercent iles are requir ed , then levels = c(0.25, 0.5, 0.75) . Biv ariate data h a ve the optio n of being plotted as an in tensity map instead of s catter plot. This can b e obtained b y setting map="heat" . There is also an option for plotting a cluster map of a fitted mod el using the option map="cl uster" . Plots for sp ecific components of a mixture model can b e requested with th e argument compon ent . Wh en comp onent=NU LL (whic h is default), the mixtur e contour is plotte d. When component is a vec tor with length betw een 1 and g , the sp ecified components are plotted and the mixing prop ortion is not tak en into account. The last argument of the fmmst.co ntour fun ctions “ .. . ” allo ws the user to pass additional arguments to the plot function, such as the colour and size of th e p oints. Figure 1 a sh o ws th e con tour of the fitted MST mo del to th e Lymp homa data. Here a heatmap of the original data is u sed. This plot can b e generated via the command, R> fmmst.con tour.2d(Lympho, model= Fit, map="heat", xlab="SL P76", yl ab="ZAP70 ") Sharon Lee & Geoffrey McLac hlan 17 Figure 1: 2D contour plots generated by the f mmst.cont our.2d function. (a) The fitted con tour of the single component uMST mod el p lotted ov er th e hue intensit y diagram of the Lymph oma dataset; (b) th e default mixture contour plot of the fi tted tw o-comp onent FM-uMST mo del of the AIS dataset; (c) the contour of the individual comp onents of the three-component mod el fitted to a biv ariate syntheti c sample plotted ov er the cluster map of the sample. The default fmmst.contou r.2d fu nction will r etur n a scatter plot of the d ata in 2D sup er- imp osed with the con tours of the fitted mixture mo del. F or example, the follo wing command generates a con tour p lot of th e fitted FM-uMST mo del to the ai s data in Section 4.2 (Fig- ure 1 b). Note that fm mst.cont our.2d coloured t he sample p oints according to the clustering giv en by the argument cluster s : R> label <- ais$Sex R> label[lab el==0] <- 2 R> fmmst.con tour.2d(ais[,c(2,12)], model=Fit2 , clu sters=lab el, xlab="Ht ", y lab="Bfat ") Supp ose w e are intereste d in v isu alizing a clustering map of the fitted mo del to the simulated data in Section 4.5 . This plot can b e generated by issuing the following command. R> fmmst.con tour.2d(X, mode l=trainmo del, clusters=X [,3], map="c luster", componen t=1:3) The ou tp ut is given in Figure 1 c. T o demonstrate the use of fmmst .contour .3d , we consider the clustering of a triv ariate Diffus e Large B-c ell Lymph oma (DLBCL) dataset pro vided b y the British Colum bia Cancer Agency . The data conta in fl uorescent intensities of multiple conjugated an tib o dies (known as mark ers) stained on a sample of o ver 8000 cells deriv ed fr om the lymp h no des of patient s diagnosed with DLBCL. In flo w cytometric analysis, these parallel measurements of flu orescen t intensities can b e used to study the differential expression of different surface and intrace llular pr oteins of a giv en bloo d sample. The a nalysis t ypically inv olv es the identifica tion of cell p opulations from the multidimensional dataset, cur rently p er f ormed manually by visually separating regions (gates) of interests on a series of sequential biv ariate pr o j ections of the data , a process known 18 EMMIX-usk ew : Fitting Mixtures of Multiv ariate Skew t -distributions Method FLAME flo wClu st fl o wMeans FM-uMST Error rate 0.074 0.076 0.140 0.046 T able 2: Err or rate of misclassification of four method s for the DLBCL dataset. as gating . Due to the sub j ective and time-consumin g n ature of this approach, and the difficulty in d etecting higher-dimens ional inter-marke r r elationships, man y efforts ha ve b een made to deve lop computational metho ds to automate the gating pr ocess. The DLBCL samples here were stained with three markers CD3, CD5, and C D19. The task is to a utomatically gate the cells b y clustering the data into four groups. Hence we fit a four- compon ent FM-uMST mo del to the d ata. The maximum num b er of iterations was increased to 300. A scatterplot of the data is shown in Figure 2 , w here the dots are colo ured according to the clustering pr o vided by human exp erts, which are considered as the ‘true’ class labels. Figure 2 b sho ws the 95 th p ercent ile densit y conto urs of the four components of the fitted mod el wh ich are displa yed with matc hing colours. The 3D plot uses the rgl visualization device system, and h ence sup p orts u ser friend ly interact ive n avigatio n. The plots can b e rotated in real-time to select a suitable viewp oint. The follo wing co de ca n b e used to ge nerate the 3D plots in Figure 2 . R> Fit6 <- fmmst(DLBCL, 4, itmax=300) R> fmmst.con tour.3d(DLBCL, model=F it4, level=0.9, drawpoint s=FALSE, xlab="FL 1.LOG", ylab ="FL2.LOG ", zlab="FL 4.LOG", quan tile=0.95 ) The effectiv eness of a clustering can b e obtained by co mparin g its error r ate with the cluster labels from man ual exp ert gating take n to b e the true class labels. This err or rate is calculate d for eac h permutation of the cluster lab els of the clustering resu lt under consideration and the rate rep orted is the minim um v alue ov er all such p ermutations. Note that dead cells w ere remo ved b efore ev aluating the error rate against the b enchmark results. F or comparison, we calculate d the error rate associated with the clustering results given by thr ee other metho ds – FLAME ( Pyne e t al. 2009a ), flowClust ( Lo et al. 2008 ) and flowMea ns ( Aghaeep our et al. 2011 ). F rom T able 2 , the FM-uMST mod el clearly sho ws sup erior performances in this dataset. 5. Concluding remarks W e h a ve presen ted the R pac k age EMMIX-usk ew for fitting finite mixtures of unrestricted multiv ariate sk ew t -distributions to h eterogeneo us asymmetric d ata. The pack age implemen ts a closed-form EM algorithm for fitting FM-uMST mo dels and provides user-fr iendly visu al- ization of the fitted con tours in 2D and 3D. The ma jor features of the soft ware ha ve b een demonstrated on th r ee real examples on the T -cell phosph ory lation data, the Australian In- stitute of Sp orts (AIS) data, and the DLBCL dataset. The clustering results were compared to those obtained via mixtures of restricte d m ultiv ariate skew t -distributions and other meth- od s . In b oth the AIS and DLBCL illus trations, the unrestricted model gav e better clustering results w ith resp ect to th e tr ue class lab els. Sharon Lee & Geoffrey McLac hlan 19 Figure 2: 3D contours p lot of the DLBCL dataset generated b y the fmmst.contour .3d fun c- tion. (a) A scatterplot of the data coloured according to the the tru e clustering lab els of th e DLBCL dataset; (b) fitted con tour of the three comp onent FM-uMST mo del for the DLBCL dataset. It should b e note d that t he fitting of the u nrestricted skew t -mixture model can b e qu ite slow in h igher dim en sional applications, due to th e computationally in tensive pro cedure invo lved in the calculatio n of multiv ariate t -distribution function v alues. The algorithm would b enefi t from further researc h on app licable acce leration tec hniqu es, for example, the implementa tion of the SQ UAREM strategy ( V aradh an and Roland 2008 ). Ac kno wledgmen ts This w ork is supp orted by a grant from the Australian R esearch Council. Also, w e would like to thank Professor Seung-Gu Kim for co mments and correctio ns, and Drs. Kui (Sam) W ang, Saumy adipta Pyne, and F elix Lamp f or their helpfu l discussions on this topic. References Aghaeepour N, Nikoloc R, Ho os H, Brin kman R (2 011). “Rapid Cell P opulation Identificat ion in Flow Cytometry Dat a.” Cytometry. Par t A: journal of the Internatio nal So ciety for Ana lytic al Cytolo gy , 79 , 6–13. Azzalini A (1 985). “A Class of Distributions Which Includes the Normal On es.” Sc andinavian Journal of Statistics , 12 , 171–178. Azzalini A, Capitanio A (2003). “Distributions Generated b y P erturbation of Symmetry with Emphasis on a Multiv ariate S kew t Distribution.” J ournal of the R oyal Statistic al So ciety B , 65 , 367–389 . 20 EMMIX-usk ew : Fitting Mixtures of Multiv ariate Skew t -distributions Banfield JD, Raftery A (1993). “Model-based Gaussian and n on-Gaussian Clustering.” Bio- metrics , 49 , 803–82 1. Basso RM, Lachos VH, C abral CRB, Ghosh P (201 0). “Robus t Mixture Modeling Based on Scale Mixtures of Skew-normal Distributions.” Computational Stat istics and Data Anal ysis , 54 , 2926–2941 . B ¨ ohning D (2000). Computer Assiste d Analysis of Mixtur es and Applic ations: Meta-Ana lysis, Dise ase Mapping, and Others . Ch apman and Hall/CR C, London. Cabral C R, Lachos VH, Prates MO (2012). “Multiv ariate Mixture Mo deling using Sk ew- normal In dep endent Dist ribu tions.” Comp utational Statistics and Data Ana lysis , 56 , 126– 142. Cook RD, W eisb erg S (1994 ). An Intr o duction to R e gr ession Gr aphics . John Wiley & S ons, New Y ork. Eve ritt BS, Hand DJ (1981). Finite Mixtur e Distributions . C hapman and Hall, London. F raley C, Raftery AE (1999). “Ho w Many Clusters? Whic h Clustering Method s? Answers via Mo del-based Clus ter Analysis.” Computer Journal , 41 , 578–588 . F r ¨ uhwirth-Sc hn atter S (2006). Finite Mixtur e and Markov Sw itching Mo dels . Sp r inger-V erlag, London. F r ¨ uhwirth-Sc hn atter S, Pyne S (2010). “Ba yesian Inference for Finite Mixtures of Univ ariat e and Multiv ariate Skew-normal and Skew- t Distributions.” Biostatistics , 11 , 317–33 6. Green PJ (1990 ). “On Use of the EM Algo rithm for Penalized Like liho o d E s timation.” J ournal of the R oyal Statistic al So ciety B , 52 , 443–45 2. Gupta AK (2003). “Multiv ariate S ke w- t Distribu tion.” Statistics , 37 , 359–36 3. Ho HJ, Lin TI, Chen HY, W ang WL (2012) . “Some Results on the T runcated Multiv ariate t Distribution.” Journal of Statistic al Planning and Infer enc e , 142 , 25–40. Lac hos VH, Ghosh P , Arellano-V alle RB (2010). “Likelihood Based Inferen ce for S kew Normal Indep endent Linear Mixed Mo d els.” Statistic a Sinic a , 20 , 303–322. Lee S , McLac hlan GJ (2011). “On the Fitting of Mixtur es of Multiv ariate S ke w t-distributions via th e EM Algorithm.” arXiv:1109.470 6 [stat.ME] . Lee S, McLachlan GJ (2012a). “Finite Mixtures of Multiv ariate S kew t -distributions: some recen t and new results.” Statistics and Computing . doi:10.1 007/s1122 2-012-9362-4 . Lee SX, McLac hlan GJ (2012b). “On Mixtures of S kew-normal and Skew t -distributions.” arXiv:1211.36 02 [stat.ME] . Lin TI (20 10). “Robust Mixture Modeling using Multiv ariate Skew- t Distribu tion.” Statistics and Computing , 20 , 343–3 56. Lindsay BG (1995). Mixtur e Mo dels: The ory, Ge ometry, and Applic ations . NSF-CBMS Re- gional Conference S eries in probabilit y and Statist ics, V olume 5, Institute of Mat hematical Statistics, Hayw ard, CA. Sharon Lee & Geoffrey McLac hlan 21 Lo K, Brin kman R, Gottardo R (2008). “A utomated Gating of Flo w C y tometry Data via Robust Mo del-based Clustering.” Cytometry. P art A: J ournal of the International So ciety for Analytic al Cytolo gy , 73 , 321–332 . Maier LM, Anderson DE, De Jager PL, Wick er LS , Hafler DA (2007). “Allelic V ariant in CTLA4 Alters T C ell Ph osphorylation Pa tterns.” Pr o c e e dings of the National A c ademy of Scienc es of the USA , 104 , 18607–18 612. McLac hlan GJ, Basford KE (1988). Mixtur e Mo dels: Infer enc e and Applic ations . Marcel Dekk er, New Y ork. McLac hlan GJ, Pe el D (2000). Finite Mixtur e Mo dels . John Wiley & S ons, New Y ork. Mengersen K, Rob ert C, Titterington M (2011). Mixtur es: Estimation and Applic ations . John Wiley & Sons, New Y ork. Prates M, Lachos V, Cabral C (2011) . mixsmsn : Fitting Finite Mixtur e of Sc ale Mixtur e of Skew-normal Distributions. R pack age version 0.3-2, URL http://CRAN.R- pr oject. org/ package= mixsmsn . R Dev elopment T eam (2011) . R : A L anguage and Envi r onment for Statistic al Computing . R F oun dation for S tatistica l Computing, Vienn a, Au s tria. IS BN 3-9 00051-07 -0, URL http:// www.R- proj ect.org/ . Pyne S, Hu X, W ang K, Rossin E, Lin TI, Maier LM, Baecher-Alla n C, McLac hlan GJ, T ama y o P , Hafler DA, De Jager PL, Mesiro w JP (2009a). “Automated High-dimensional Flo w Cytometric Data Analysis.” Pr o c e e dings of the National A c ademy of Scienc es of the USA , 106 , 8519–852 4. Pyne S, Hu X, W ang K, Rossin E, Lin TI, Maier LM, Baecher-Alla n C, McLac hlan GJ, T ama y o P , Hafler D A, De Jager PL, Mesirow JP (2009b). FLAME : Flow A nalysis with Autom ate d Multivariate Estimation . URL http://www.broadinstitu te. org/cancer/ software / genepat tern/ modules/FLAME/published_data . Sahu SK, Dey DK, Branco MD (2003). “A New Class of Multiv ariate Skew Distributions with App licatio ns to Bay esian Regression Mo dels.” The Canadian Journal of Statistics , 31 , 129–150. Titterington DM, Smith AFM, Marko v UE (1985) . Statistic al Ana lysis of Finite Mixtur e Distributions . John Wiley & S ons, New Y ork. V aradh an R, Roland C (2008). “Simple and Globally C onve rgent Metho ds for Accele rating the Conve rgence of Any EM Algorithm.” Sc andinavian Journal of Statistics , 35 , 335–35 3. W ang K, McLac hlan GJ, Ng A, Peel D (200 9). EMMIX -skew : EM Algorithm for Mi xtur e of M ultivariate Sk ew Normal/ t Distributions. EMMIX was originally written in F ortran by Da vid P eel. R p ac k age v ersion 1.0.20, URL http://www.maths.uq.edu. au/~gjm/mix_ soft/EMMIX- skew . 22 EMMIX-usk ew : Fitting Mixtures of Multiv ariate Skew t -distributions Affiliation: Geoffrey J. McLac hlan Department of mathematics Unive rsity of Queensland Brisbane, Aus tralia E-mail: g.mclach lan@uq.ed u.au
Original Paper
Loading high-quality paper...
Comments & Academic Discussion
Loading comments...
Leave a Comment