A long-time limit of world subway networks
We study the temporal evolution of the structure of the world’s largest subway networks in an exploratory manner. We show that, remarkably, all these networks converge to {a shape which shares similar generic features} despite their geographic and economic differences. This limiting shape is made of a core with branches radiating from it. For most of these networks, the average degree of a node (station) within the core has a value of order 2.5 and the proportion of k=2 nodes in the core is larger than 60%. The number of branches scales roughly as the square root of the number of stations, the current proportion of branches represents about half of the total number of stations, and the average diameter of branches is about twice the average radial extension of the core. Spatial measures such as the number of stations at a given distance to the barycenter display a first regime which grows as r^2 followed by another regime with different exponents, and eventually saturates. These results – difficult to interpret in the framework of fractal geometry – confirm and yield a natural explanation in the geometric picture of this core and their branches: the first regime corresponds to a uniform core, while the second regime is controlled by the interstation spacing on branches. The apparent convergence towards a unique network shape in the temporal limit suggests the existence of dominant, universal mechanisms governing the evolution of these structures.
💡 Research Summary
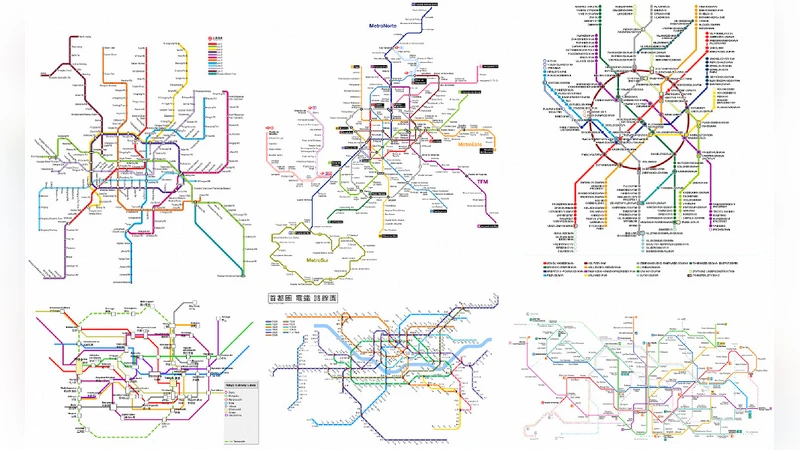
This paper conducts an exploratory, data‑driven investigation of the temporal evolution of the world’s largest subway systems. Using historical opening dates for lines and stations extracted primarily from Wikipedia, the authors reconstruct the network topology for each city at yearly intervals up to 2009. Fourteen metropolitan systems are examined—Beijing, Tokyo, Paris, New York, London, Shanghai, Moscow, Berlin, Madrid, Seoul, Mexico City, Chicago, Osaka, and Barcelona—each with at least one hundred stations.
The central empirical finding is that, despite vast differences in geography, history, and economic context, all these networks appear to converge toward a universal “core‑and‑branches” morphology. The authors define the core as the densely connected central region where the average node degree is about 2.5 and more than 60 % of the nodes have degree 2. Branches are linear extensions radiating from the core; they contain roughly half of all stations, and the number of distinct branches scales as the square root of the total number of stations (B ≈ c √N, with c≈0.5). The average branch length is about twice the average radial extent of the core, indicating that the core remains compact while the periphery expands linearly.
Spatial analysis of station density as a function of distance r from the network barycenter reveals two distinct scaling regimes. For small r (the core) the cumulative number of stations N(r) grows as r², consistent with a uniform two‑dimensional distribution. Beyond a characteristic radius, N(r) follows a different power law (approximately r¹·⁵ in the data) before eventually saturating, reflecting the transition from a dense core to sparsely spaced stations along the branches. The authors argue that this two‑stage behavior cannot be captured by simple fractal models but is naturally explained by the core‑and‑branches picture.
Temporal dynamics are quantified by the annual station addition rate v = dN/dt. Across all cities the mean v lies between 1.4 and 3.7 stations per year, with a substantial “inactive” fraction of about 58 % of years showing no new stations. Early phases of network development exhibit higher v, but once a system reaches a size of a few hundred stations, growth slows dramatically, suggesting diminishing returns, spatial constraints, and saturation of demand.
The authors also compare total track length L with a theoretical regular planar graph length L_reg that would arise from a uniform node spacing given the same number of stations, average degree, and metropolitan area. The ratio L/L_reg ranges from 0.08 to 0.88, highlighting considerable variation in network density and redundancy among cities. Osaka, Madrid, and Seoul display higher ratios, indicating more reticulated structures, whereas Chicago and New York have lower ratios, reflecting more tree‑like, geographically constrained layouts.
Overall, the study provides strong empirical support for the hypothesis that subway networks self‑organize under a set of universal mechanisms that drive them toward a core‑and‑branches configuration. This insight has practical implications: urban planners and transit authorities might prioritize strengthening the central core and then extending linear branches in a controlled manner, rather than pursuing indiscriminate densification. The paper concludes by calling for future work that integrates socioeconomic variables—population density, land‑use patterns, and travel demand—to deepen the understanding of the forces shaping subway network evolution.
Comments & Academic Discussion
Loading comments...
Leave a Comment