Innovation as a Nonlinear Process, the Scientometric Perspective, and the Specification of an "Innovation Opportunities Explorer"
The process of innovation follows non-linear patterns across the domains of science, technology, and the economy. Novel bibliometric mapping techniques can be used to investigate and represent distinctive, but complementary perspectives on the innovation process (e.g., “demand” and “supply”) as well as the interactions among these perspectives. The perspectives can be represented as “continents” of data related to varying extents over time. For example, the different branches of Medical Subject Headings (MeSH) in the Medline database provide sources of such perspectives (e.g., “Diseases” versus “Drugs and Chemicals”). The multiple-perspective approach enables us to reconstruct facets of the dynamics of innovation, in terms of selection mechanisms shaping localizable trajectories and/or resulting in more globalized regimes. By expanding the data with patents and scholarly publications, we demonstrate the use of this multi-perspective approach in the case of RNA Interference (RNAi). The possibility to develop an “Innovation Opportunities Explorer” is specified.
💡 Research Summary
The paper reconceptualizes innovation as a fundamentally nonlinear process that unfolds across the intertwined domains of science, technology, and the economy. Rather than treating innovation as a sequential pipeline, the authors propose a “multicontinent” model in which distinct data landscapes—representing supply‑side knowledge creation and demand‑side societal needs—evolve, expand, and intersect over time. To operationalize this model, they exploit the hierarchical structure of Medical Subject Headings (MeSH) in the MEDLINE database, assigning branches such as “Drugs and Chemicals” and “Techniques and Equipment” to the supply perspective, and “Diseases” and “Health Services” to the demand perspective.
In addition to MeSH, the study incorporates patent records (as proxies for technological implementation and commercial protection) and scholarly publications (as indicators of basic scientific discovery). Each dataset is independently pre‑processed: titles, abstracts, claims, and MeSH terms are tokenized, and yearly co‑occurrence matrices are built to capture how concepts appear together within a given year.
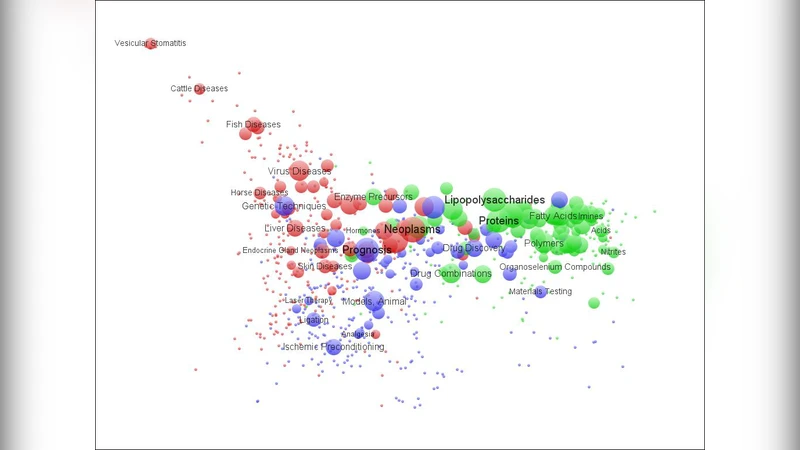
The core analytical engine consists of nonlinear dimensionality reduction (t‑SNE, UMAP) followed by clustering. These steps compress high‑dimensional co‑occurrence data into a two‑ or three‑dimensional visual space where each “continent” appears as a distinct island. By animating the islands across successive years, the authors generate dynamic maps that reveal growth, contraction, migration, and, crucially, overlapping zones where supply and demand continents intersect. Such overlap zones are interpreted as moments of selection pressure, knowledge recombination, or regime shift—points at which an emerging technology aligns with a pressing market or societal need.
The methodology is illustrated with the case of RNA interference (RNAi). Starting from the seminal 1998 Fire‑Mello papers, the authors trace a three‑phase trajectory: (1) early academic discovery, (2) rapid expansion of patent activity between 2003 and 2005, and (3) subsequent clinical and commercial maturation after 2010. Supply‑side islands (MeSH categories “RNA‑mediated gene silencing,” related chemicals, and techniques) swell dramatically during the patent boom, while demand‑side islands (MeSH categories “Cancer,” “Viral Infection,” etc.) concurrently move toward the supply islands. The period 2003‑2005 produces a pronounced overlap, coinciding with heightened venture‑capital investment and policy attention, thus validating the model’s ability to pinpoint “innovation hotspots.”
Building on these insights, the authors outline an “Innovation Opportunities Explorer” (IOE). The IOE would integrate continuous data feeds from PubMed, USPTO, Web of Science, and possibly market intelligence sources; automatically generate co‑occurrence matrices; run the dimensionality‑reduction‑clustering pipeline; and render interactive, time‑animated maps. An alert subsystem would flag emerging overlap zones, providing policymakers, corporate R&D managers, and investors with early warnings of nascent opportunity clusters.
In conclusion, the paper demonstrates that a multi‑perspective, nonlinear scientometric approach can reveal the hidden dynamics of innovation that linear models overlook. By visualizing and quantifying the interaction between knowledge supply and societal demand, the framework offers a powerful decision‑support tool for science‑technology policy, corporate strategy, and venture investment. Future work is suggested to enrich the data ecosystem (e.g., social media, corporate reports) and to embed predictive machine‑learning models that estimate the probability that a detected overlap will translate into market success, thereby refining the IOE’s practical utility.
Comments & Academic Discussion
Loading comments...
Leave a Comment