Complexity-Entropy Causality Plane as a Complexity Measure for Two-dimensional Patterns
Complexity measures are essential to understand complex systems and there are numerous definitions to analyze one-dimensional data. However, extensions of these approaches to two or higher-dimensional data, such as images, are much less common. Here, we reduce this gap by applying the ideas of the permutation entropy combined with a relative entropic index. We build up a numerical procedure that can be easily implemented to evaluate the complexity of two or higher-dimensional patterns. We work out this method in different scenarios where numerical experiments and empirical data were taken into account. Specifically, we have applied the method to i) fractal landscapes generated numerically where we compare our measures with the Hurst exponent; ii) liquid crystal textures where nematic-isotropic-nematic phase transitions were properly identified; iii) 12 characteristic textures of liquid crystals where the different values show that the method can distinguish different phases; iv) and Ising surfaces where our method identified the critical temperature and also proved to be stable.
💡 Research Summary
The paper introduces a novel framework for quantifying the complexity of two‑dimensional (and higher‑dimensional) patterns by extending the well‑known permutation entropy (PE) concept to spatial data and coupling it with a relative entropic index to form a Complexity‑Entropy Causality Plane (CECP). Traditional PE is defined for one‑dimensional time series: a sliding window of length d is transformed into a permutation pattern based on the ordinal ranking of its values, and the Shannon entropy of the pattern distribution provides a measure of randomness. To apply this to images, the authors propose a two‑dimensional sliding window of size d₁ × d₂ that moves across the pixel grid. Within each window the pixel intensities are ranked, yielding a two‑dimensional permutation code. By counting the occurrences of all possible codes across the whole image, a probability distribution P(i) is obtained. The normalized permutation entropy H = –∑ P(i) log P(i) / log(N!) (with N = d₁·d₂) captures the degree of disorder, while a relative entropy D, defined as the normalized Kullback‑Leibler divergence between P(i) and the uniform distribution, quantifies the distance from complete randomness. The product C = H·D is taken as the statistical complexity. Plotting each image as a point (H, C) on the CECP yields a visual map where completely ordered, completely random, and intermediate (complex) structures occupy distinct regions.
The methodology is deliberately simple and computationally inexpensive: the ranking operation is linear in the number of pixels, and the only tunable parameters are the window dimensions and the overlap fraction, which together control the spatial scale of the analysis. The authors discuss practical guidelines for choosing (d₁, d₂) to ensure sufficient sampling of the factorial number of possible permutations, especially when N becomes large.
Four experimental case studies validate the approach.
-
Fractal landscapes: Numerically generated fractional Brownian surfaces with varying Hurst exponent Hₛ are analyzed. The CECP reveals a monotonic relationship: surfaces with Hₛ ≈ 0.5 (near‑random) exhibit high entropy and low complexity, whereas surfaces with strong long‑range correlations (Hₛ > 0.7) show reduced entropy but elevated complexity. This behavior mirrors the known link between Hurst exponent and fractal dimension, confirming that the CECP captures the same scaling information in a different guise.
-
Liquid‑crystal textures (phase transition): Polarizing microscopy images of a nematic liquid crystal undergoing a nematic‑isotropic‑nematic transition are examined at successive temperatures. As the system approaches the transition temperature, both H and C change sharply; the CECP point moves from the ordered region (low temperature nematic) into the high‑complexity zone at the transition, then back toward the ordered region for the high‑temperature isotropic phase. The method thus successfully identifies the critical temperature without any prior knowledge of the underlying physics.
-
Classification of twelve characteristic liquid‑crystal textures: A set of representative textures (e.g., schlieren, focal conic, stripe, etc.) is processed. Each texture occupies a distinct location on the CECP, and clustering analysis based on (H, C) separates the textures with high accuracy. This demonstrates that the CECP can serve as a low‑dimensional feature space for texture classification, potentially replacing more computationally heavy descriptors such as Gabor filters or wavelet coefficients.
-
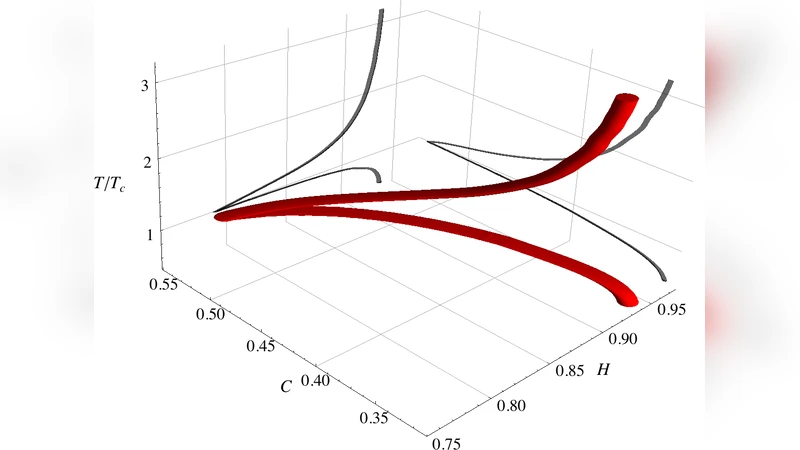
2‑D Ising model surfaces: Monte‑Carlo simulations of the Ising model on a square lattice generate spin‑up/spin‑down surface maps at various temperatures. The CECP trajectory as a function of temperature shows a pronounced peak in complexity at the critical temperature T_c ≈ 2.269 J/k_B, while entropy exhibits a rapid increase. The peak persists under added Gaussian noise, indicating robustness to measurement imperfections. This result aligns with the known divergence of correlation length at criticality, confirming that the CECP captures critical phenomena in spatial data.
Across all examples, the CECP proves to be scale‑sensitive (by varying window size), computationally tractable, and robust to noise. Compared with traditional fractal dimension estimation, spectral analysis, or higher‑order statistical moments, the CECP offers a unified scalar‑pair representation that simultaneously encodes randomness (entropy) and structural richness (complexity).
The authors acknowledge limitations: as the window size grows, the factorial growth of possible permutations demands larger images to obtain reliable statistics; non‑rectangular or irregular sampling grids would require a more elaborate definition of ordinal patterns. They propose future extensions to three‑dimensional volumetric data (e.g., medical imaging, turbulence fields), integration with deep‑learning preprocessing (e.g., auto‑encoders to reduce dimensionality before ordinal encoding), and real‑time implementation for video streams to monitor dynamic phase transitions.
In summary, the paper delivers a practical, theoretically grounded tool for assessing the informational and structural content of two‑dimensional patterns. By marrying permutation entropy with a relative entropic index, the Complexity‑Entropy Causality Plane provides a concise yet powerful descriptor that can differentiate between random, ordered, and complex states, identify critical points, and support classification tasks across a broad spectrum of scientific and engineering applications.