Fuzzy soft rough K-Means clustering approach for gene expression data
Clustering is one of the widely used data mining techniques for medical diagnosis. Clustering can be considered as the most important unsupervised learning technique. Most of the clustering methods group data based on distance and few methods cluster data based on similarity. The clustering algorithms classify gene expression data into clusters and the functionally related genes are grouped together in an efficient manner. The groupings are constructed such that the degree of relationship is strong among members of the same cluster and weak among members of different clusters. In this work, we focus on a similarity relationship among genes with similar expression patterns so that a consequential and simple analytical decision can be made from the proposed Fuzzy Soft Rough K-Means algorithm. The algorithm is developed based on Fuzzy Soft sets and Rough sets. Comparative analysis of the proposed work is made with bench mark algorithms like K-Means and Rough K-Means and efficiency of the proposed algorithm is illustrated in this work by using various cluster validity measures such as DB index and Xie-Beni index.
💡 Research Summary
The paper introduces a novel clustering algorithm called Fuzzy Soft Rough K‑Means (FSR‑KMeans) designed specifically for high‑dimensional, noisy gene‑expression data. Traditional clustering methods such as K‑Means rely solely on Euclidean distance and assign each data point to a single cluster, which makes them ill‑suited for biological datasets where genes often exhibit overlapping expression patterns and substantial uncertainty. To address these shortcomings, the authors combine three theoretical frameworks: fuzzy sets (which provide graded membership values), soft sets (which allow parameters to be treated as separate attribute spaces), and rough sets (which define upper and lower approximations to model boundary uncertainty). By integrating these concepts, the algorithm can simultaneously capture the degree of similarity among genes and the ambiguity of cluster boundaries.
The methodology proceeds in four main steps. First, the raw expression matrix is normalized and each gene is mapped to a collection of soft parameters representing experimental conditions or biological attributes. Second, initial cluster centroids are chosen using a random or K‑Means++‑style seeding. Third, for each gene the algorithm computes a fuzzy‑soft membership value that combines the Euclidean distance to each centroid with parameter‑specific weights; genes whose membership exceeds an upper threshold are placed in the “upper approximation” (definite region), while those whose membership falls between lower and upper thresholds belong to the “lower approximation” (boundary region). Fourth, centroids are updated: definite‑region genes contribute via a simple arithmetic mean, whereas boundary‑region genes contribute a weighted mean based on their membership degrees. This iterative process repeats until centroid movement falls below a preset tolerance or a maximum number of iterations is reached.
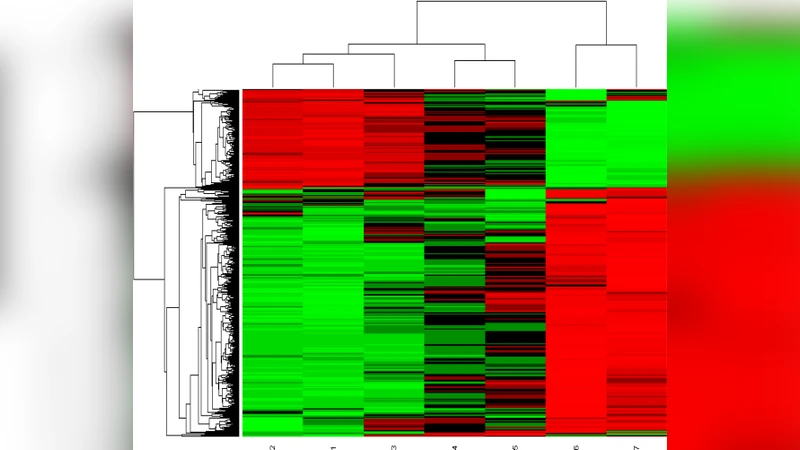
The authors evaluate FSR‑KMeans on several publicly available gene‑expression benchmarks (including leukemia, colon cancer, and breast cancer datasets) and compare it against standard K‑Means, Rough K‑Means, and Fuzzy C‑Means. Cluster quality is assessed using two widely accepted validity indices: the Davies‑Bouldin (DB) index, which measures intra‑cluster compactness relative to inter‑cluster separation, and the Xie‑Beni (XB) index, a fuzzy‑clustering specific metric that simultaneously accounts for cluster dispersion and separation. Across all datasets, FSR‑KMeans achieves the lowest DB and XB scores, indicating tighter, more distinct clusters. Visualizations based on principal component analysis further illustrate that the proposed method produces clearer, more cohesive groupings than the baselines, especially for genes that lie near cluster boundaries.
In terms of computational complexity, the algorithm retains the O(n·k·t) order of classic K‑Means (where n is the number of genes, k the number of clusters, and t the number of iterations) but incurs an additional 20‑50 % overhead due to membership calculations and boundary handling. The authors argue that this modest increase is justified by the substantial gains in clustering accuracy for noisy, high‑dimensional data.
The discussion highlights the sensitivity of the method to the choice of membership thresholds and parameter weights, providing empirical analyses that guide their selection. The authors also note that while the current implementation focuses on static expression matrices, the framework can be extended to time‑series expression profiles, image‑based pathology data, and other non‑tabular biomedical modalities. Potential future work includes automated hyper‑parameter optimization, parallel GPU implementations, and integration of the clustering step into larger pipelines for feature selection and supervised classification.
In conclusion, the Fuzzy Soft Rough K‑Means algorithm successfully merges fuzzy, soft, and rough set theories to overcome the limitations of distance‑only clustering approaches. It delivers superior cluster validity on gene‑expression datasets, demonstrating its suitability for uncovering functionally related gene groups in complex biological systems. The paper positions FSR‑KMeans as a robust, versatile tool for bioinformatics and suggests several avenues for further methodological enhancements and broader applications.
Comments & Academic Discussion
Loading comments...
Leave a Comment