Influence of the Dynamic Social Network Timeframe Type and Size on the Group Evolution Discovery
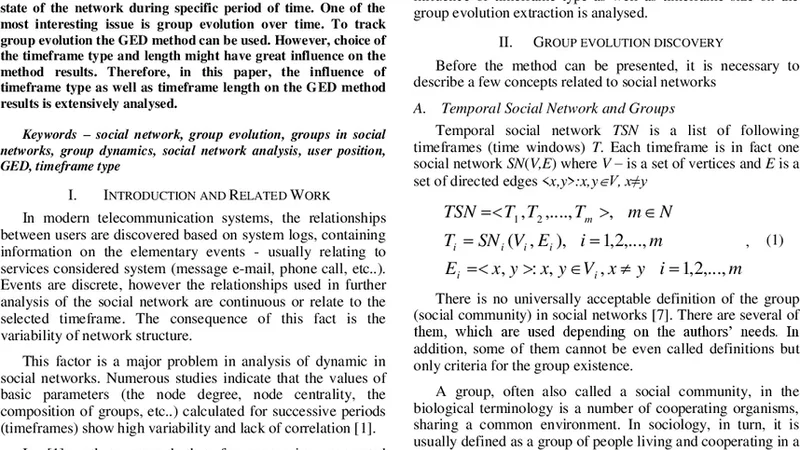
New technologies allow to store vast amount of data about users interaction. From those data the social network can be created. Additionally, because usually also time and dates of this activities are stored, the dynamic of such network can be analysed by splitting it into many timeframes representing the state of the network during specific period of time. One of the most interesting issue is group evolution over time. To track group evolution the GED method can be used. However, choice of the timeframe type and length might have great influence on the method results. Therefore, in this paper, the influence of timeframe type as well as timeframe length on the GED method results is extensively analysed.
💡 Research Summary
The paper investigates how the choice of timeframe type and length influences the results of the Group Evolution Discovery (GED) method when applied to dynamic social networks. Modern digital platforms generate massive logs of user interactions, each stamped with a timestamp, enabling the construction of time‑varying social graphs. To study the evolution of communities within such graphs, researchers typically slice the continuous stream of interactions into discrete timeframes that represent the network’s state over a specific period. The authors argue that the way these timeframes are defined—both in terms of their temporal granularity (size) and their overlapping strategy (type)—can dramatically affect the detection of community evolution events such as birth, death, growth, contraction, merging, and splitting.
The study begins by formalising three common timeframe constructions: (1) Fixed (non‑overlapping) windows, where each timeframe is a distinct block of time; (2) Sliding windows, where each new timeframe shifts forward by a fixed step, creating partial overlap; and (3) Overlapping windows, where a predefined percentage (e.g., 50 %) of each window overlaps with the next. For each construction the authors vary the window length across six values—30, 60, 90, 120, 150, and 180 days—yielding 18 experimental configurations.
GED operates by first detecting communities in each timeframe using a standard clustering algorithm (the paper uses the Louvain method) and then matching communities across consecutive timeframes. Matching is based on the Jaccard similarity of member sets, with two thresholds α and β (default 0.5) governing the minimum overlap required for a “successor” relationship. Once matches are established, GED classifies the transition into one of six event types: continuation, growth, contraction, split, merge, formation, or dissolution.
Using a real‑world online forum dataset containing millions of posts and replies, the authors apply GED under all 18 configurations and record the number and distribution of detected events, the average lifespan of communities, and the stability of event classification across runs. The quantitative analysis reveals two dominant patterns.
First, shorter windows (30 days) produce a proliferation of events, especially formations and dissolutions. Because a 30‑day slice captures many transient interactions, the algorithm frequently interprets temporary spikes in activity as distinct communities, inflating the event count. As the window expands to 180 days, only the most persistent relationships survive, leading to a sharp drop in total events and, notably, an almost complete disappearance of complex events such as merges and splits. This demonstrates that longer windows smooth out short‑term noise but may also obscure meaningful intermediate‑scale dynamics.
Second, the timeframe type modulates the stability of event detection. Fixed windows suffer from “boundary effects”: a community that straddles the border of two windows may be split artificially, causing spurious birth/death events at each boundary. Sliding windows mitigate this by providing a continuous overlap, but the overlapping region is counted twice, inflating the total number of events. Overlapping windows with a moderate overlap (≈50 %) strike a balance: they preserve continuity without excessive duplication, resulting in the most consistent event classification across the dataset.
A sensitivity analysis on the α and β thresholds further refines the findings. Lowering the thresholds to 0.3 relaxes the matching criteria, dramatically increasing the number of detected events but also introducing a high proportion of false positives—minor fluctuations are labeled as genuine evolution. Raising the thresholds to 0.7 makes the matching stricter, reducing noise but also eliminating subtle growth or contraction events that may be analytically important. Consequently, the authors recommend tuning α and β in conjunction with the chosen timeframe configuration to align with the specific research goal.
From these observations the authors derive practical guidelines. For studies focused on rapid, short‑term phenomena (e.g., viral content spread, flash mobs), a short sliding window (30 days) is appropriate, provided the analyst accepts a higher false‑positive rate or compensates by tightening α/β. For investigations of longer‑term structural change (e.g., community consolidation, organizational evolution), a medium‑length overlapping window (60–90 days with 50 % overlap) yields the most reliable detection of merges, splits, and sustained growth. The paper emphasizes that timeframe selection is not a neutral preprocessing step; it fundamentally shapes the narrative of community evolution that GED will produce.
In conclusion, the research demonstrates that both the temporal granularity and the overlapping strategy of timeframes exert a decisive influence on GED outcomes. Researchers must therefore conduct preliminary experiments to identify the optimal combination of window size, type, and similarity thresholds for their particular dataset and analytical objectives. By doing so, they can avoid misleading interpretations caused by artificial fragmentation or over‑aggregation of social interactions, and they can extract a more faithful representation of how groups truly evolve over time.
Comments & Academic Discussion
Loading comments...
Leave a Comment