The Limitations of Simple Gene Set Enrichment Analysis Assuming Gene Independence
Since its first publication in 2003, the Gene Set Enrichment Analysis (GSEA) method, based on the Kolmogorov-Smirnov statistic, has been heavily used, modified, and also questioned. Recently a simplified approach, using a one sample t test score to assess enrichment and ignoring gene-gene correlations was proposed by Irizarry et al. 2009 as a serious contender. The argument criticizes GSEA’s nonparametric nature and its use of an empirical null distribution as unnecessary and hard to compute. We refute these claims by careful consideration of the assumptions of the simplified method and its results, including a comparison with GSEA’s on a large benchmark set of 50 datasets. Our results provide strong empirical evidence that gene-gene correlations cannot be ignored due to the significant variance inflation they produced on the enrichment scores and should be taken into account when estimating gene set enrichment significance. In addition, we discuss the challenges that the complex correlation structure and multi-modality of gene sets pose more generally for gene set enrichment methods.
💡 Research Summary
This paper critically evaluates the “Simple Enrichment Analysis” (SEA) proposed by Irizarry et al. (2009) against the established Gene Set Enrichment Analysis (GSEA). SEA treats each gene’s two‑sample t‑statistic as a local score and aggregates these scores into a global z‑score (and optionally a χ² score). Its core assumption is that genes are independent and identically distributed, allowing the global statistics to be modeled by a standard normal null distribution. GSEA, by contrast, uses a signal‑to‑noise ratio as a local statistic and a weighted Kolmogorov‑Smirnov (KS) statistic as the global enrichment score. GSEA derives an empirical null distribution through phenotype permutation, normalizes for gene‑set size, and thus accounts for gene‑gene correlations.
To compare the methods, the authors applied both SEA and GSEA to a comprehensive benchmark of 50 publicly available microarray datasets spanning diverse phenotypes, platforms, and gene‑set libraries. The analysis was performed with identical preprocessing and identical FDR estimation procedures for both methods. Results consistently showed that SEA reported far more significant gene sets than GSEA. For example, in the Pancreas dataset SEA identified 570 gene sets at a stringent q‑value < 0.05, whereas GSEA identified only 121 at the conventional q‑value < 0.25. Similar inflation of significant results was observed across the majority of datasets, especially those with larger numbers of genes and stronger gene‑phenotype correlations.
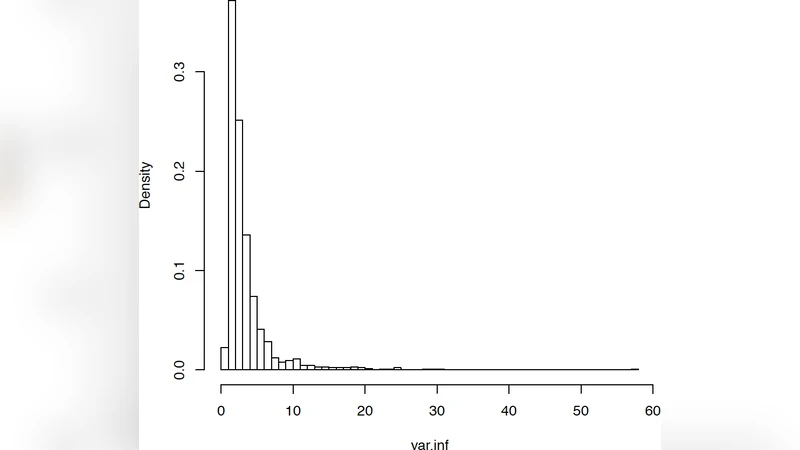
The authors attribute this over‑calling to variance inflation caused by ignoring gene‑gene correlations. Random label permutation experiments demonstrated that SEA’s theoretical normal null dramatically underestimates the true variance, leading to a high false‑positive rate. Moreover, SEA’s assumption of i.i.d. normality fails to capture the multi‑modal and heterogeneous expression patterns that are common within biologically defined gene sets. In contrast, GSEA’s permutation‑based null and weighted KS statistic naturally accommodate these complexities, yielding more reliable p‑values and q‑values.
The paper concludes that the independence assumption underlying SEA is unrealistic for most real‑world expression data, and that SEA’s simplicity comes at the cost of statistical validity. GSEA, despite its computational demands, provides a more robust framework by preserving gene‑set correlation structure and using an empirical null. The authors suggest that future advances should focus on improving gene‑set definitions (higher resolution) and developing statistical models that explicitly incorporate complex correlation structures rather than relying on naïve independence assumptions.
Comments & Academic Discussion
Loading comments...
Leave a Comment